| Param | Original file | Final file |
|---|---|---|
| Filename | modeM0/AS1C07_001T10_9000005806_42468cztM0_level2.fits | modeM0/AS1C07_001T10_9000005806_42468cztM0_level2_quad_clean.evt |
| Size (bytes) | 868,371,840 | 219,758,400 |
| Size | 828.1 MB | 209.6 MB |
| Events in quadrant A | 7,360,017 | 1,489,242 |
| Events in quadrant B | 6,124,032 | 1,498,717 |
| Events in quadrant C | 7,344,677 | 1,454,302 |
| Events in quadrant D | 10,229,442 | 1,243,421 |
| Mode M9 | |||
|---|---|---|---|
| Quadrant | BADHDUFLAG | Total packets | Discarded packets |
| A | 0 | 35 | 0 |
| B | 0 | 36 | 0 |
| C | 0 | 36 | 0 |
| D | 0 | 36 | 0 |
| Mode SS | |||
|---|---|---|---|
| Quadrant | BADHDUFLAG | Total packets | Discarded packets |
| A | 0 | 286 | 0 |
| B | 0 | 286 | 0 |
| C | 0 | 286 | 0 |
| D | 0 | 286 | 0 |
| Mode M0 | |||
|---|---|---|---|
| Quadrant | BADHDUFLAG | Total packets | Discarded packets |
| A | 0 | 30914 | 3 |
| B | 0 | 29041 | 3 |
| C | 0 | 31403 | 3 |
| D | 0 | 40810 | 3 |
| Quadrant | Total seconds | Saturated seconds | Saturation percentage |
|---|---|---|---|
| A | 14009 | 41 | 0.292669% |
| B | 14009 | 52 | 0.371190% |
| C | 14009 | 44 | 0.314084% |
| D | 14008 | 1129 | 8.059680% |
Noise dominated data is calculated using 1-second bins in cleaned event files. If a bin has >2000 counts, and if more than 50% of those come from <1% of pixels, then it is considered to be noise-dominated and hence unusable.
| Quadrant | # 1 sec bins | Bins with >0 counts | Bins with >2000 counts | High rate bins dominated by noise | Noise dominated (total time) | Noise dominated (detector-on time) | Marked lightcurve |
|---|---|---|---|---|---|---|---|
| A | 16665 | 14011 | 24 | 24 | 0.14% | 0.17% | 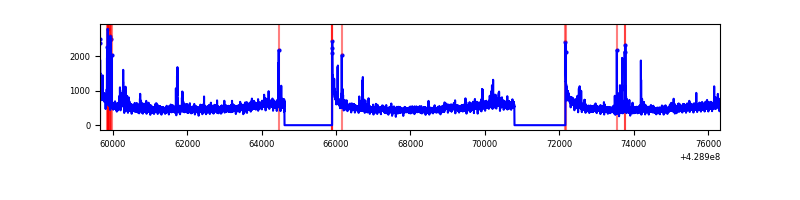 |
| B | 16665 | 14011 | 26 | 26 | 0.16% | 0.19% | 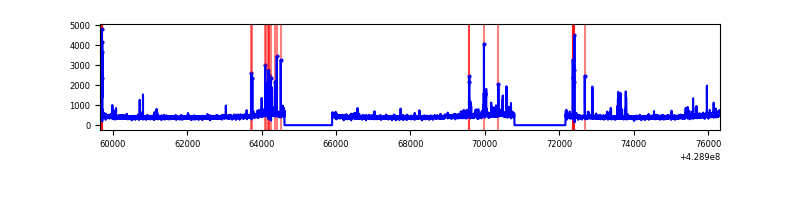 |
| C | 16665 | 14011 | 36 | 36 | 0.22% | 0.26% | 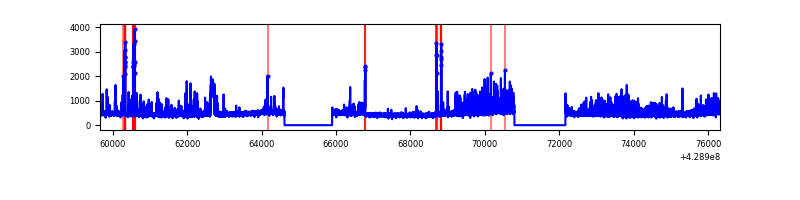 |
| D | 16664 | 14010 | 938 | 938 | 5.63% | 6.70% | 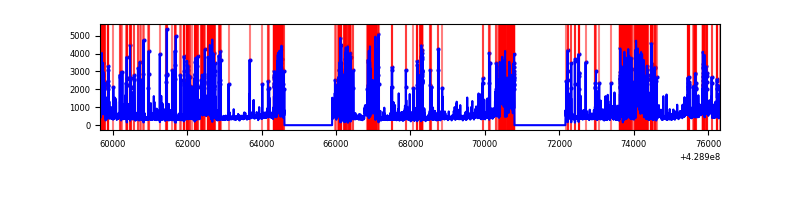 |
Top three noisy pixels from each quadrant. If the there are fewer than three noisy pixels in the level2.evt file, extra rows are filled as -1
| Pixel properties | Quadrant properties | ||||||
|---|---|---|---|---|---|---|---|
| Quadrant | DetID | PixID | Counts | Sigma | Mean | Median | Sigma |
| A | 10 | 83 | 1249491 | 4131.65 | 1475 | 1441 | 302.1 |
| A | 12 | 189 | 183662 | 603.24 | 1475 | 1441 | 302.1 |
| A | 13 | 248 | 115206 | 376.62 | 1475 | 1441 | 302.1 |
| B | 5 | 255 | 91887 | 323.2 | 1453 | 1414 | 279.9 |
| B | 0 | 186 | 90564 | 318.47 | 1453 | 1414 | 279.9 |
| B | 15 | 33 | 63483 | 221.73 | 1453 | 1414 | 279.9 |
| C | 10 | 34 | 717285 | 2157.22 | 1426 | 1433 | 331.8 |
| C | 15 | 214 | 577302 | 1735.38 | 1426 | 1433 | 331.8 |
| C | 9 | 54 | 349786 | 1049.76 | 1426 | 1433 | 331.8 |
| D | 12 | 6 | 1562670 | 4628.72 | 1388 | 1346 | 337.3 |
| D | 12 | 233 | 907950 | 2687.73 | 1388 | 1346 | 337.3 |
| D | 1 | 52 | 728234 | 2154.94 | 1388 | 1346 | 337.3 |
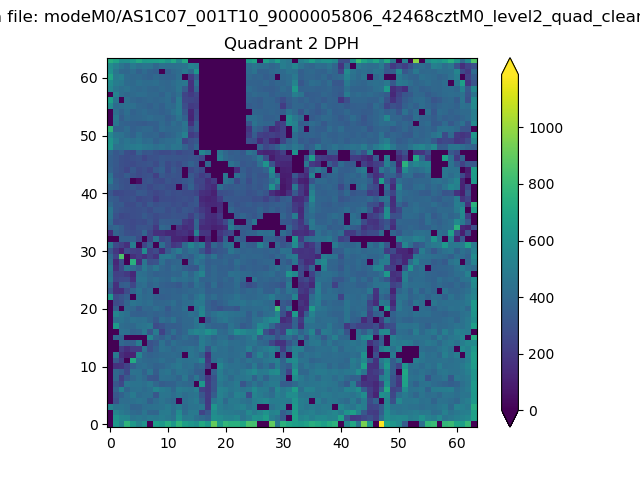
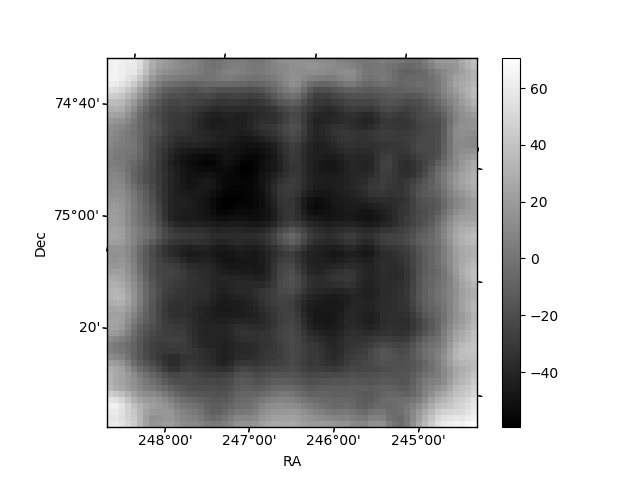
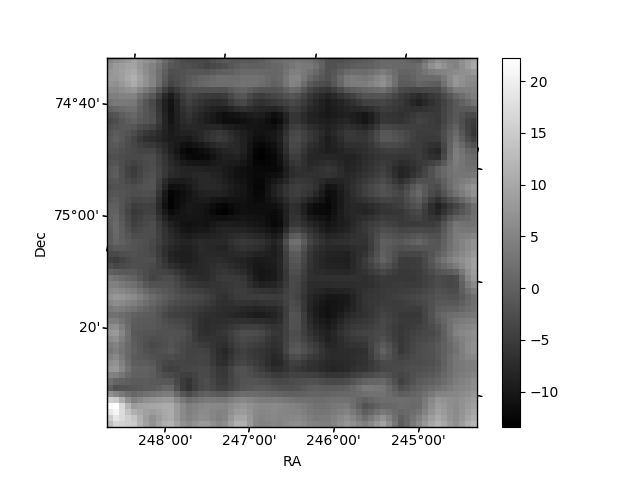
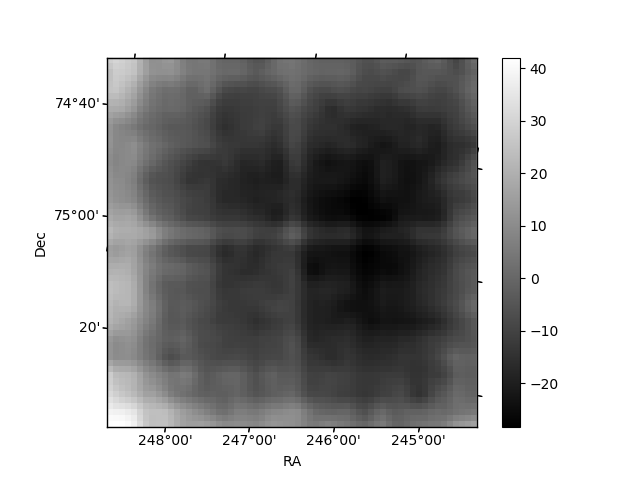
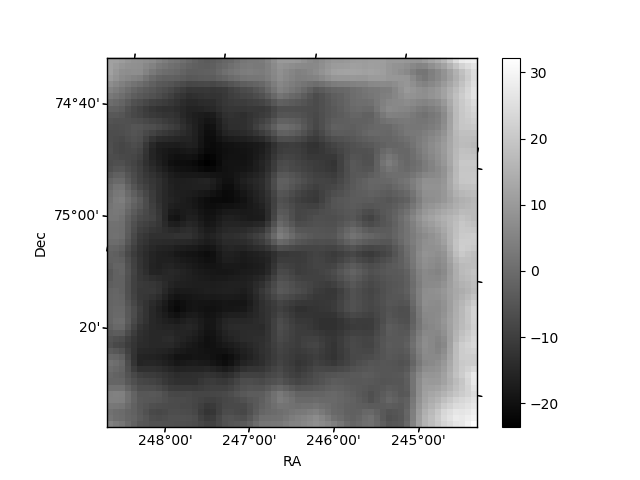
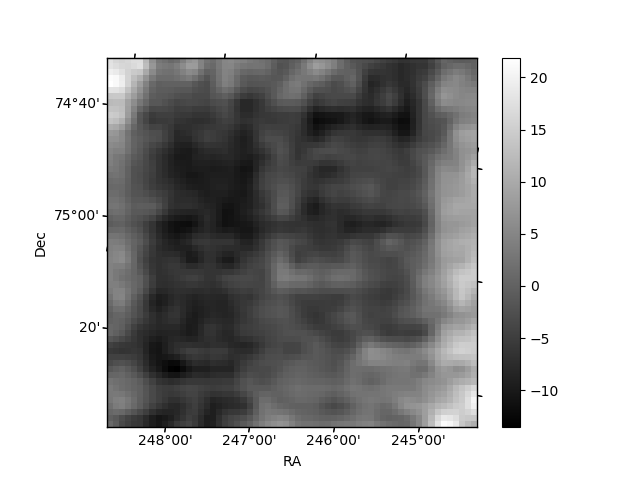
Histogram calculated using DETX and DETY for each event in the final _common_clean file
| Quadrant A | 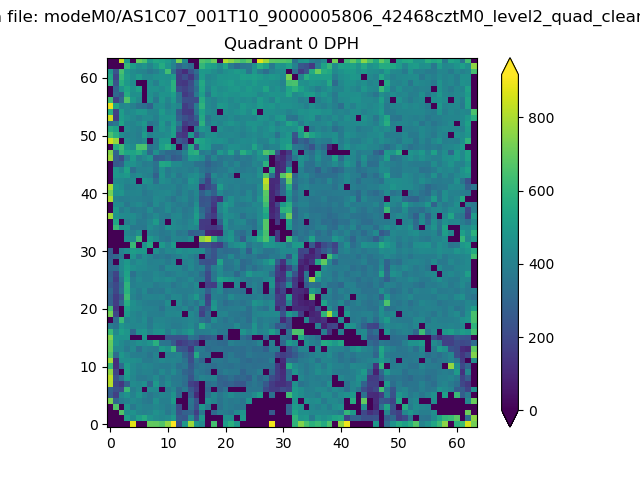 |
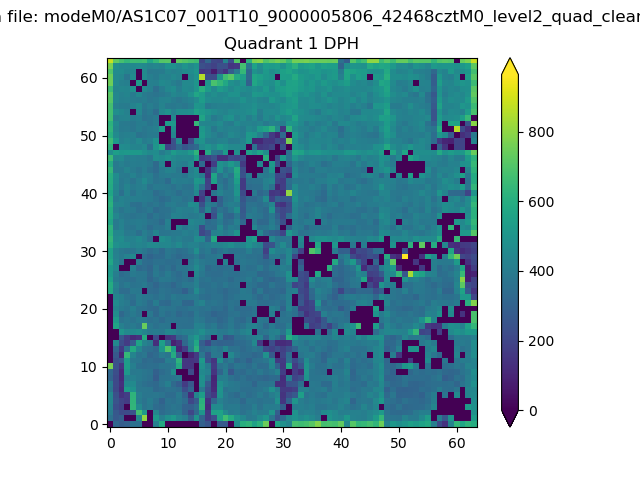 |
Quadrant B |
|---|---|---|---|
| Quadrant D | 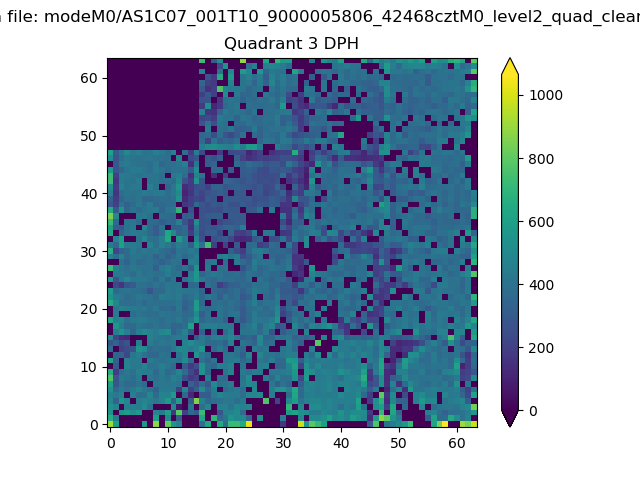 |
 |
Quadrant C |
| Plot type | Count rate plots | Images |
|---|---|---|
| Comparison with Poisson distribution Blue bars denote a histogram of data divided into 1 sec bins. Red curve is a Poisson curve with rate = median count rate of data. |
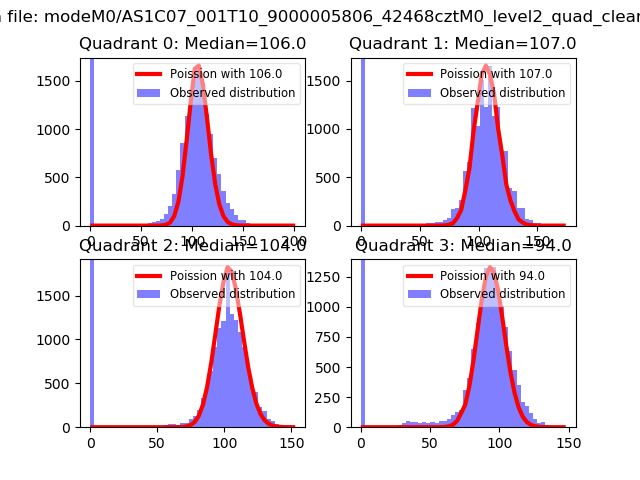 |
 |
| Quadrant-wise count rates Data is divided into 100 sec bins |
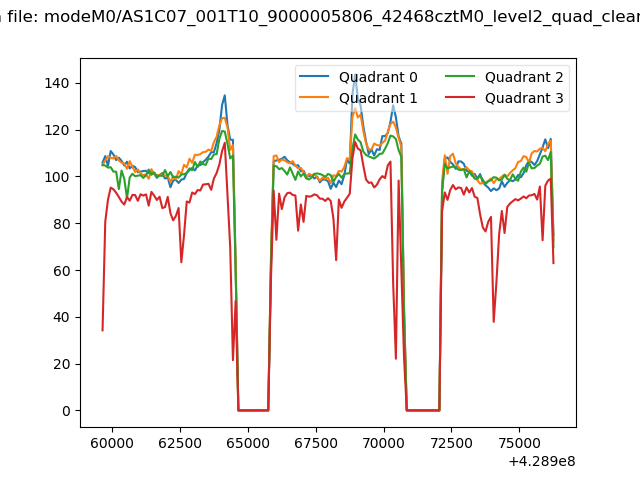 |
|
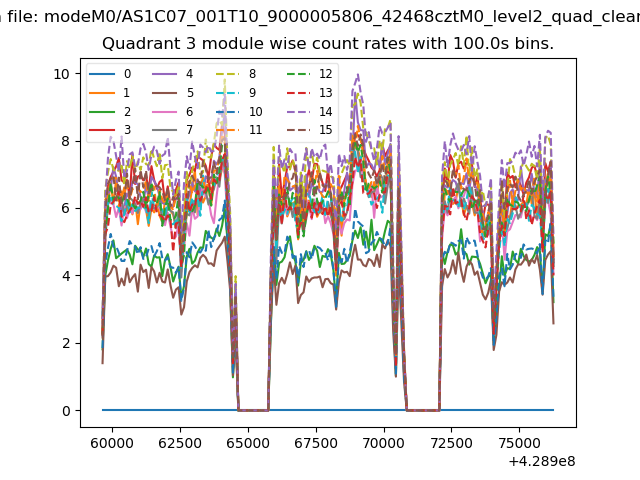
| Module-wise count rates for Quadrant A Data is divided into 100 sec bins |
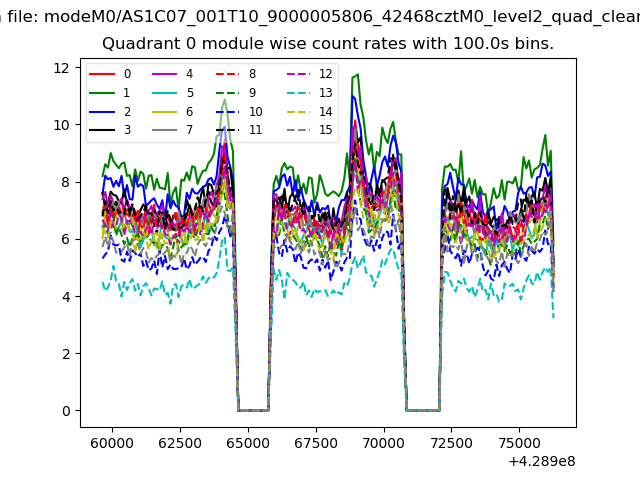 |
 |
| Module-wise count rates for Quadrant B Data is divided into 100 sec bins |
 |
 |
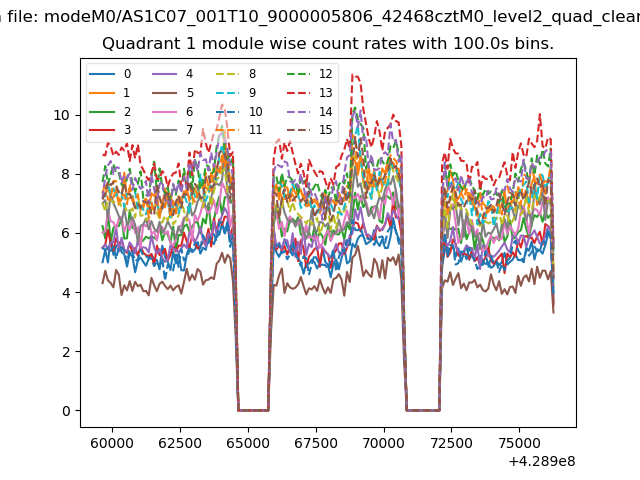
| Module-wise count rates for Quadrant C Data is divided into 100 sec bins |
 |
 |
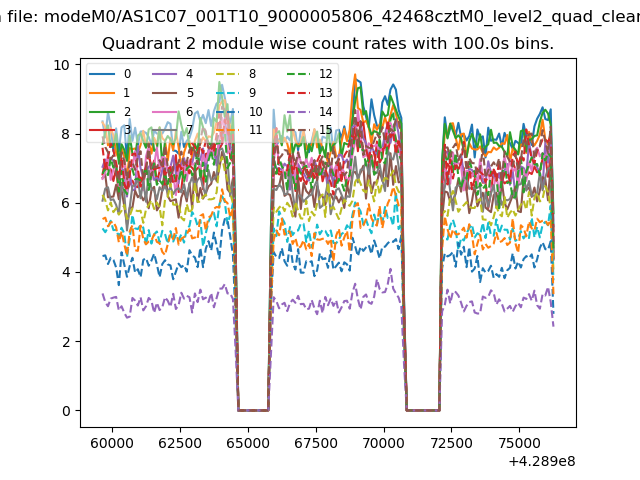
| Module-wise count rates for Quadrant D Data is divided into 100 sec bins |
 |
 |
| Parameter | Plot |
|---|---|
| CZT HV Monitor | 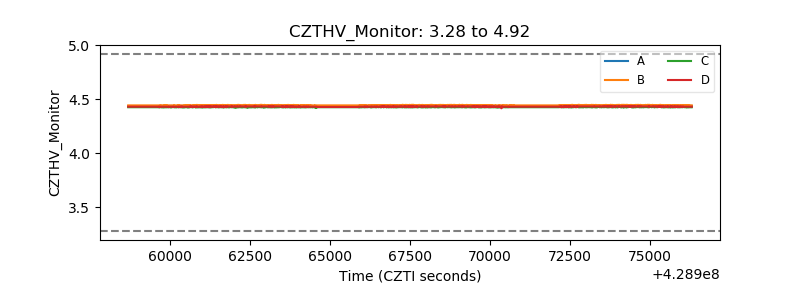 |
| D_VDD | 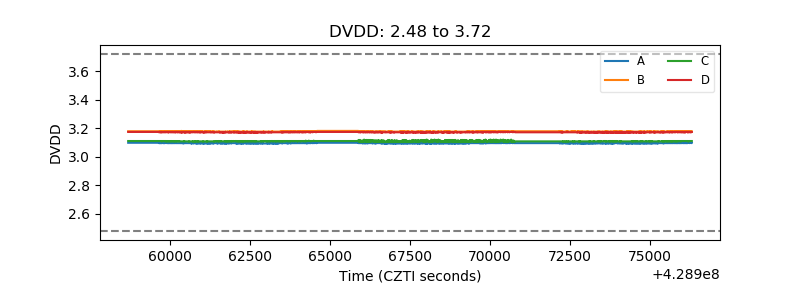 |
| Temperature 1 | 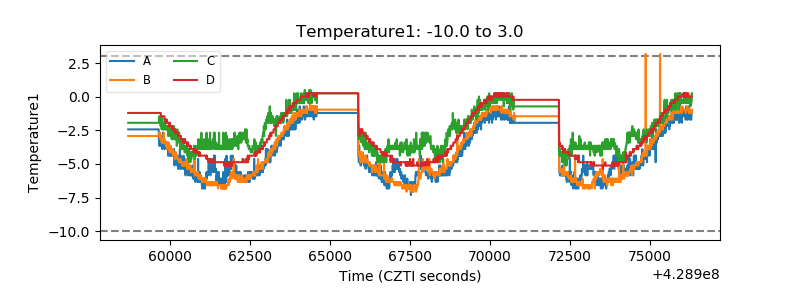 |
| Veto HV Monitor | 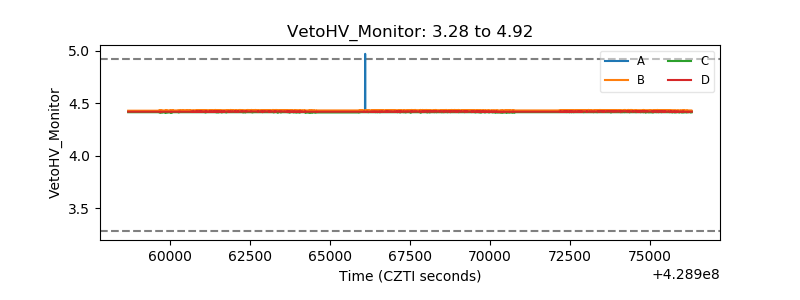 |
| Veto LLD | 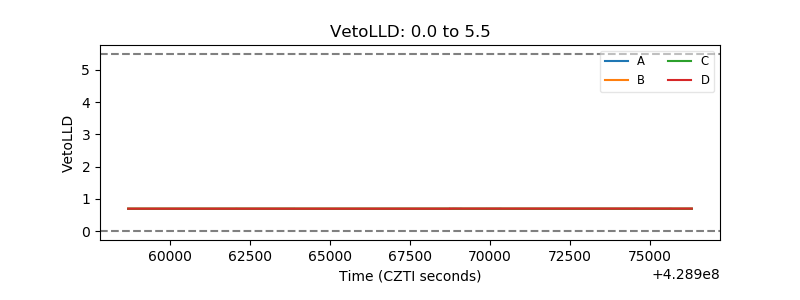 |
| Alpha Counter | 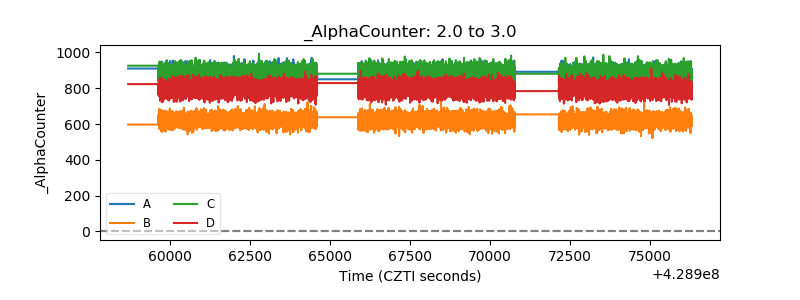 |
| _CPM_Rate | 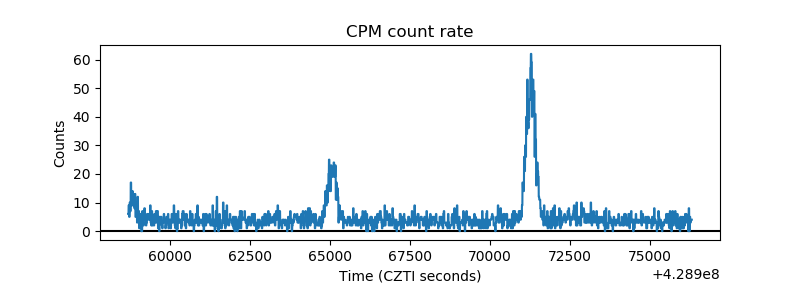 |
| CZT Counter | 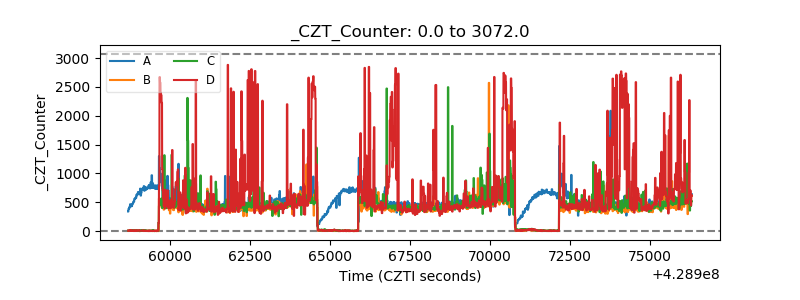 |
| +2.5 Volts monitor | 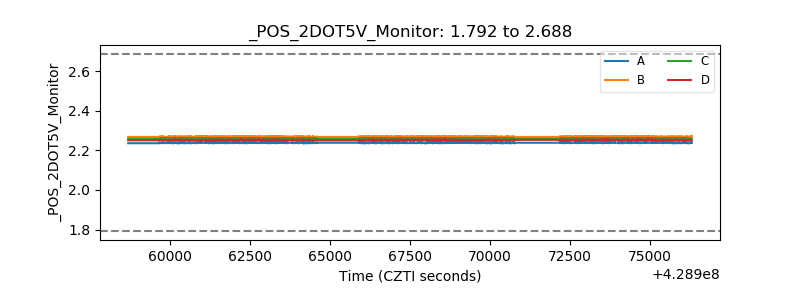 |
| +5 Volts monitor | 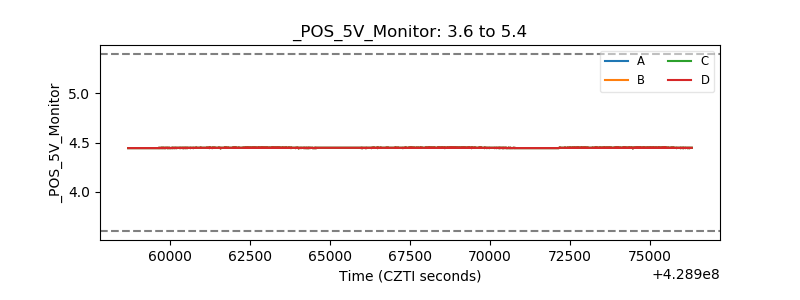 |
| _ROLL_ROT | 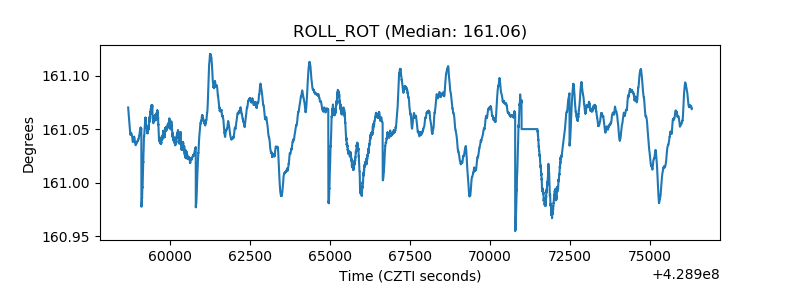 |
| _Roll_DEC | 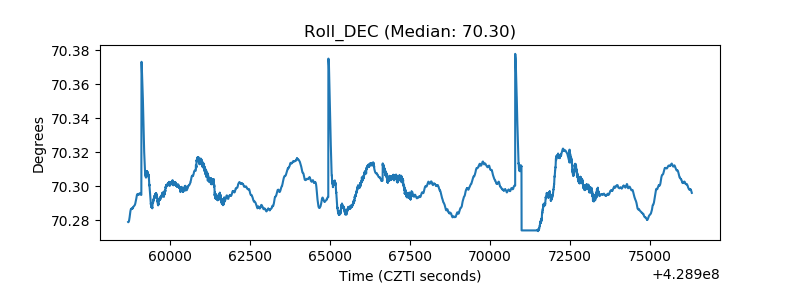 |
| _Roll_RA | 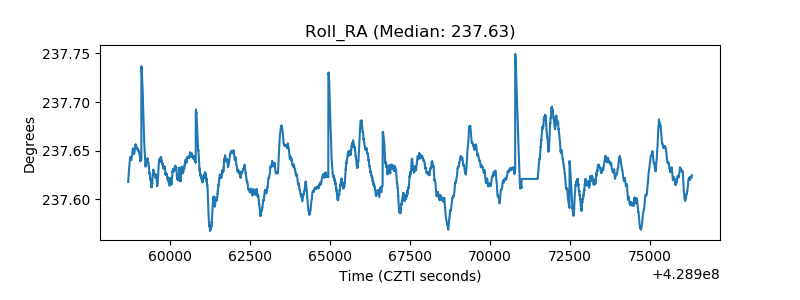 |
| Veto Counter | 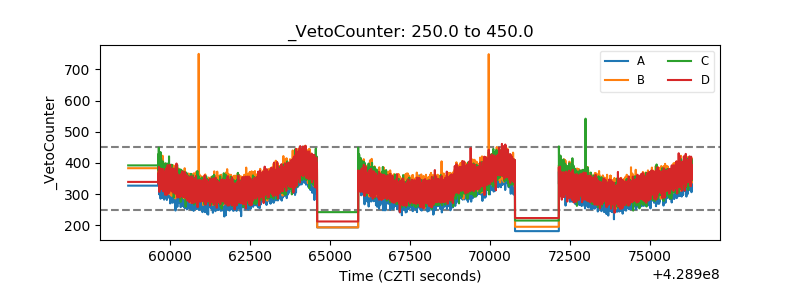 |