| Param | Original file | Final file |
|---|---|---|
| Filename | modeM0/AS1C07_001T10_9000005806_42469cztM0_level2.fits | modeM0/AS1C07_001T10_9000005806_42469cztM0_level2_quad_clean.evt |
| Size (bytes) | 434,145,600 | 109,909,440 |
| Size | 414.0 MB | 104.8 MB |
| Events in quadrant A | 3,745,178 | 737,590 |
| Events in quadrant B | 3,150,593 | 743,060 |
| Events in quadrant C | 3,800,396 | 724,073 |
| Events in quadrant D | 4,841,693 | 645,189 |
| Mode M9 | |||
|---|---|---|---|
| Quadrant | BADHDUFLAG | Total packets | Discarded packets |
| A | 0 | 31 | 0 |
| B | 0 | 31 | 0 |
| C | 0 | 31 | 0 |
| D | 0 | 31 | 0 |
| Mode SS | |||
|---|---|---|---|
| Quadrant | BADHDUFLAG | Total packets | Discarded packets |
| A | 0 | 142 | 0 |
| B | 0 | 142 | 0 |
| C | 0 | 142 | 0 |
| D | 0 | 142 | 0 |
| Mode M0 | |||
|---|---|---|---|
| Quadrant | BADHDUFLAG | Total packets | Discarded packets |
| A | 0 | 15503 | 2 |
| B | 0 | 14310 | 2 |
| C | 0 | 15899 | 2 |
| D | 0 | 19311 | 2 |
| Quadrant | Total seconds | Saturated seconds | Saturation percentage |
|---|---|---|---|
| A | 6855 | 28 | 0.408461% |
| B | 6855 | 25 | 0.364697% |
| C | 6855 | 20 | 0.291758% |
| D | 6855 | 403 | 5.878920% |
Noise dominated data is calculated using 1-second bins in cleaned event files. If a bin has >2000 counts, and if more than 50% of those come from <1% of pixels, then it is considered to be noise-dominated and hence unusable.
| Quadrant | # 1 sec bins | Bins with >0 counts | Bins with >2000 counts | High rate bins dominated by noise | Noise dominated (total time) | Noise dominated (detector-on time) | Marked lightcurve |
|---|---|---|---|---|---|---|---|
| A | 9959 | 6857 | 21 | 21 | 0.21% | 0.31% | 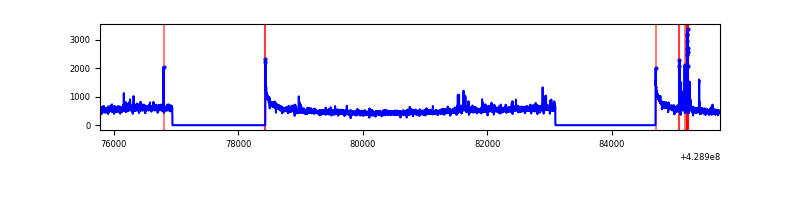 |
| B | 9959 | 6857 | 13 | 13 | 0.13% | 0.19% | 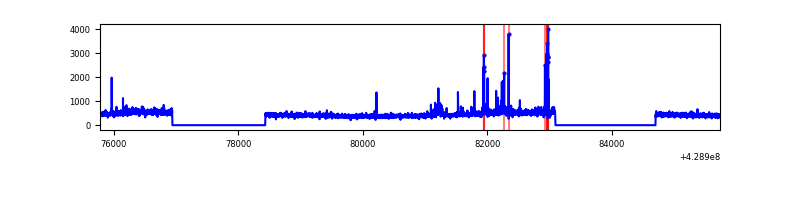 |
| C | 9959 | 6857 | 15 | 15 | 0.15% | 0.22% | 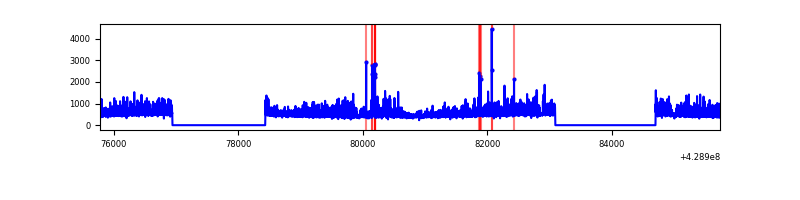 |
| D | 9959 | 6857 | 312 | 312 | 3.13% | 4.55% | 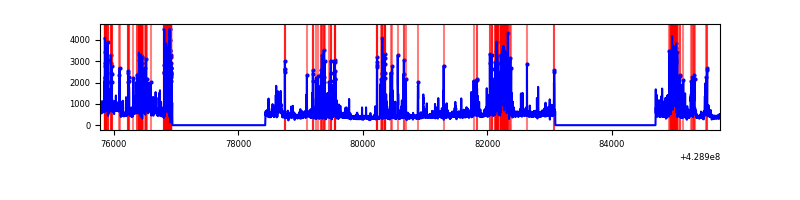 |
Top three noisy pixels from each quadrant. If the there are fewer than three noisy pixels in the level2.evt file, extra rows are filled as -1
| Pixel properties | Quadrant properties | ||||||
|---|---|---|---|---|---|---|---|
| Quadrant | DetID | PixID | Counts | Sigma | Mean | Median | Sigma |
| A | 10 | 83 | 692335 | 4554.9 | 740 | 724 | 151.8 |
| A | 12 | 189 | 79682 | 520.01 | 740 | 724 | 151.8 |
| A | 7 | 16 | 78772 | 514.02 | 740 | 724 | 151.8 |
| B | 0 | 186 | 89015 | 623.54 | 730 | 709 | 141.6 |
| B | 0 | 230 | 42663 | 296.24 | 730 | 709 | 141.6 |
| B | 5 | 255 | 41799 | 290.14 | 730 | 709 | 141.6 |
| C | 10 | 34 | 559935 | 3326.62 | 719 | 724 | 168.1 |
| C | 15 | 214 | 286409 | 1699.47 | 719 | 724 | 168.1 |
| C | 14 | 254 | 122311 | 723.29 | 719 | 724 | 168.1 |
| D | 1 | 52 | 587272 | 3342.02 | 710 | 689 | 175.5 |
| D | 12 | 6 | 510200 | 2902.91 | 710 | 689 | 175.5 |
| D | 12 | 233 | 266669 | 1515.4 | 710 | 689 | 175.5 |
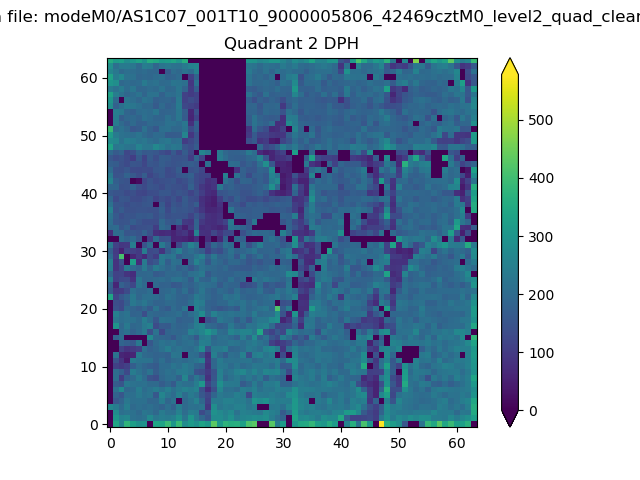
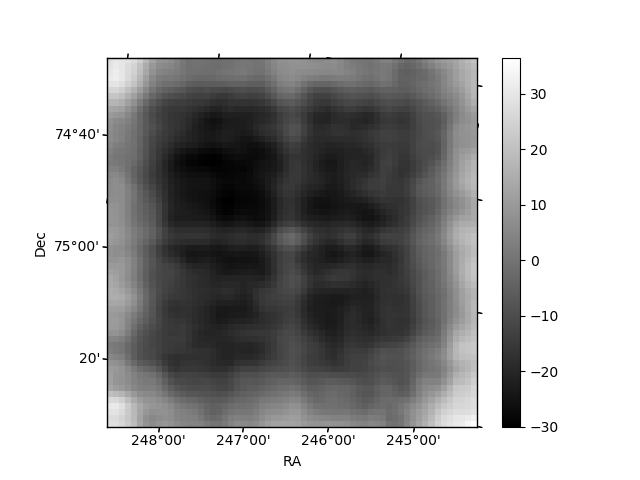
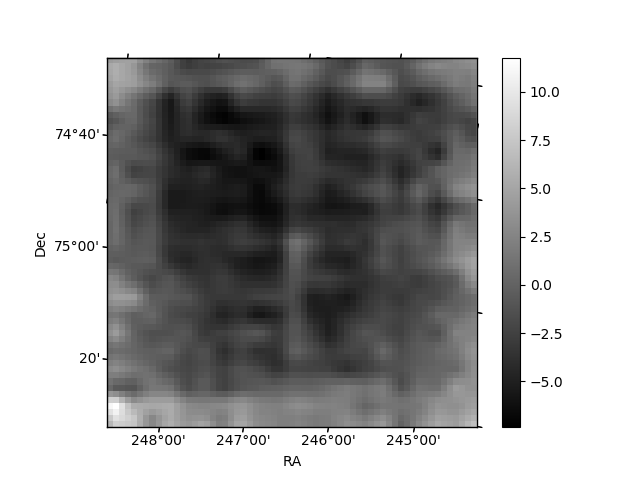
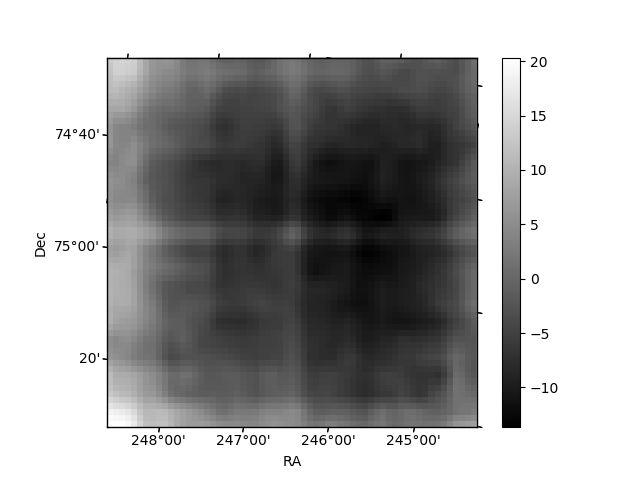
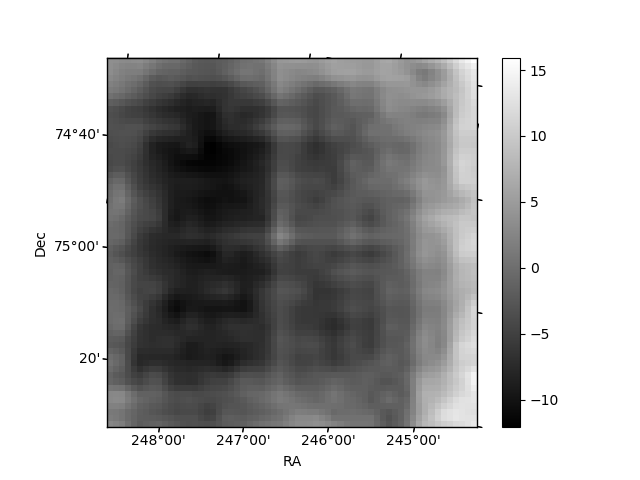
Histogram calculated using DETX and DETY for each event in the final _common_clean file
| Quadrant A | 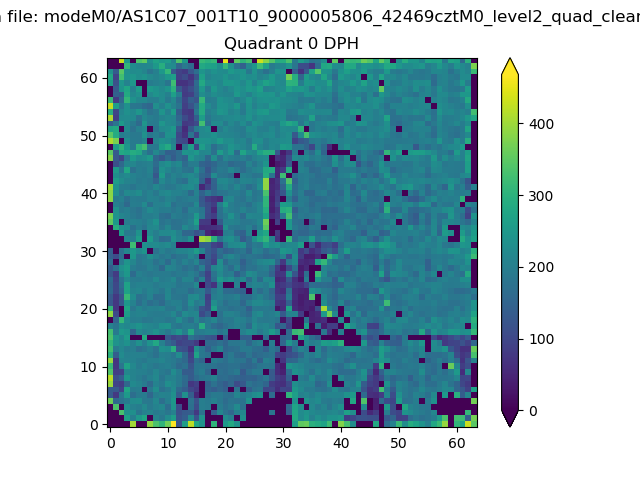 |
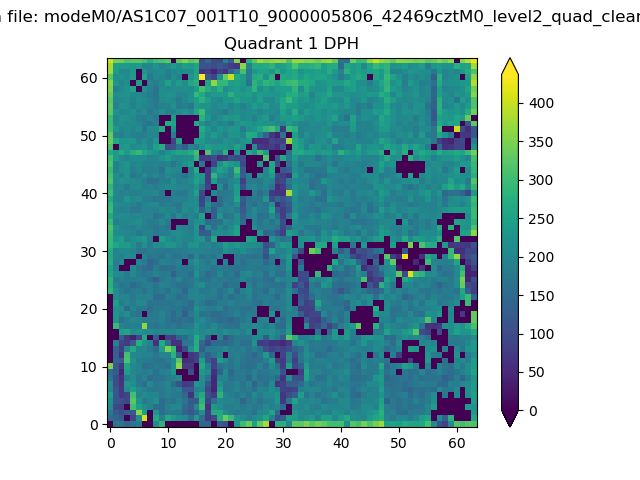 |
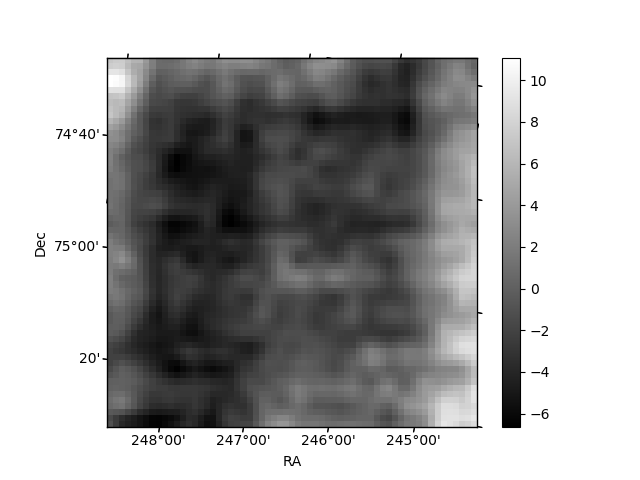
Quadrant B |
|---|---|---|---|
| Quadrant D | 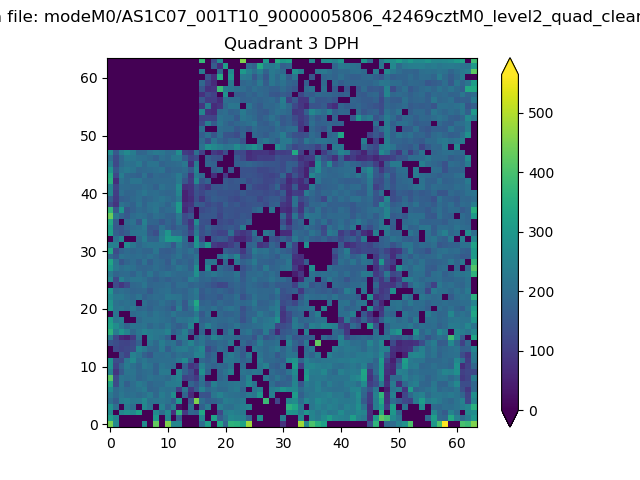 |
 |
Quadrant C |
| Plot type | Count rate plots | Images |
|---|---|---|
| Comparison with Poisson distribution Blue bars denote a histogram of data divided into 1 sec bins. Red curve is a Poisson curve with rate = median count rate of data. |
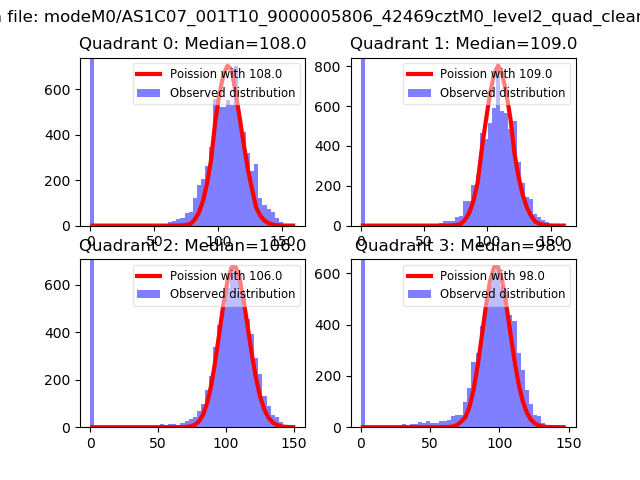 |
 |
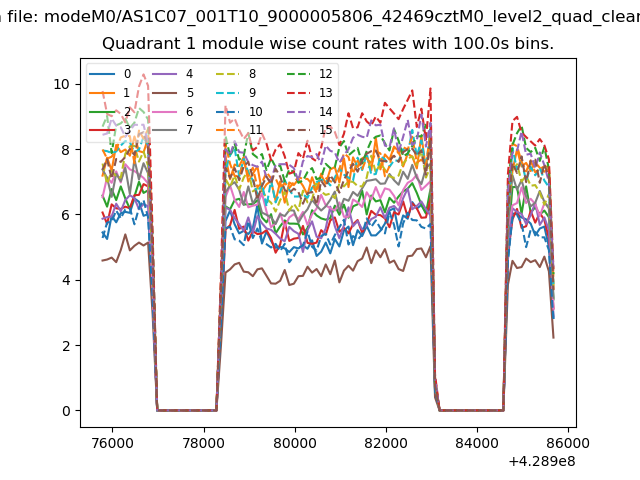
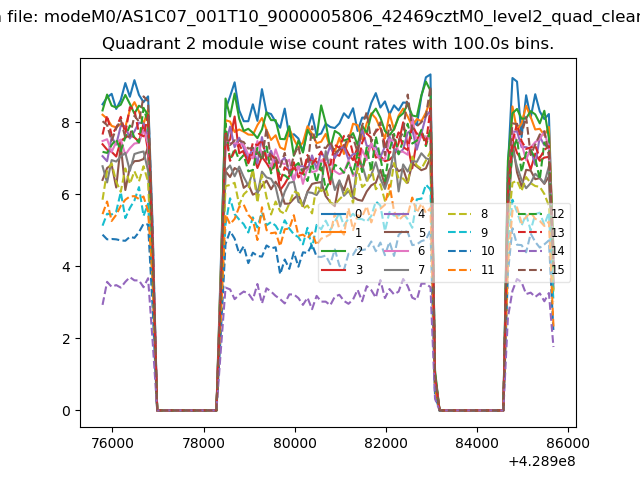
| Quadrant-wise count rates Data is divided into 100 sec bins |
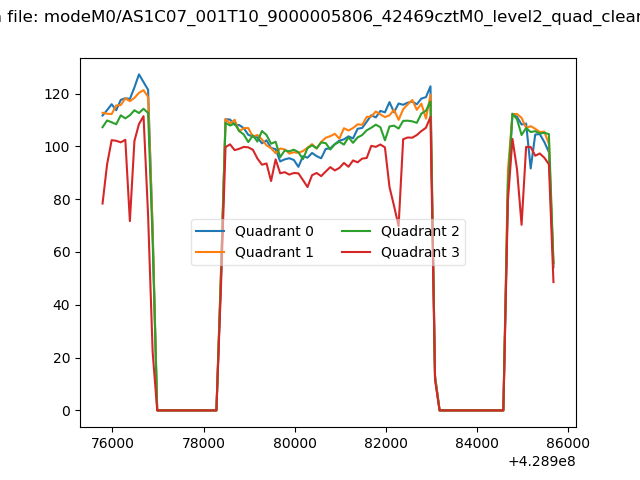 |
|
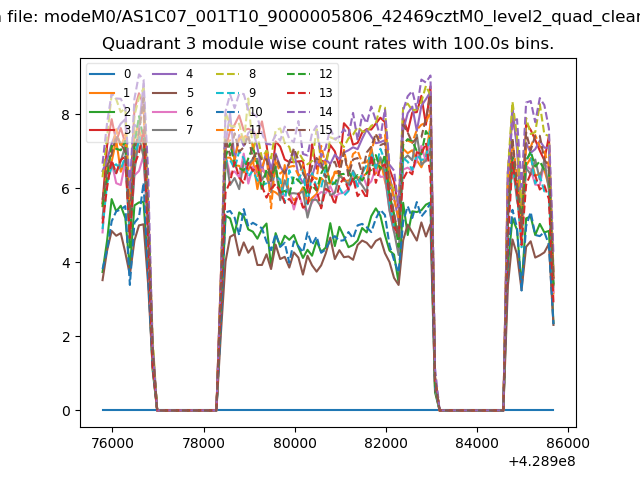
| Module-wise count rates for Quadrant A Data is divided into 100 sec bins |
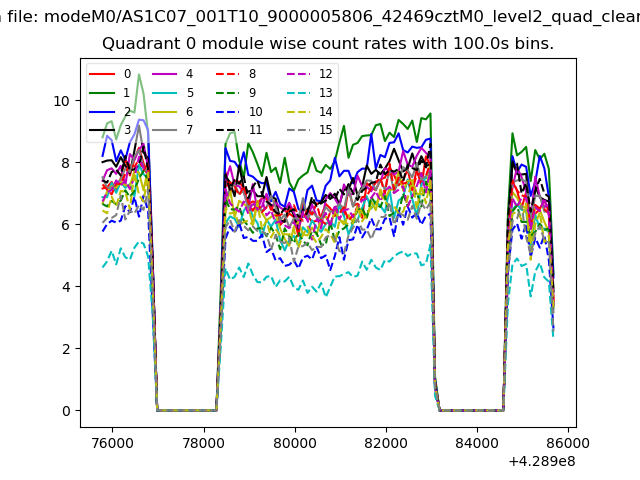 |
 |
| Module-wise count rates for Quadrant B Data is divided into 100 sec bins |
 |
 |
| Module-wise count rates for Quadrant C Data is divided into 100 sec bins |
 |
 |
| Module-wise count rates for Quadrant D Data is divided into 100 sec bins |
 |
 |
| Parameter | Plot |
|---|---|
| CZT HV Monitor | 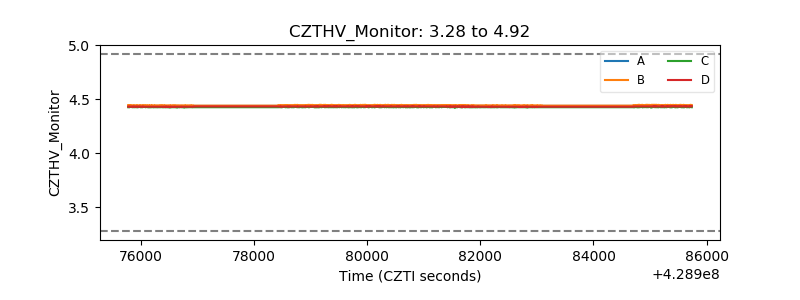 |
| D_VDD | 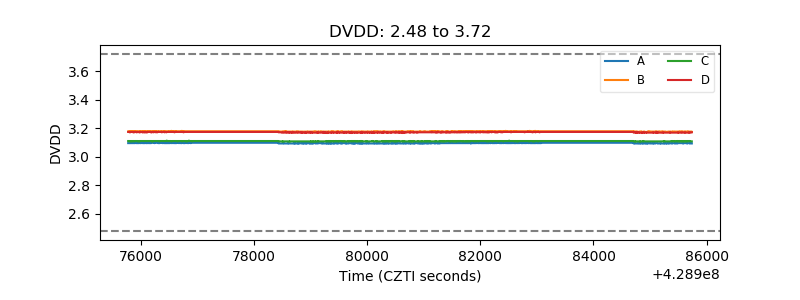 |
| Temperature 1 | 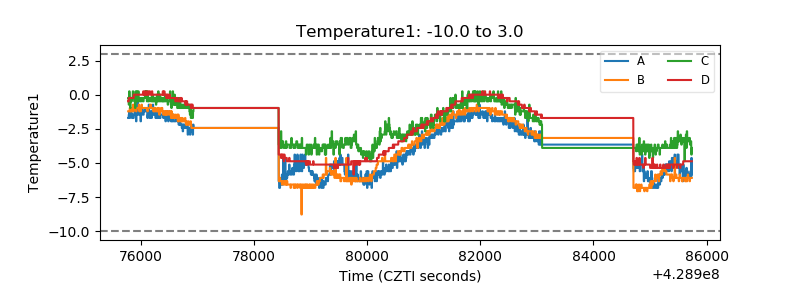 |
| Veto HV Monitor | 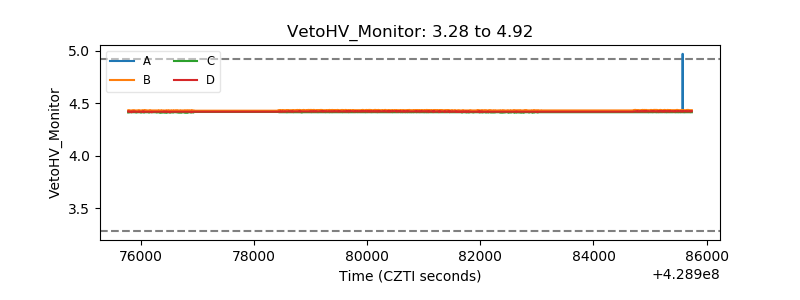 |
| Veto LLD | 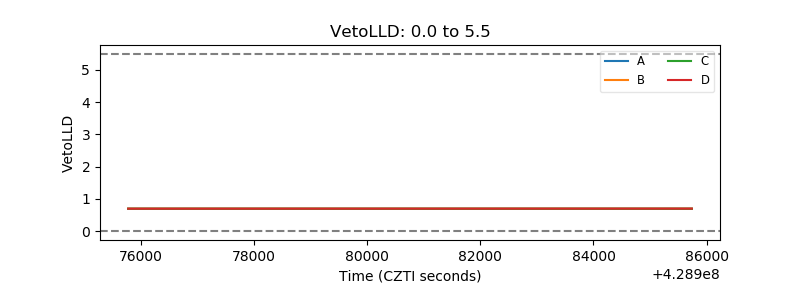 |
| Alpha Counter | 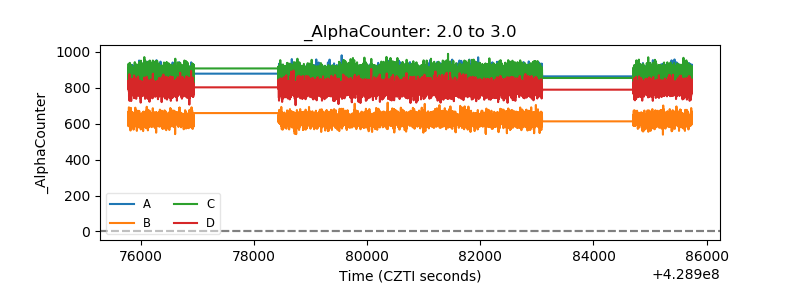 |
| _CPM_Rate | 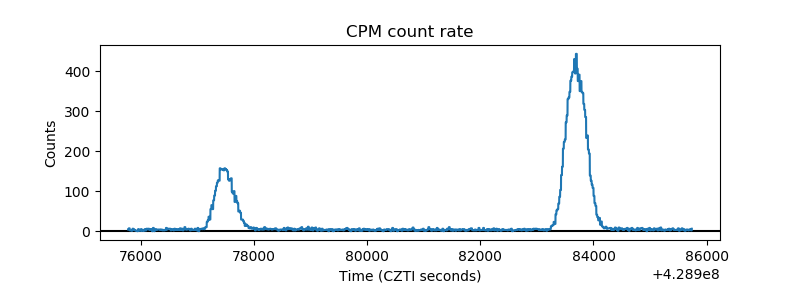 |
| CZT Counter | 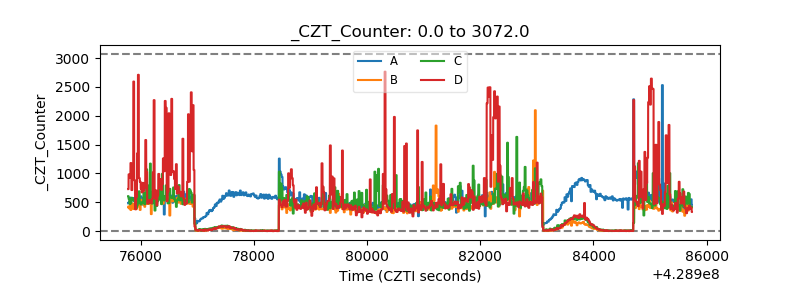 |
| +2.5 Volts monitor | 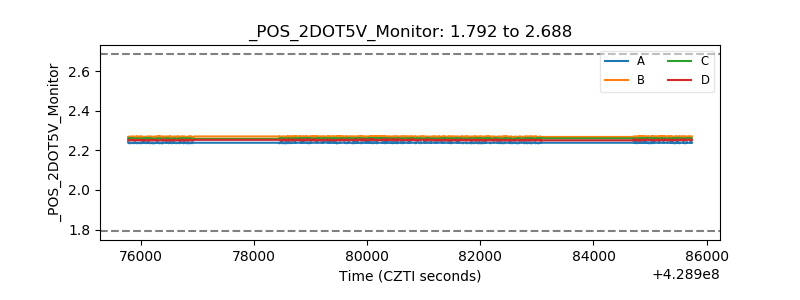 |
| +5 Volts monitor |  |
| _ROLL_ROT | 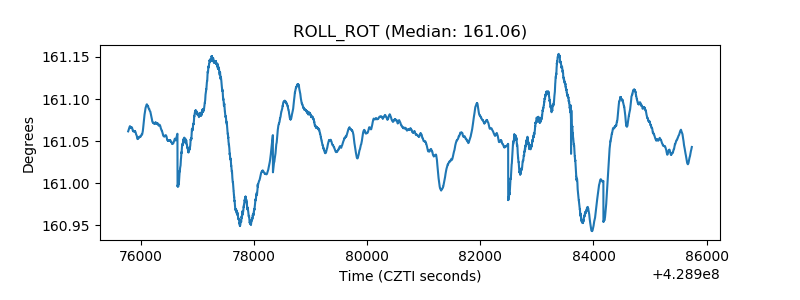 |
| _Roll_DEC | 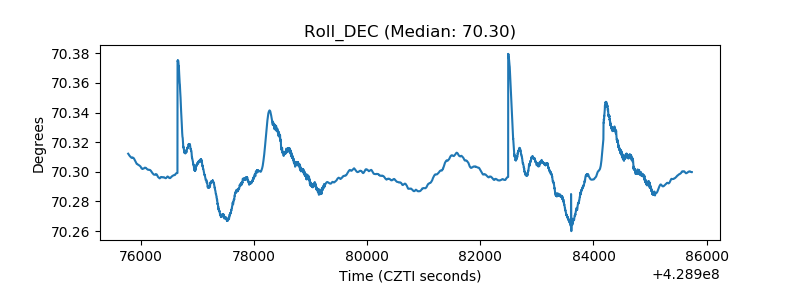 |
| _Roll_RA | 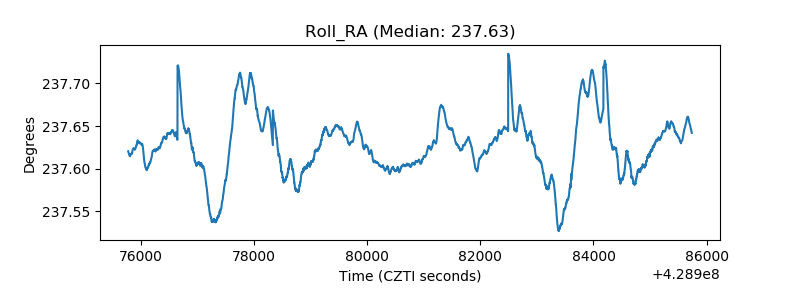 |
| Veto Counter | 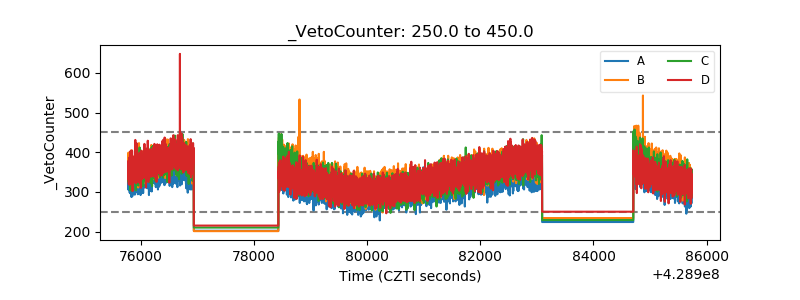 |