| Param | Original file | Final file |
|---|---|---|
| Filename | modeM0/AS1C07_001T10_9000005806_42471cztM0_level2.fits | modeM0/AS1C07_001T10_9000005806_42471cztM0_level2_quad_clean.evt |
| Size (bytes) | 341,222,400 | 94,127,040 |
| Size | 325.4 MB | 89.8 MB |
| Events in quadrant A | 3,170,432 | 626,865 |
| Events in quadrant B | 2,728,215 | 632,114 |
| Events in quadrant C | 3,049,755 | 615,673 |
| Events in quadrant D | 3,230,912 | 570,196 |
| Mode M9 | |||
|---|---|---|---|
| Quadrant | BADHDUFLAG | Total packets | Discarded packets |
| A | 0 | 33 | 0 |
| B | 0 | 33 | 0 |
| C | 0 | 33 | 0 |
| D | 0 | 33 | 0 |
| Mode SS | |||
|---|---|---|---|
| Quadrant | BADHDUFLAG | Total packets | Discarded packets |
| A | 0 | 120 | 0 |
| B | 0 | 120 | 0 |
| C | 0 | 120 | 0 |
| D | 0 | 120 | 0 |
| Mode M0 | |||
|---|---|---|---|
| Quadrant | BADHDUFLAG | Total packets | Discarded packets |
| A | 0 | 12986 | 2 |
| B | 0 | 12314 | 2 |
| C | 0 | 12955 | 2 |
| D | 0 | 13863 | 2 |
| Quadrant | Total seconds | Saturated seconds | Saturation percentage |
|---|---|---|---|
| A | 5798 | 30 | 0.517420% |
| B | 5799 | 59 | 1.017417% |
| C | 5799 | 7 | 0.120710% |
| D | 5799 | 110 | 1.896879% |
Noise dominated data is calculated using 1-second bins in cleaned event files. If a bin has >2000 counts, and if more than 50% of those come from <1% of pixels, then it is considered to be noise-dominated and hence unusable.
| Quadrant | # 1 sec bins | Bins with >0 counts | Bins with >2000 counts | High rate bins dominated by noise | Noise dominated (total time) | Noise dominated (detector-on time) | Marked lightcurve |
|---|---|---|---|---|---|---|---|
| A | 9140 | 5800 | 20 | 20 | 0.22% | 0.34% | 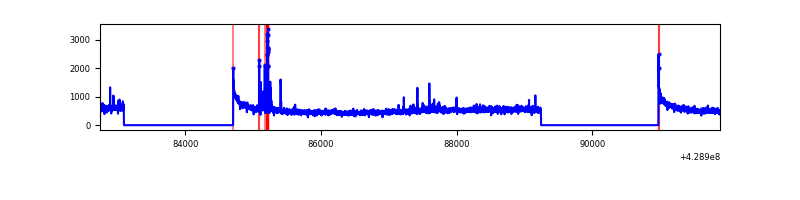 |
| B | 9141 | 5801 | 39 | 39 | 0.43% | 0.67% | 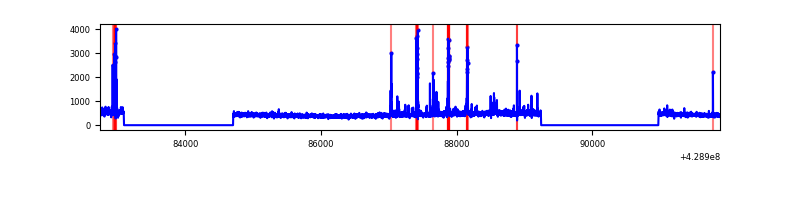 |
| C | 9141 | 5801 | 1 | 1 | 0.01% | 0.02% | 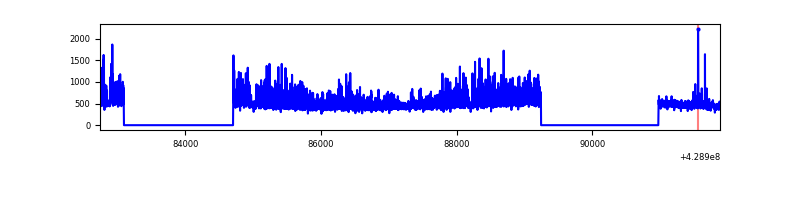 |
| D | 9141 | 5801 | 99 | 99 | 1.08% | 1.71% | 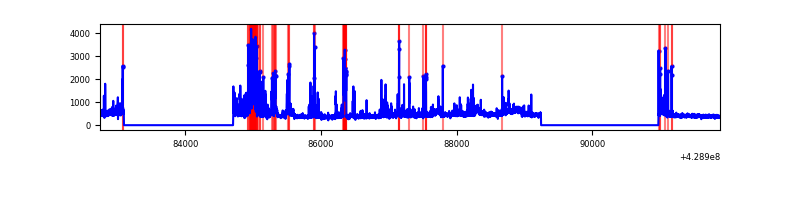 |
Top three noisy pixels from each quadrant. If the there are fewer than three noisy pixels in the level2.evt file, extra rows are filled as -1
| Pixel properties | Quadrant properties | ||||||
|---|---|---|---|---|---|---|---|
| Quadrant | DetID | PixID | Counts | Sigma | Mean | Median | Sigma |
| A | 10 | 83 | 607715 | 4769.9 | 619 | 607 | 127.3 |
| A | 7 | 16 | 79848 | 622.58 | 619 | 607 | 127.3 |
| A | 12 | 189 | 54239 | 421.37 | 619 | 607 | 127.3 |
| B | 5 | 172 | 84702 | 708.99 | 610 | 591 | 118.6 |
| B | 5 | 255 | 71029 | 593.74 | 610 | 591 | 118.6 |
| B | 0 | 186 | 52105 | 434.22 | 610 | 591 | 118.6 |
| C | 10 | 34 | 407460 | 2874.16 | 602 | 606 | 141.6 |
| C | 15 | 214 | 243900 | 1718.72 | 602 | 606 | 141.6 |
| C | 14 | 254 | 20110 | 137.78 | 602 | 606 | 141.6 |
| D | 12 | 6 | 419419 | 2833.96 | 603 | 584 | 147.8 |
| D | 2 | 16 | 195569 | 1319.32 | 603 | 584 | 147.8 |
| D | 1 | 52 | 98651 | 663.55 | 603 | 584 | 147.8 |
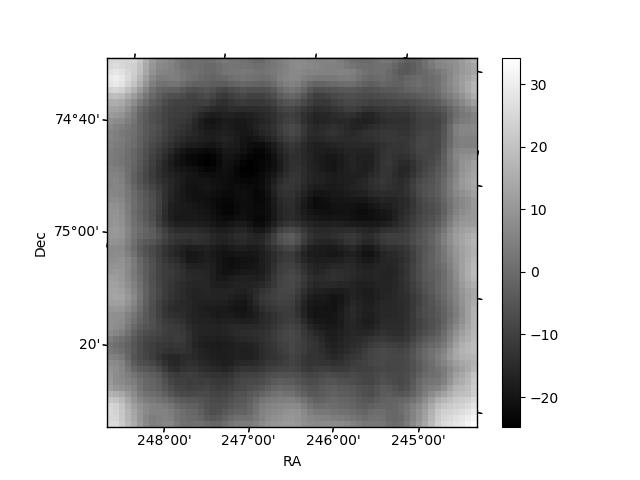
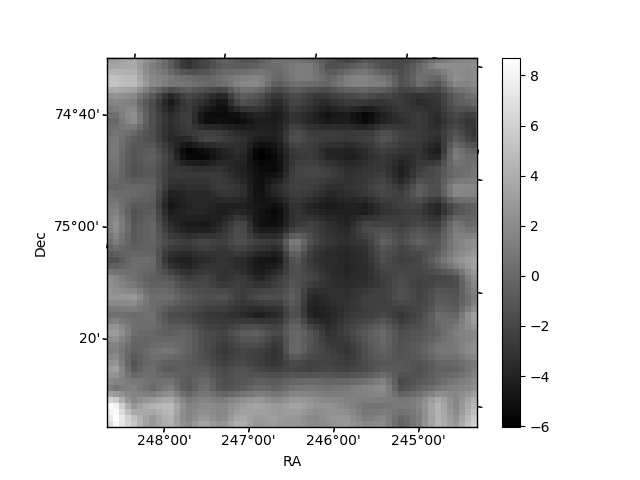
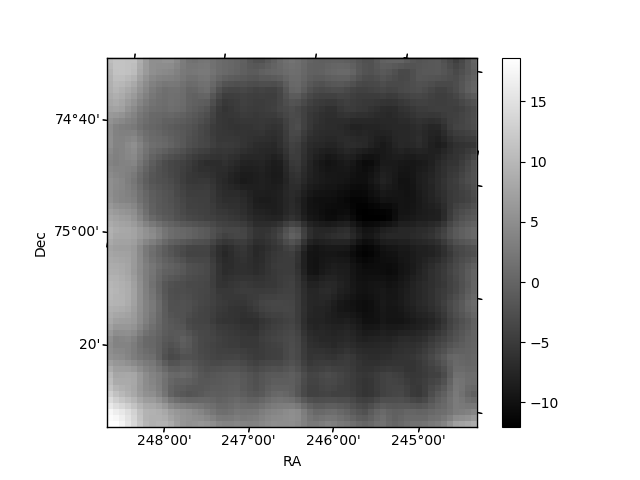
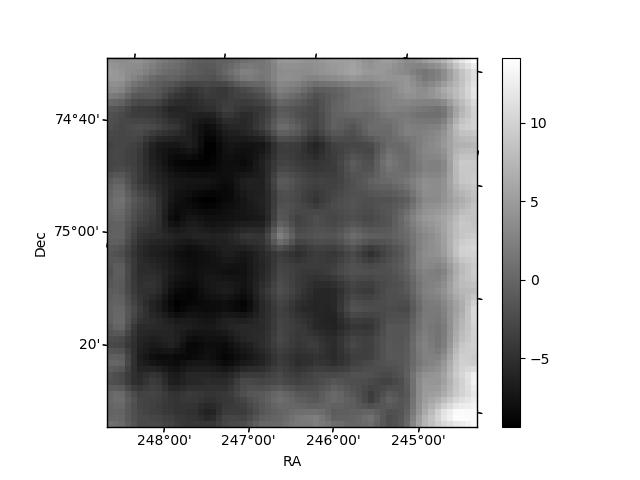
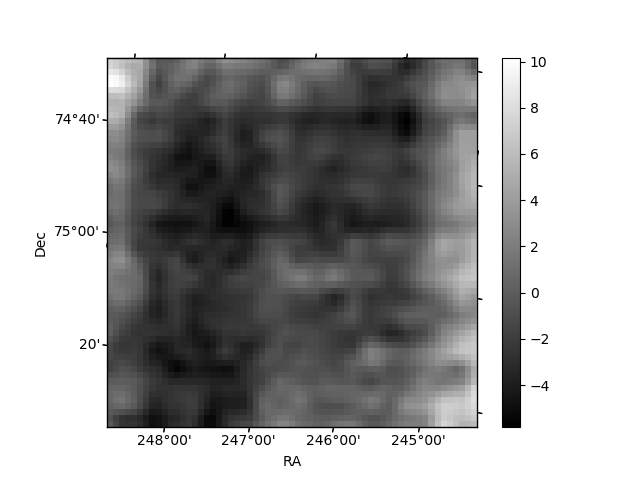
Histogram calculated using DETX and DETY for each event in the final _common_clean file
| Quadrant A | 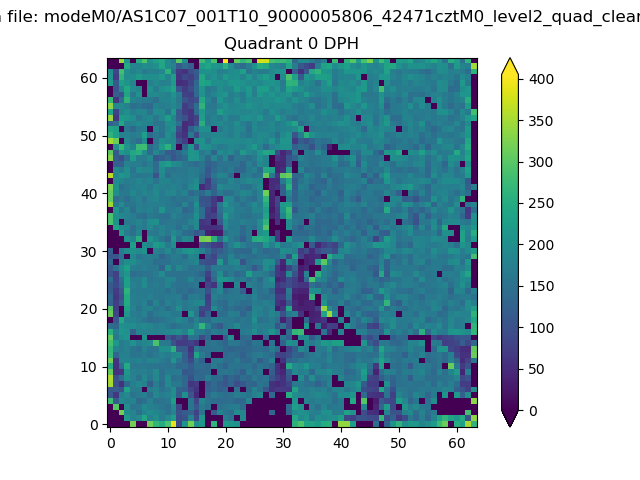 |
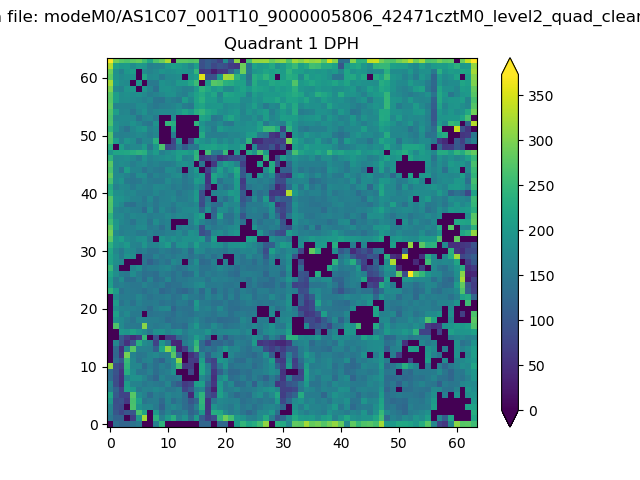 |
Quadrant B |
|---|---|---|---|
| Quadrant D | 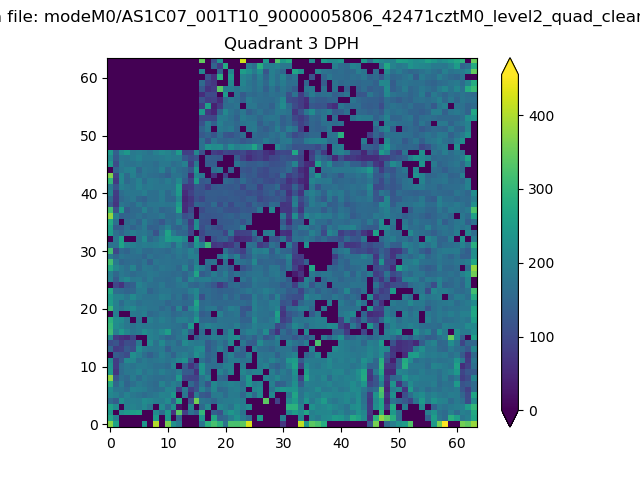 |
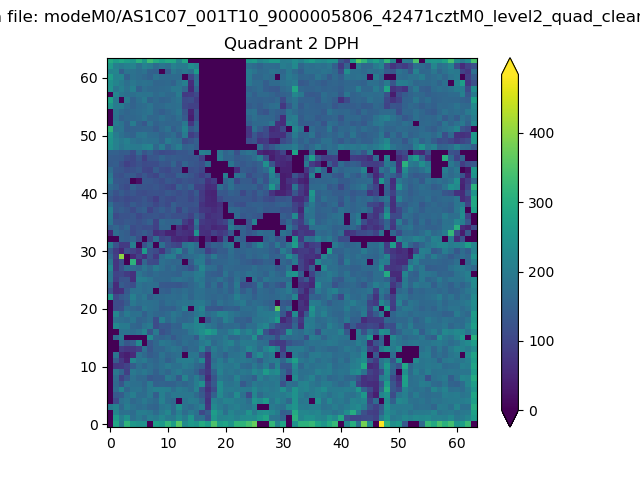 |
Quadrant C |
| Plot type | Count rate plots | Images |
|---|---|---|
| Comparison with Poisson distribution Blue bars denote a histogram of data divided into 1 sec bins. Red curve is a Poisson curve with rate = median count rate of data. |
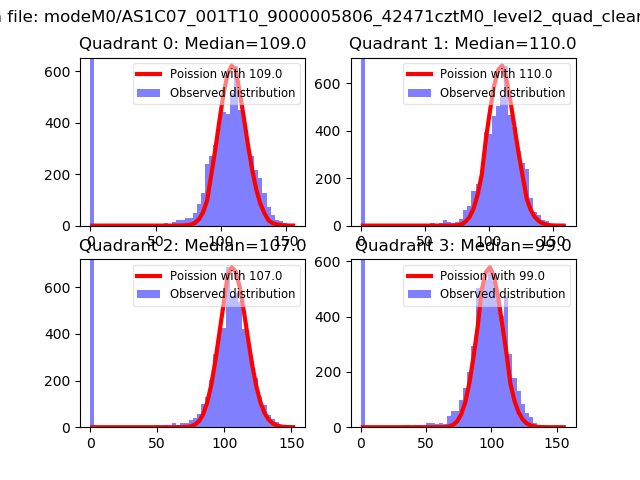 |
 |
| Quadrant-wise count rates Data is divided into 100 sec bins |
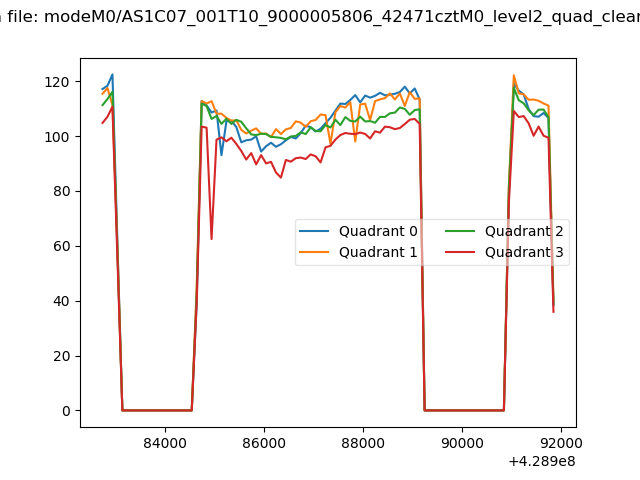 |
|
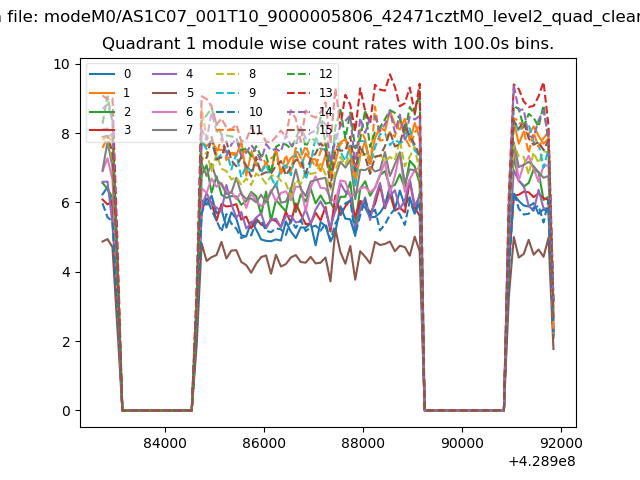
| Module-wise count rates for Quadrant A Data is divided into 100 sec bins |
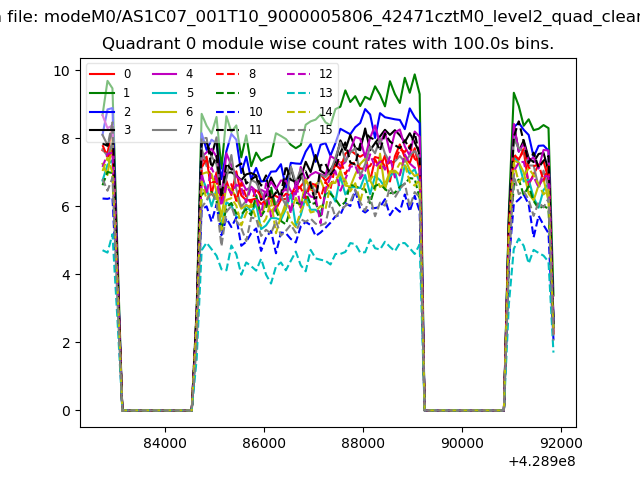 |
 |
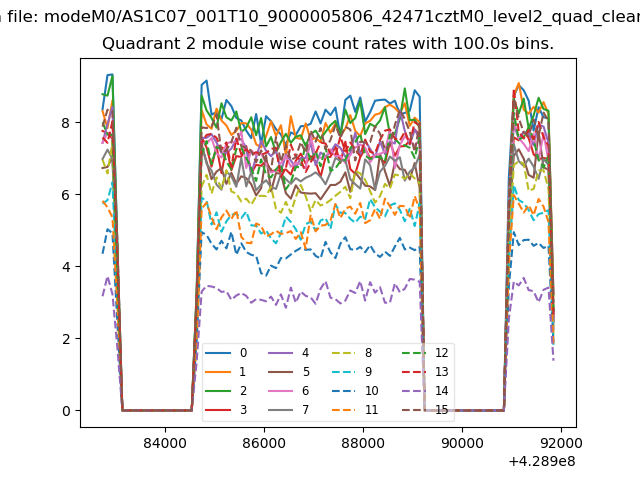
| Module-wise count rates for Quadrant B Data is divided into 100 sec bins |
 |
 |
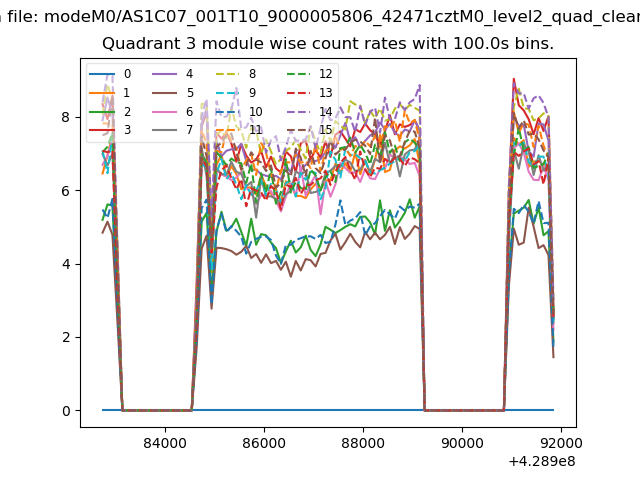
| Module-wise count rates for Quadrant C Data is divided into 100 sec bins |
 |
 |
| Module-wise count rates for Quadrant D Data is divided into 100 sec bins |
 |
 |
| Parameter | Plot |
|---|---|
| CZT HV Monitor | 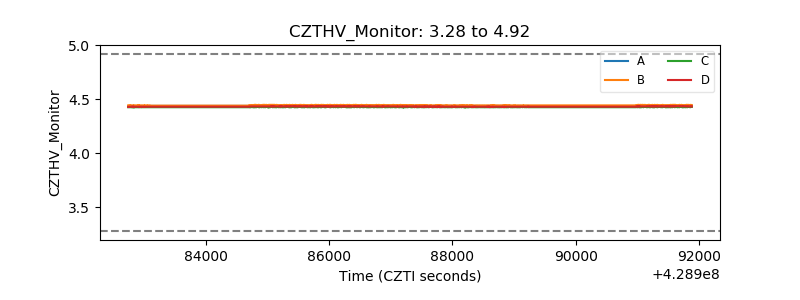 |
| D_VDD | 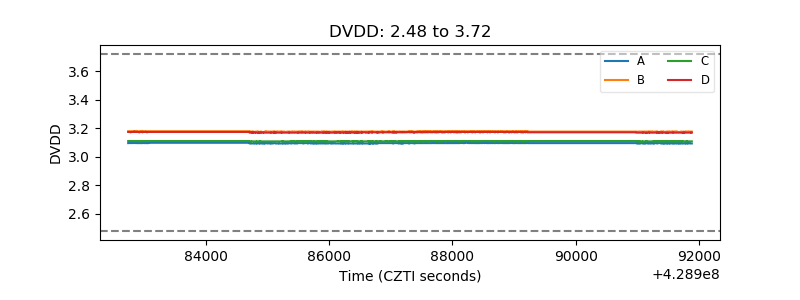 |
| Temperature 1 | 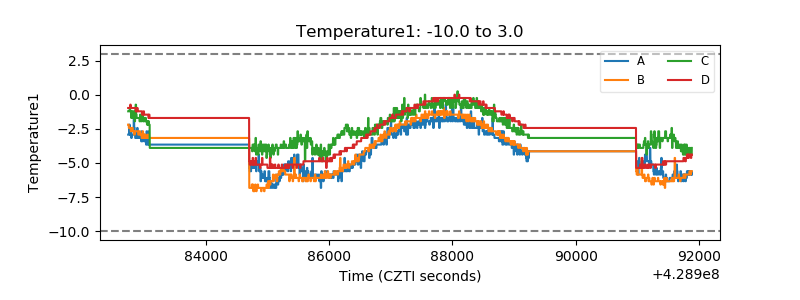 |
| Veto HV Monitor | 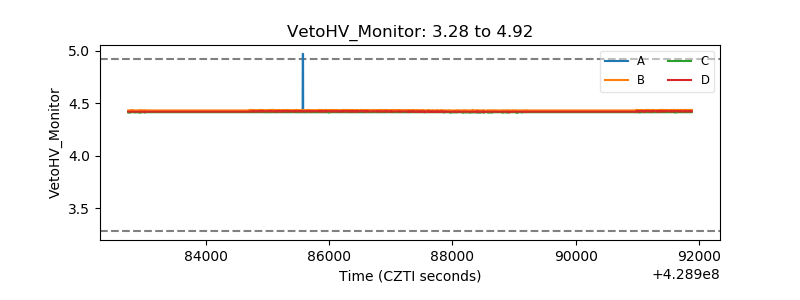 |
| Veto LLD | 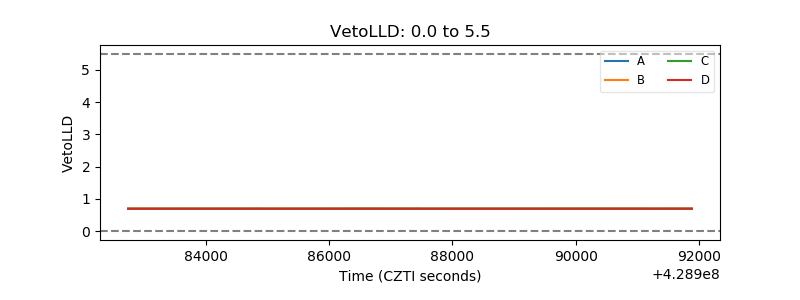 |
| Alpha Counter | 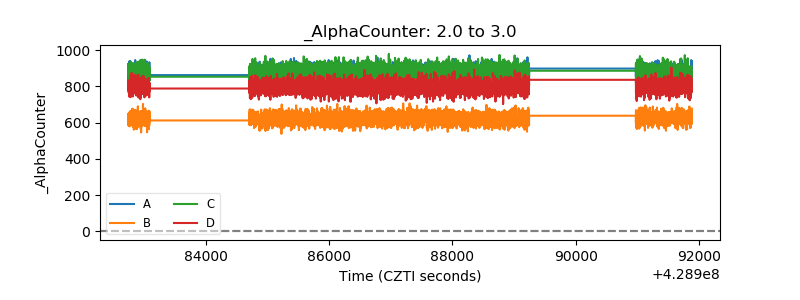 |
| _CPM_Rate | 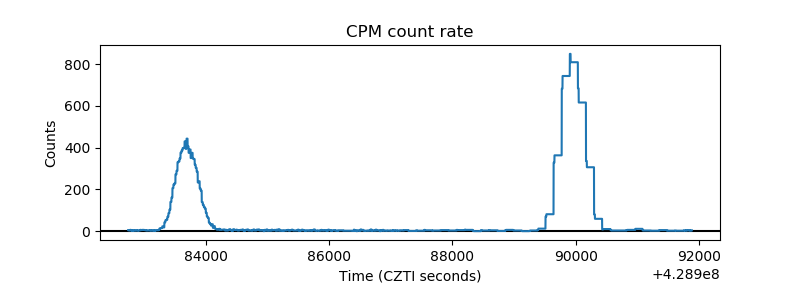 |
| CZT Counter | 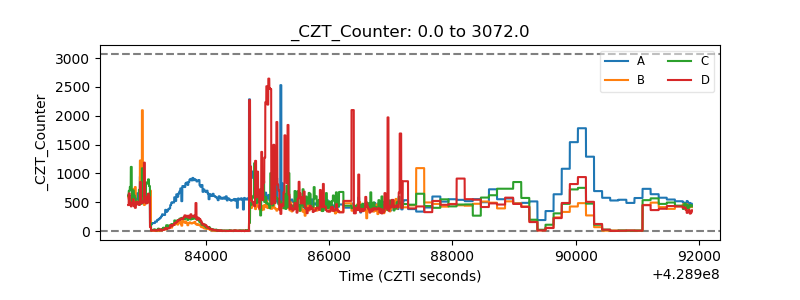 |
| +2.5 Volts monitor | 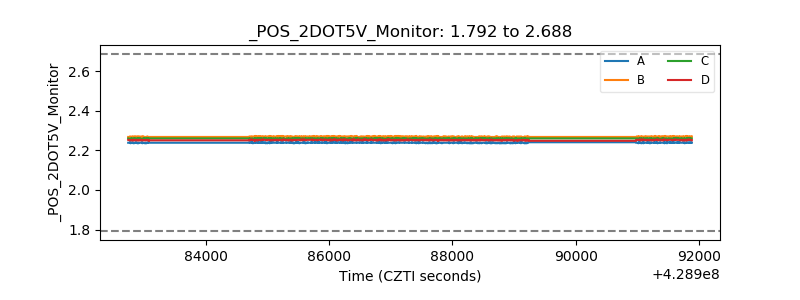 |
| +5 Volts monitor | 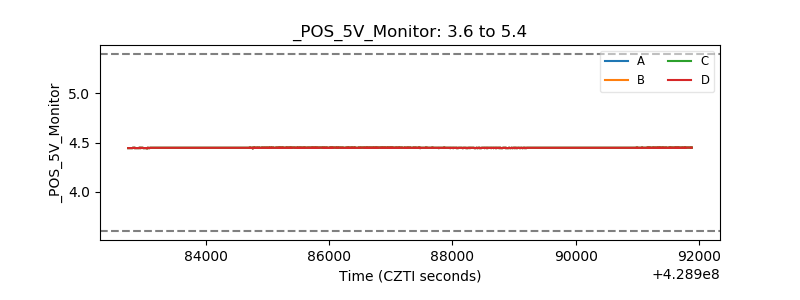 |
| _ROLL_ROT | 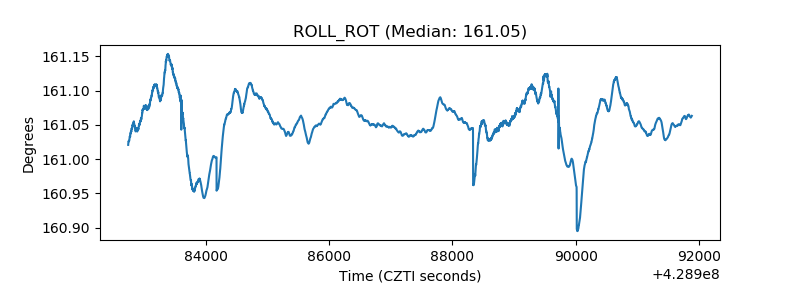 |
| _Roll_DEC | 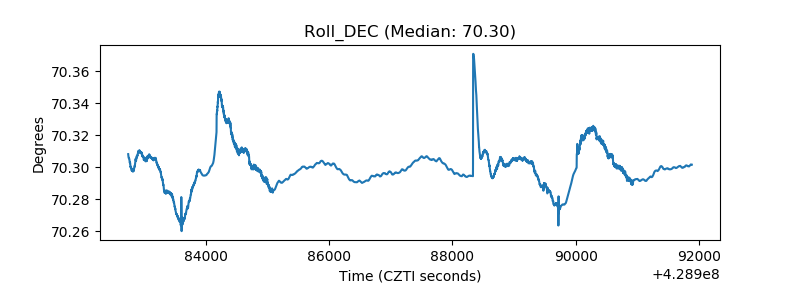 |
| _Roll_RA | 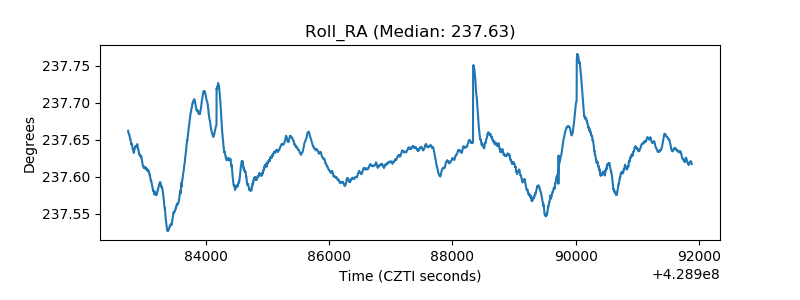 |
| Veto Counter | 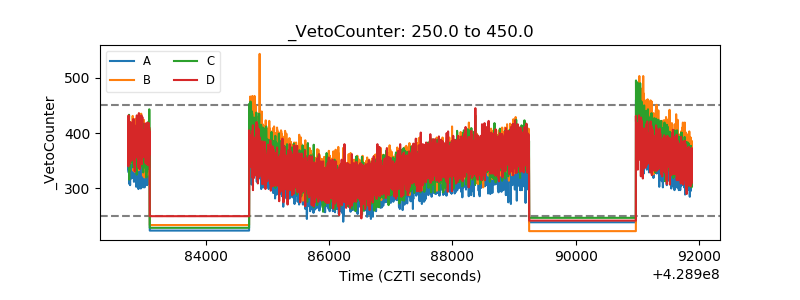 |