| Param | Original file | Final file |
|---|---|---|
| Filename | modeM0/AS1C07_001T10_9000005806_42473cztM0_level2.fits | modeM0/AS1C07_001T10_9000005806_42473cztM0_level2_quad_clean.evt |
| Size (bytes) | 360,892,800 | 87,909,120 |
| Size | 344.2 MB | 83.8 MB |
| Events in quadrant A | 3,025,218 | 598,453 |
| Events in quadrant B | 2,330,689 | 609,670 |
| Events in quadrant C | 2,371,851 | 578,649 |
| Events in quadrant D | 5,234,020 | 517,241 |
| Mode M9 | |||
|---|---|---|---|
| Quadrant | BADHDUFLAG | Total packets | Discarded packets |
| A | 0 | 20 | 0 |
| B | 0 | 21 | 0 |
| C | 0 | 21 | 0 |
| D | 0 | 21 | 0 |
| Mode SS | |||
|---|---|---|---|
| Quadrant | BADHDUFLAG | Total packets | Discarded packets |
| A | 0 | 104 | 0 |
| B | 0 | 104 | 0 |
| C | 0 | 104 | 0 |
| D | 0 | 104 | 0 |
| Mode M0 | |||
|---|---|---|---|
| Quadrant | BADHDUFLAG | Total packets | Discarded packets |
| A | 0 | 11978 | 3 |
| B | 0 | 10447 | 2 |
| C | 0 | 10263 | 2 |
| D | 0 | 19078 | 2 |
| Quadrant | Total seconds | Saturated seconds | Saturation percentage |
|---|---|---|---|
| A | 5106 | 72 | 1.410106% |
| B | 5106 | 11 | 0.215433% |
| C | 5106 | 4 | 0.078339% |
| D | 5106 | 347 | 6.795926% |
Noise dominated data is calculated using 1-second bins in cleaned event files. If a bin has >2000 counts, and if more than 50% of those come from <1% of pixels, then it is considered to be noise-dominated and hence unusable.
| Quadrant | # 1 sec bins | Bins with >0 counts | Bins with >2000 counts | High rate bins dominated by noise | Noise dominated (total time) | Noise dominated (detector-on time) | Marked lightcurve |
|---|---|---|---|---|---|---|---|
| A | 7079 | 5107 | 63 | 63 | 0.89% | 1.23% | 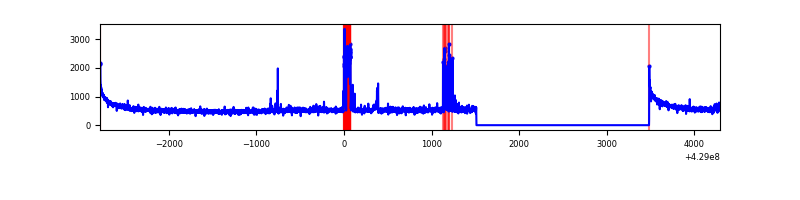 |
| B | 7079 | 5107 | 3 | 3 | 0.04% | 0.06% | 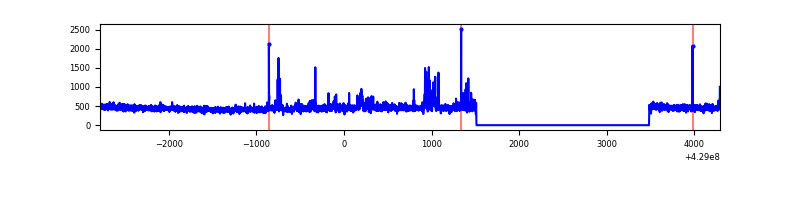 |
| C | 7079 | 5107 | 0 | 0 | 0.00% | 0.00% | 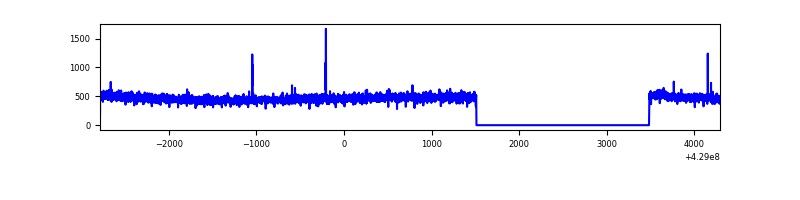 |
| D | 7079 | 5107 | 345 | 345 | 4.87% | 6.76% | 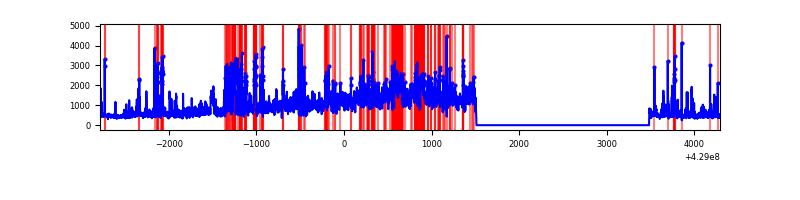 |
Top three noisy pixels from each quadrant. If the there are fewer than three noisy pixels in the level2.evt file, extra rows are filled as -1
| Pixel properties | Quadrant properties | ||||||
|---|---|---|---|---|---|---|---|
| Quadrant | DetID | PixID | Counts | Sigma | Mean | Median | Sigma |
| A | 10 | 83 | 558685 | 4814.03 | 569 | 559 | 115.9 |
| A | 13 | 248 | 206717 | 1778.18 | 569 | 559 | 115.9 |
| A | 12 | 189 | 46778 | 398.65 | 569 | 559 | 115.9 |
| B | 5 | 255 | 55917 | 524.24 | 560 | 547 | 105.6 |
| B | 0 | 186 | 20717 | 190.97 | 560 | 547 | 105.6 |
| B | 15 | 35 | 17820 | 163.54 | 560 | 547 | 105.6 |
| C | 15 | 214 | 216610 | 1712.67 | 546 | 550 | 126.2 |
| C | 12 | 249 | 7621 | 56.05 | 546 | 550 | 126.2 |
| C | 9 | 54 | 6362 | 46.07 | 546 | 550 | 126.2 |
| D | 2 | 16 | 2017358 | 15376.57 | 541 | 527 | 131.2 |
| D | 1 | 52 | 587916 | 4478.33 | 541 | 527 | 131.2 |
| D | 12 | 6 | 133418 | 1013.18 | 541 | 527 | 131.2 |
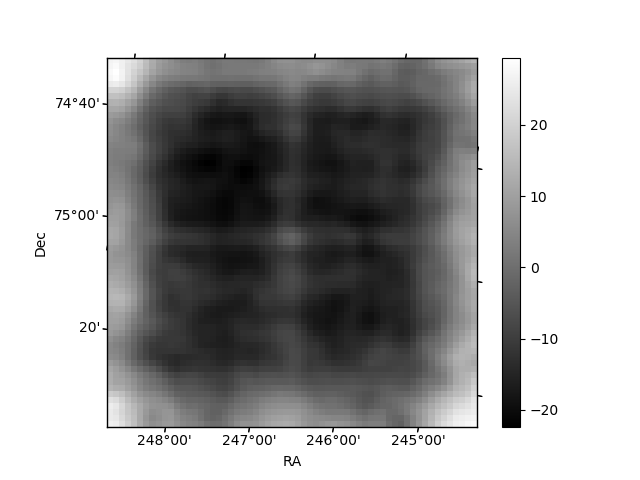
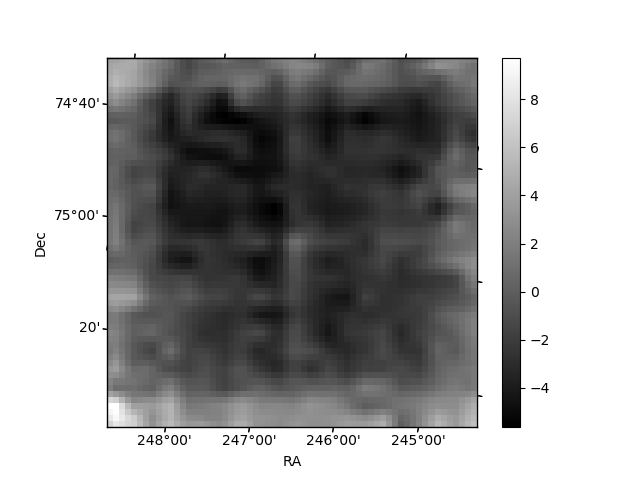
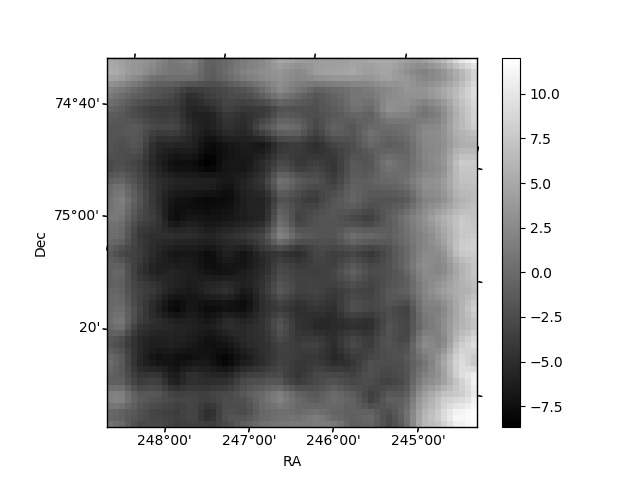
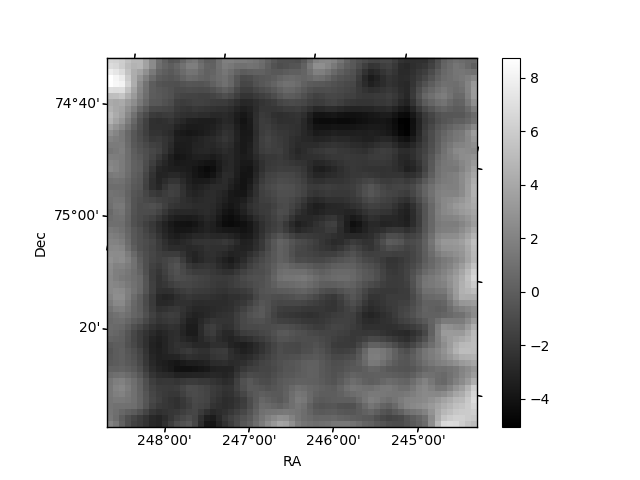
Histogram calculated using DETX and DETY for each event in the final _common_clean file
| Quadrant A | 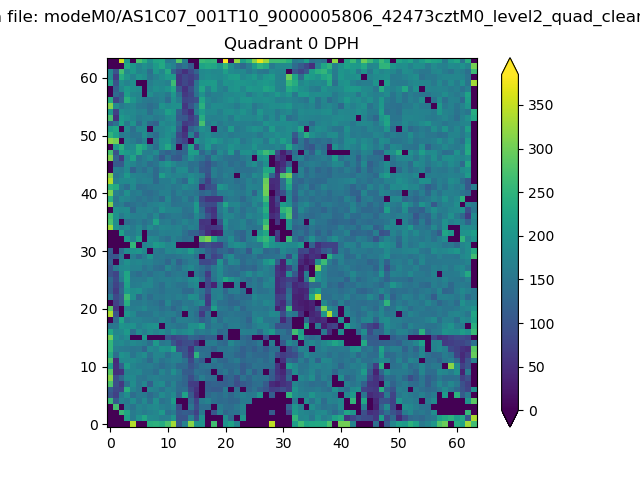 |
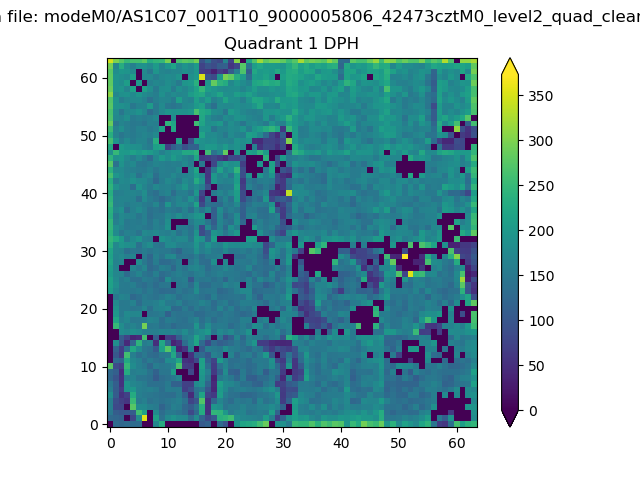 |
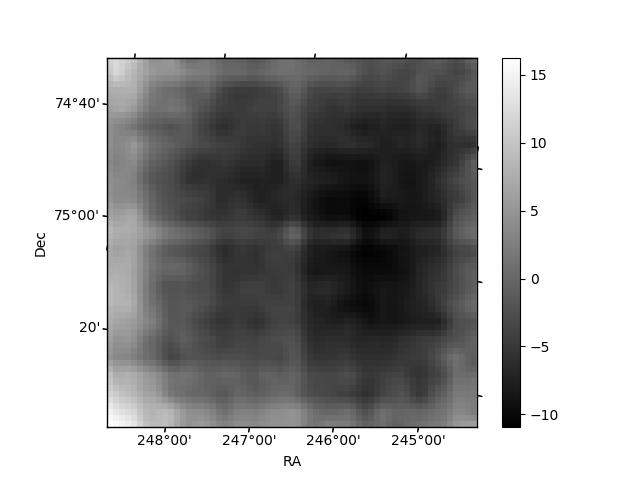
Quadrant B |
|---|---|---|---|
| Quadrant D | 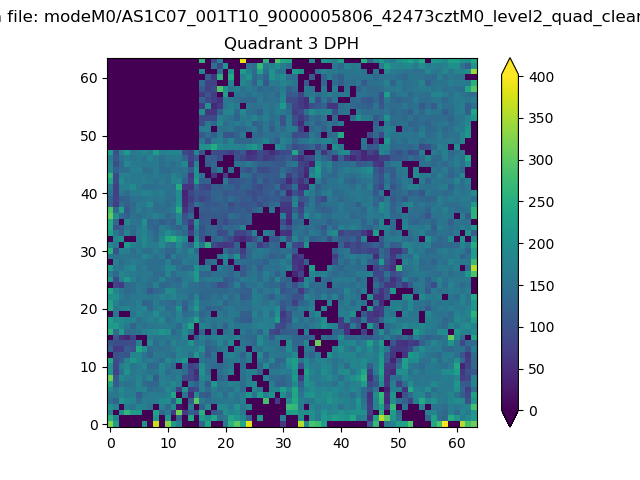 |
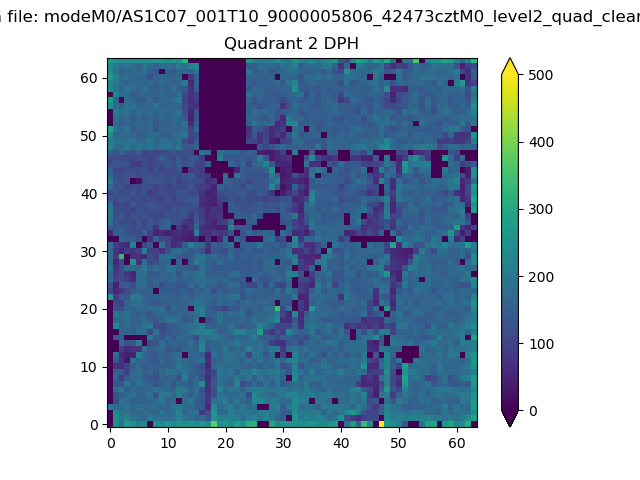 |
Quadrant C |
| Plot type | Count rate plots | Images |
|---|---|---|
| Comparison with Poisson distribution Blue bars denote a histogram of data divided into 1 sec bins. Red curve is a Poisson curve with rate = median count rate of data. |
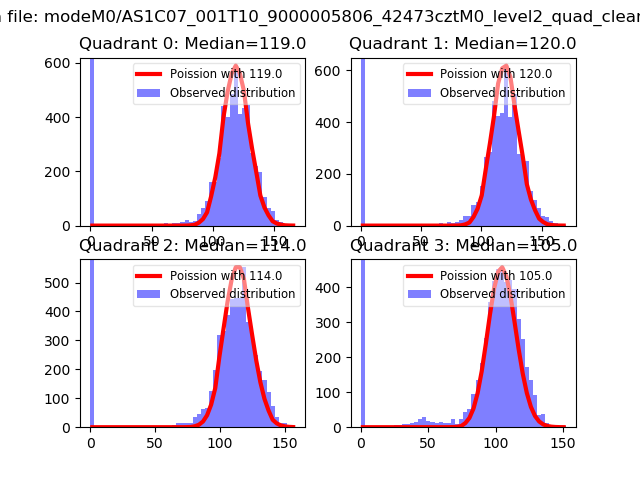 |
 |
| Quadrant-wise count rates Data is divided into 100 sec bins |
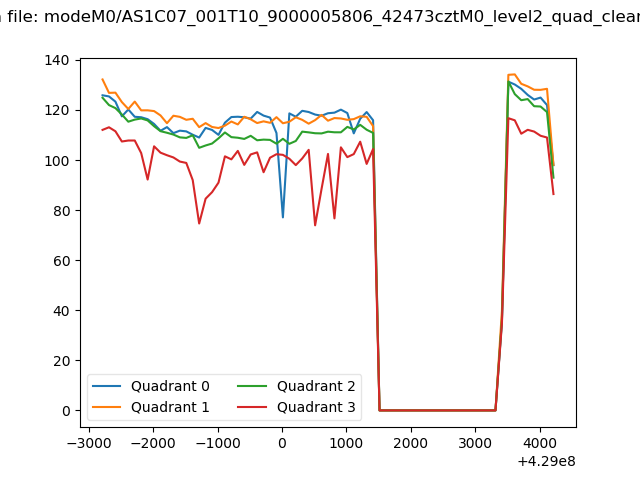 |
|
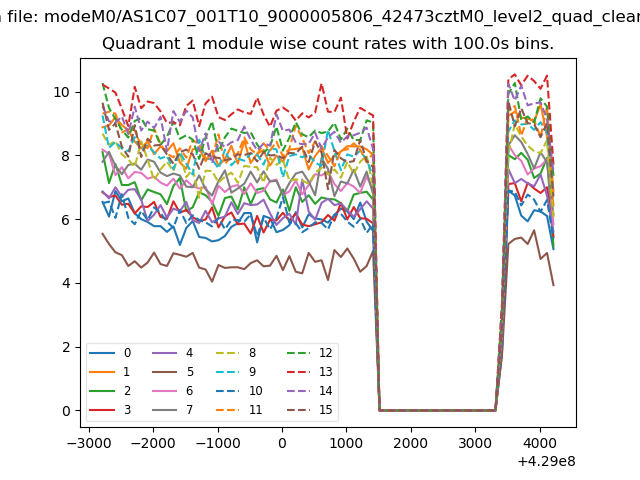
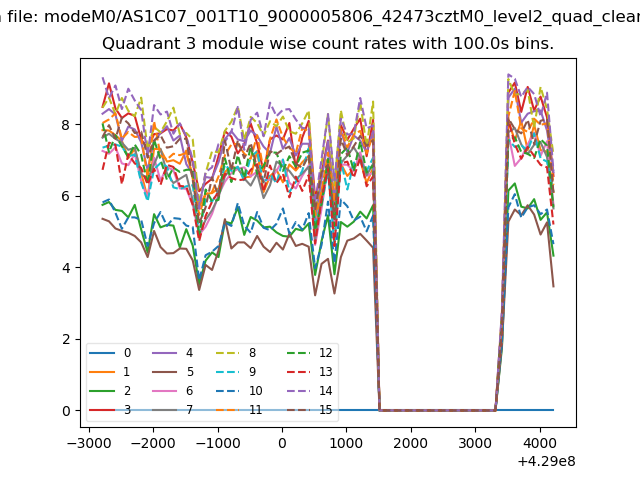
| Module-wise count rates for Quadrant A Data is divided into 100 sec bins |
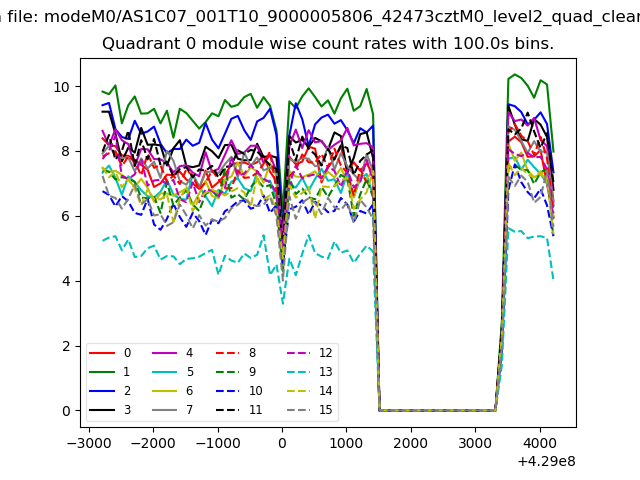 |
 |
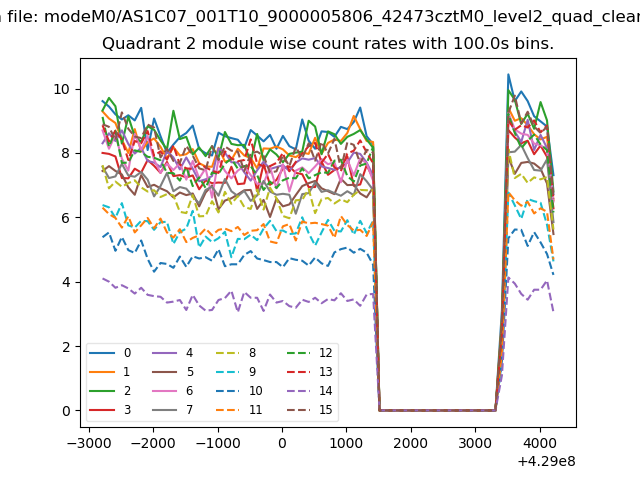
| Module-wise count rates for Quadrant B Data is divided into 100 sec bins |
 |
 |
| Module-wise count rates for Quadrant C Data is divided into 100 sec bins |
 |
 |
| Module-wise count rates for Quadrant D Data is divided into 100 sec bins |
 |
 |
| Parameter | Plot |
|---|---|
| CZT HV Monitor | 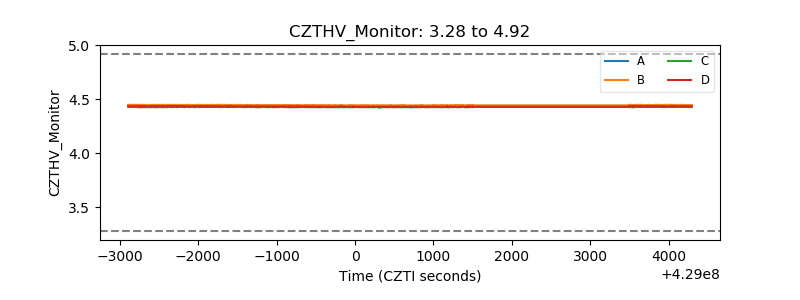 |
| D_VDD | 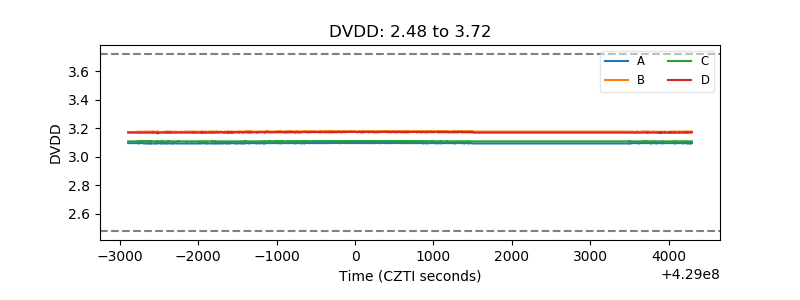 |
| Temperature 1 | 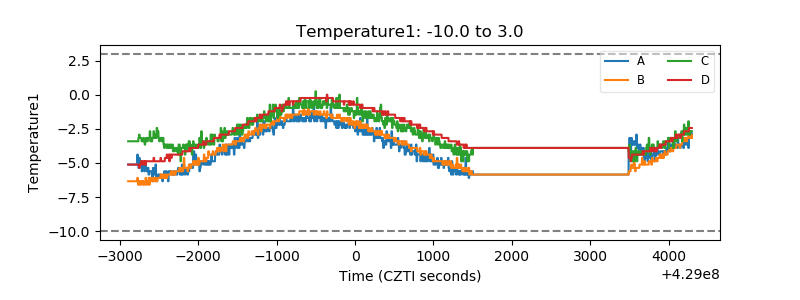 |
| Veto HV Monitor | 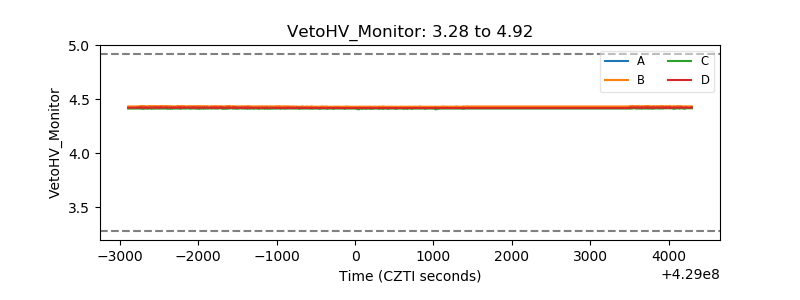 |
| Veto LLD | 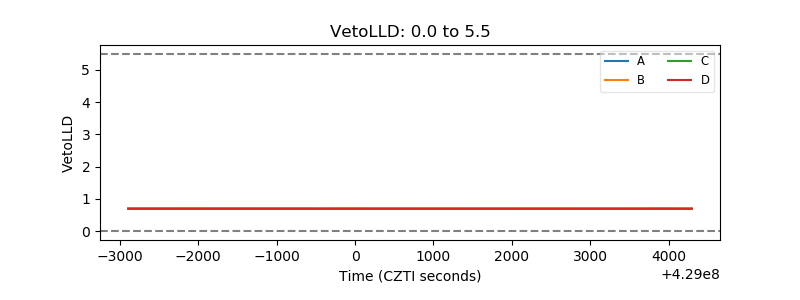 |
| Alpha Counter | 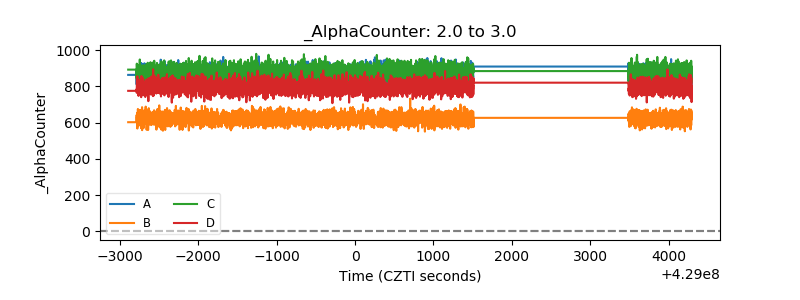 |
| _CPM_Rate | 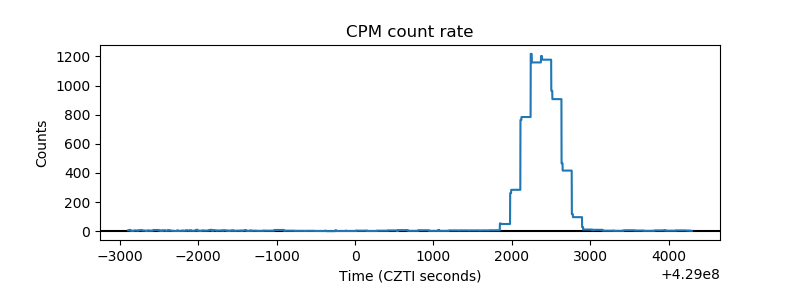 |
| CZT Counter | 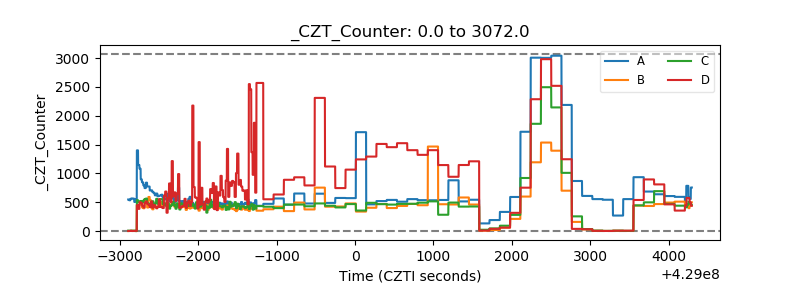 |
| +2.5 Volts monitor | 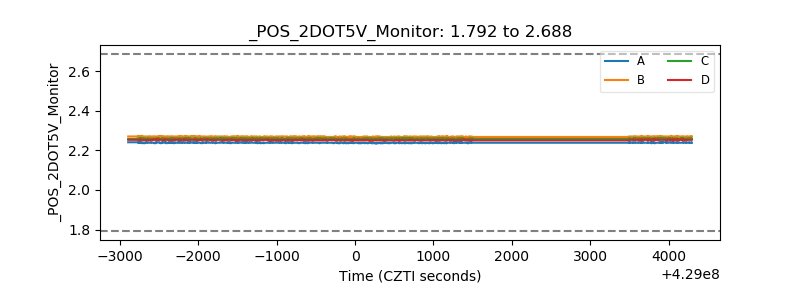 |
| +5 Volts monitor | 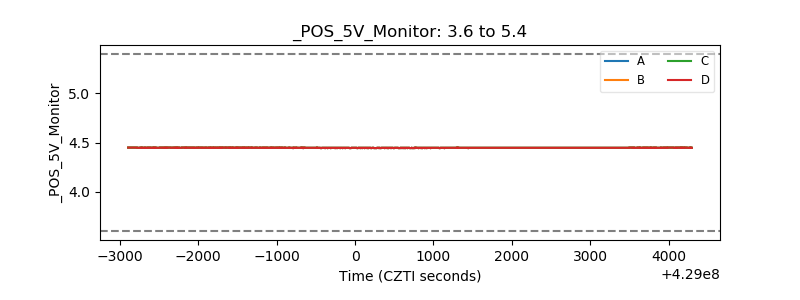 |
| _ROLL_ROT | 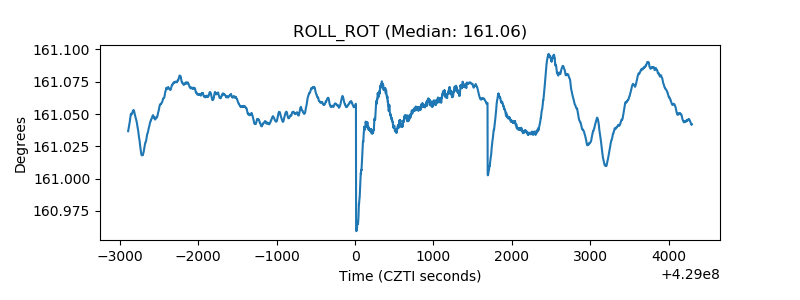 |
| _Roll_DEC | 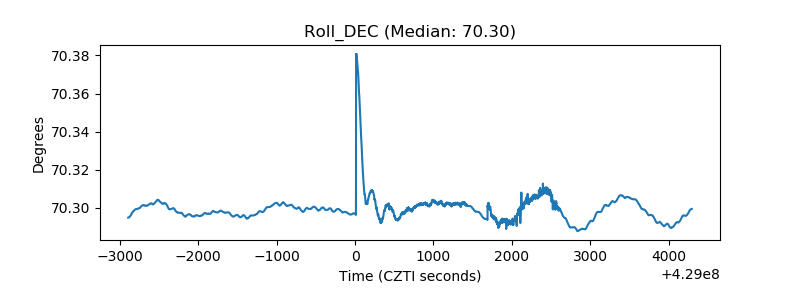 |
| _Roll_RA | 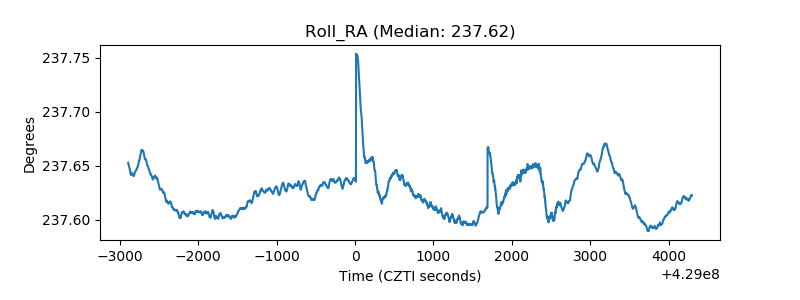 |
| Veto Counter | 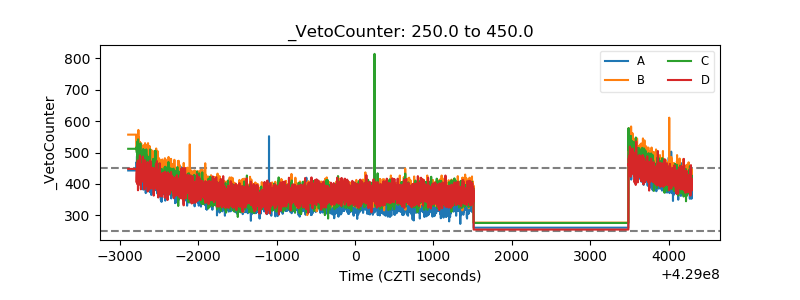 |