| Param | Original file | Final file |
|---|---|---|
| Filename | modeM0/AS1C07_001T10_9000005806_42474cztM0_level2.fits | modeM0/AS1C07_001T10_9000005806_42474cztM0_level2_quad_clean.evt |
| Size (bytes) | 306,624,960 | 86,837,760 |
| Size | 292.4 MB | 82.8 MB |
| Events in quadrant A | 2,834,004 | 599,473 |
| Events in quadrant B | 2,307,223 | 600,471 |
| Events in quadrant C | 2,387,076 | 567,727 |
| Events in quadrant D | 3,438,375 | 516,757 |
| Mode M9 | |||
|---|---|---|---|
| Quadrant | BADHDUFLAG | Total packets | Discarded packets |
| A | 0 | 25 | 0 |
| B | 0 | 26 | 0 |
| C | 0 | 26 | 0 |
| D | 0 | 26 | 0 |
| Mode SS | |||
|---|---|---|---|
| Quadrant | BADHDUFLAG | Total packets | Discarded packets |
| A | 0 | 100 | 0 |
| B | 0 | 100 | 0 |
| C | 0 | 100 | 0 |
| D | 0 | 100 | 0 |
| Mode M0 | |||
|---|---|---|---|
| Quadrant | BADHDUFLAG | Total packets | Discarded packets |
| A | 0 | 11241 | 3 |
| B | 0 | 10133 | 2 |
| C | 0 | 10093 | 2 |
| D | 0 | 13475 | 2 |
| Quadrant | Total seconds | Saturated seconds | Saturation percentage |
|---|---|---|---|
| A | 4921 | 13 | 0.264174% |
| B | 4921 | 13 | 0.264174% |
| C | 4921 | 6 | 0.121926% |
| D | 4921 | 199 | 4.043894% |
Noise dominated data is calculated using 1-second bins in cleaned event files. If a bin has >2000 counts, and if more than 50% of those come from <1% of pixels, then it is considered to be noise-dominated and hence unusable.
| Quadrant | # 1 sec bins | Bins with >0 counts | Bins with >2000 counts | High rate bins dominated by noise | Noise dominated (total time) | Noise dominated (detector-on time) | Marked lightcurve |
|---|---|---|---|---|---|---|---|
| A | 7014 | 4922 | 3 | 3 | 0.04% | 0.06% | 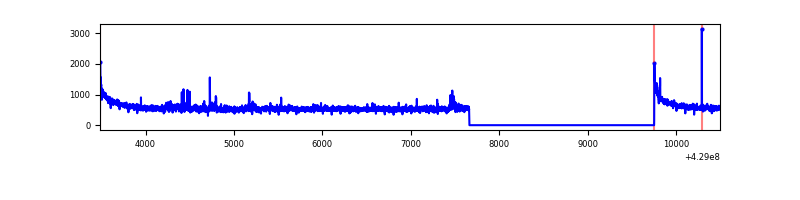 |
| B | 7014 | 4922 | 6 | 6 | 0.09% | 0.12% | 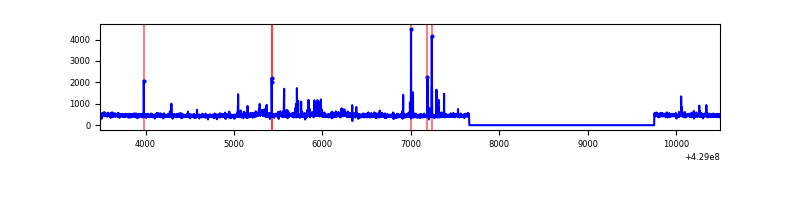 |
| C | 7014 | 4922 | 1 | 1 | 0.01% | 0.02% | 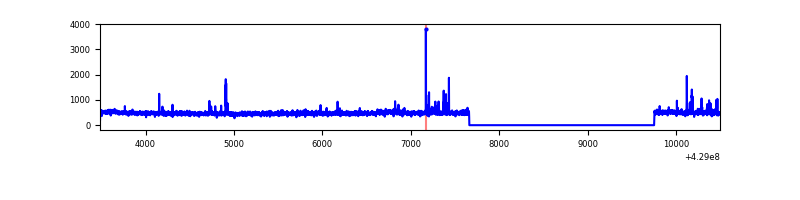 |
| D | 7014 | 4922 | 155 | 155 | 2.21% | 3.15% | 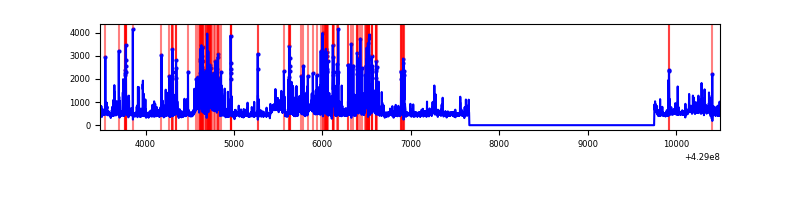 |
Top three noisy pixels from each quadrant. If the there are fewer than three noisy pixels in the level2.evt file, extra rows are filled as -1
| Pixel properties | Quadrant properties | ||||||
|---|---|---|---|---|---|---|---|
| Quadrant | DetID | PixID | Counts | Sigma | Mean | Median | Sigma |
| A | 10 | 83 | 574024 | 5088.76 | 556 | 547 | 112.7 |
| A | 12 | 189 | 65459 | 576.0 | 556 | 547 | 112.7 |
| A | 13 | 6 | 15373 | 131.56 | 556 | 547 | 112.7 |
| B | 0 | 186 | 61839 | 592.18 | 544 | 531 | 103.5 |
| B | 5 | 172 | 31173 | 295.97 | 544 | 531 | 103.5 |
| B | 0 | 229 | 22000 | 207.37 | 544 | 531 | 103.5 |
| C | 15 | 214 | 209086 | 1691.44 | 531 | 533 | 123.3 |
| C | 15 | 111 | 59333 | 476.89 | 531 | 533 | 123.3 |
| C | 0 | 239 | 27024 | 214.85 | 531 | 533 | 123.3 |
| D | 1 | 52 | 531007 | 4119.89 | 530 | 514 | 128.8 |
| D | 12 | 233 | 234528 | 1817.39 | 530 | 514 | 128.8 |
| D | 10 | 118 | 151383 | 1171.67 | 530 | 514 | 128.8 |
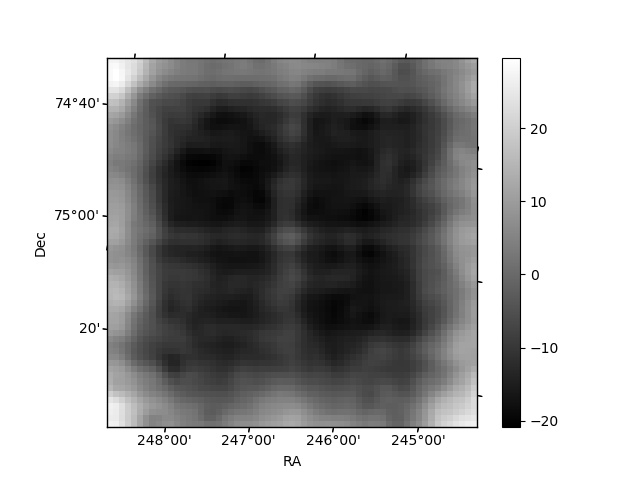
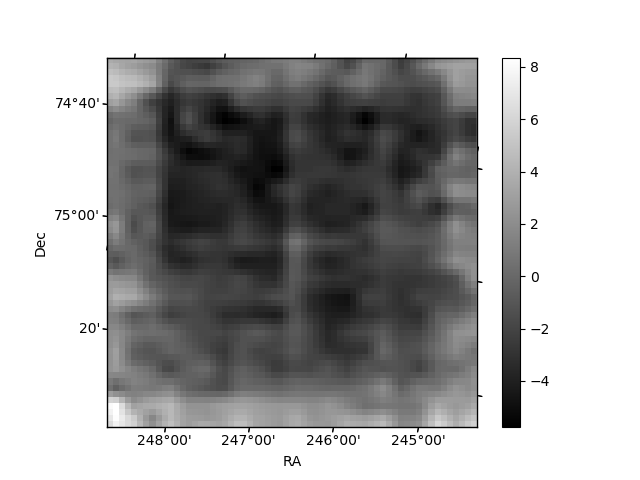
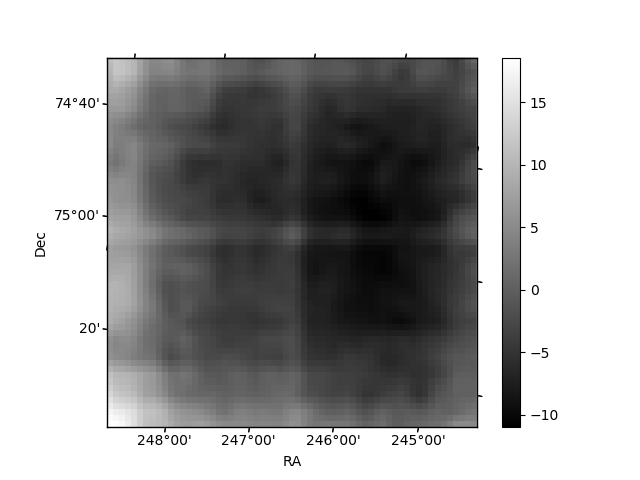
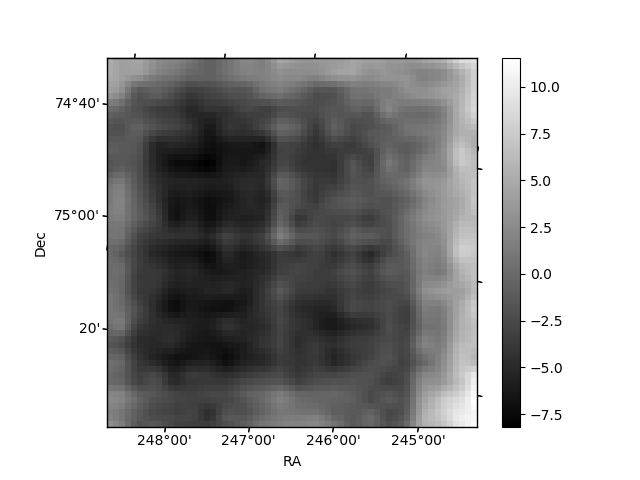
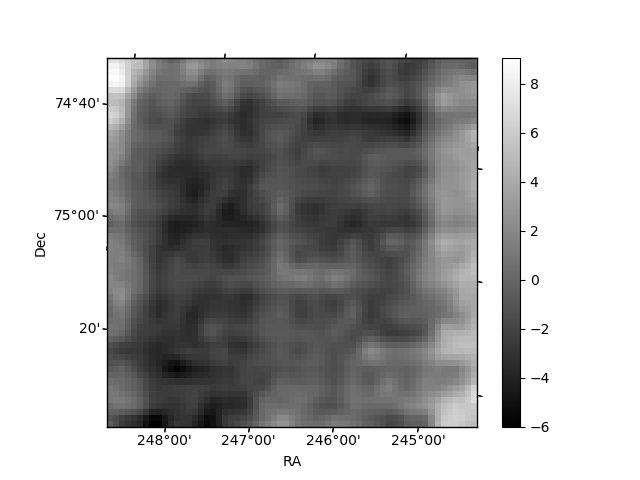
Histogram calculated using DETX and DETY for each event in the final _common_clean file
| Quadrant A | 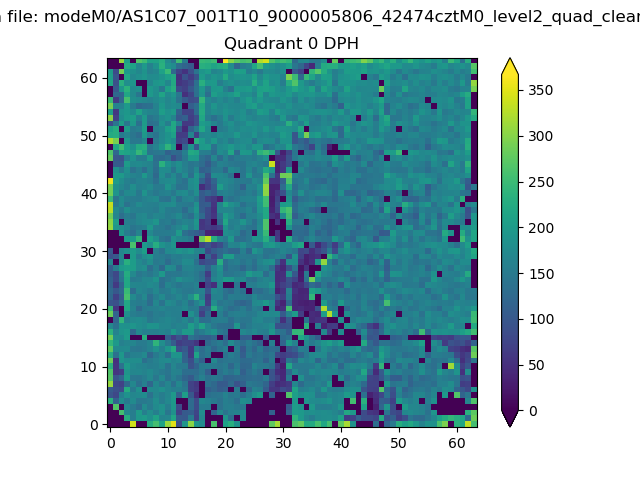 |
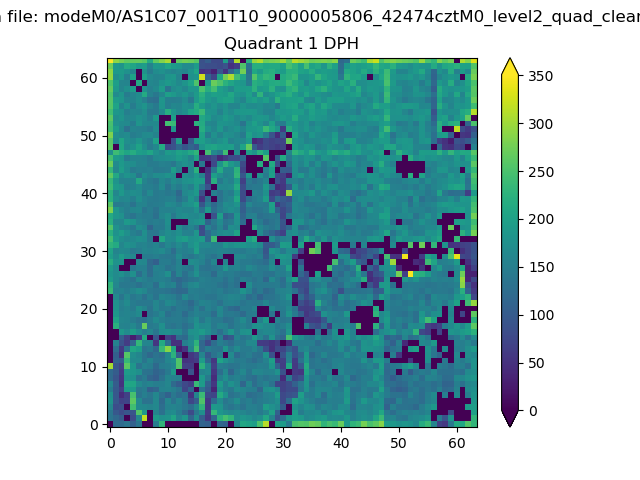 |
Quadrant B |
|---|---|---|---|
| Quadrant D | 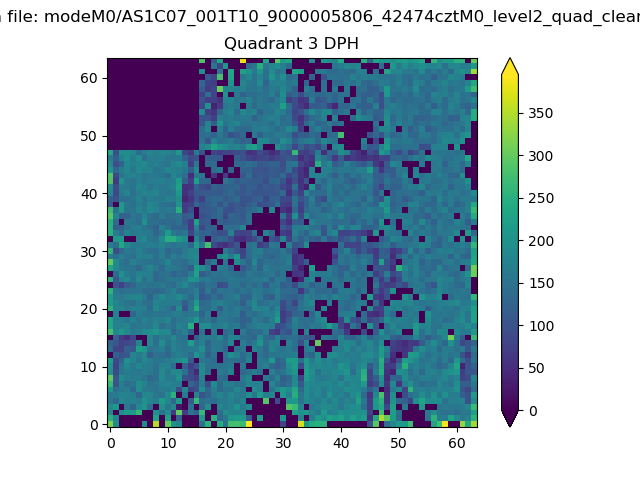 |
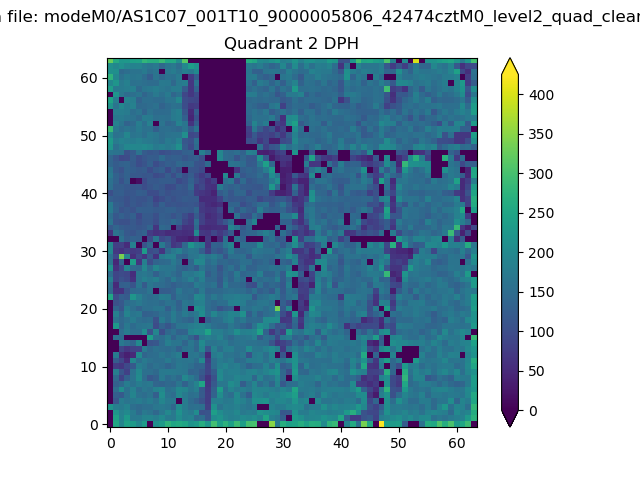 |
Quadrant C |
| Plot type | Count rate plots | Images |
|---|---|---|
| Comparison with Poisson distribution Blue bars denote a histogram of data divided into 1 sec bins. Red curve is a Poisson curve with rate = median count rate of data. |
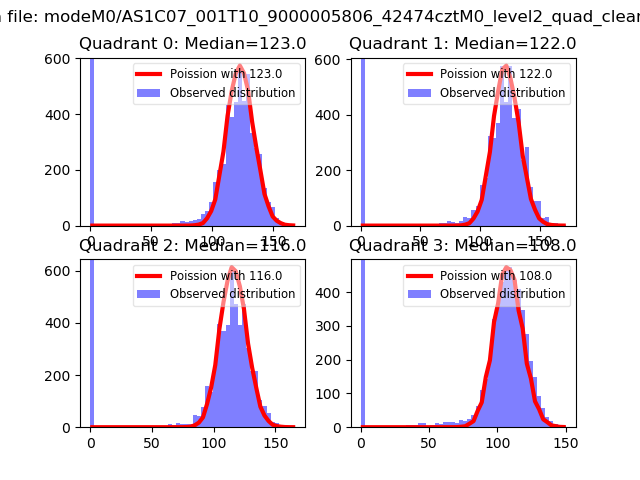 |
 |
| Quadrant-wise count rates Data is divided into 100 sec bins |
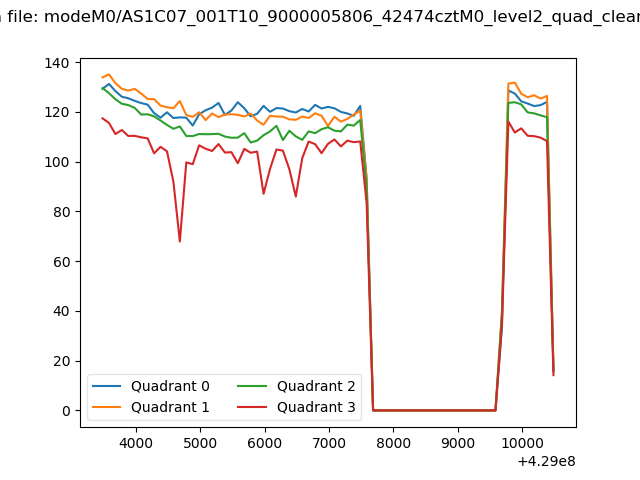 |
|
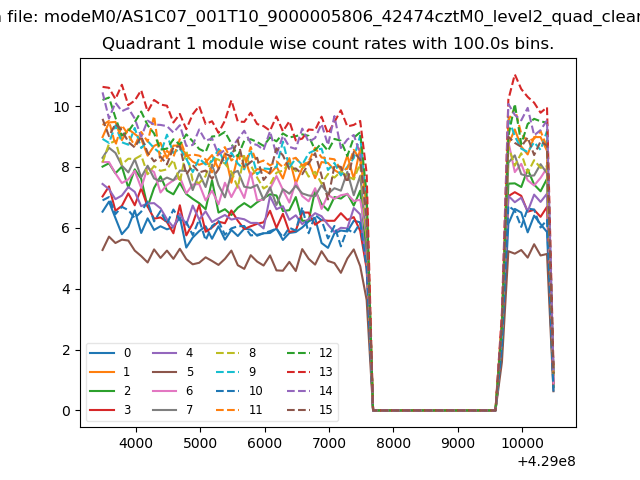
| Module-wise count rates for Quadrant A Data is divided into 100 sec bins |
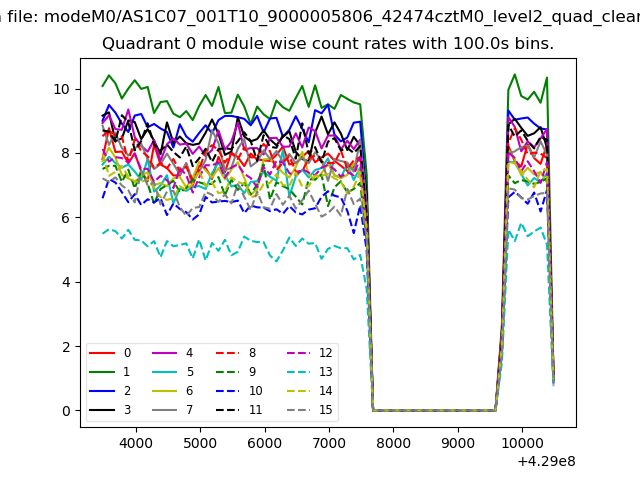 |
 |
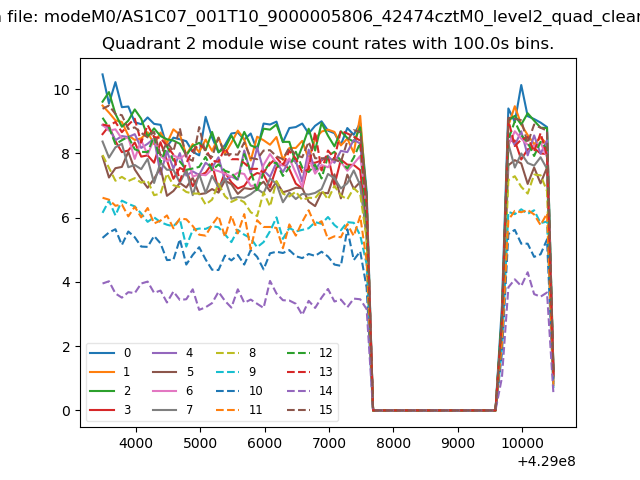
| Module-wise count rates for Quadrant B Data is divided into 100 sec bins |
 |
 |
| Module-wise count rates for Quadrant C Data is divided into 100 sec bins |
 |
 |
| Module-wise count rates for Quadrant D Data is divided into 100 sec bins |
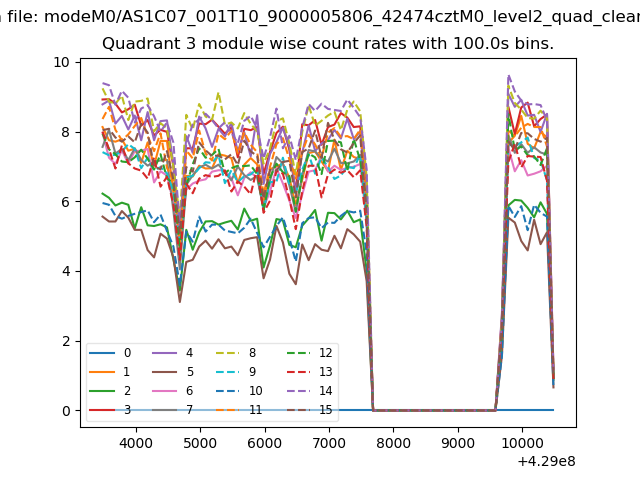 |
 |
| Parameter | Plot |
|---|---|
| CZT HV Monitor | 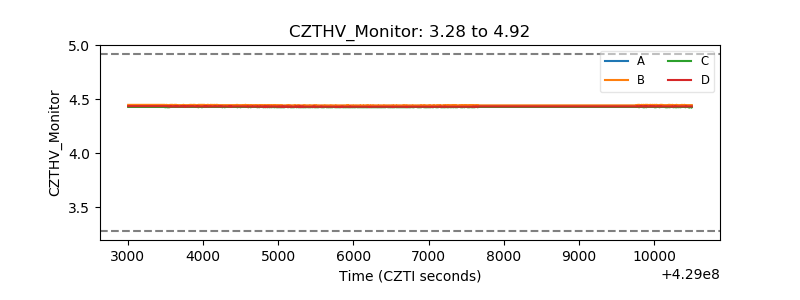 |
| D_VDD | 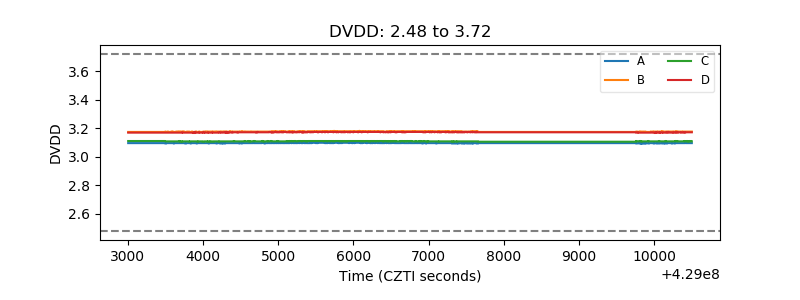 |
| Temperature 1 | 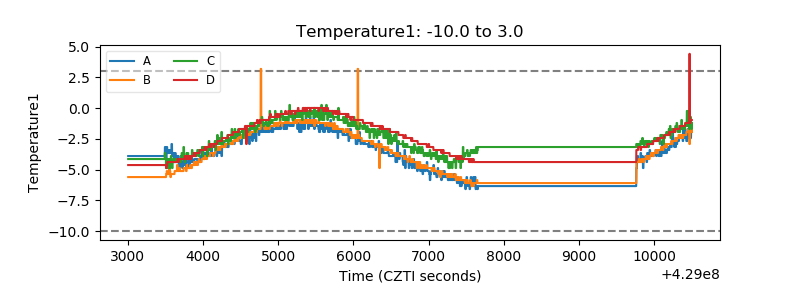 |
| Veto HV Monitor | 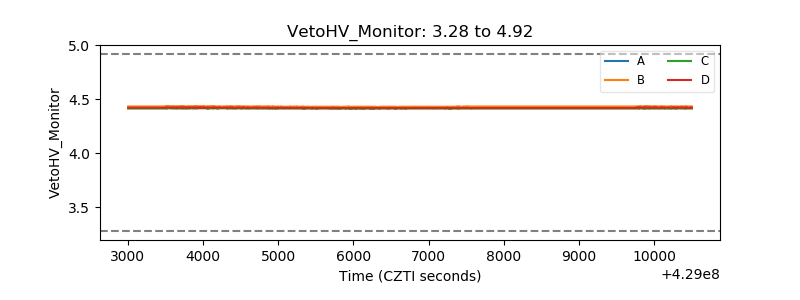 |
| Veto LLD | 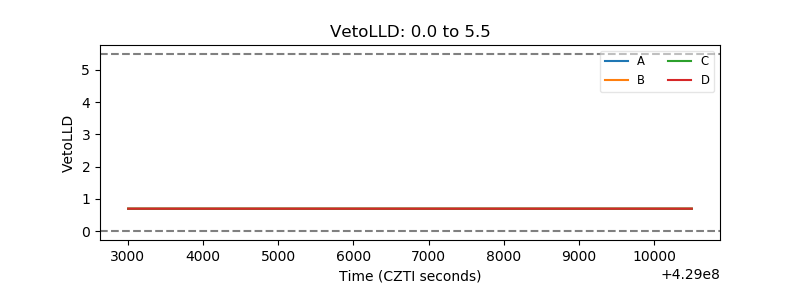 |
| Alpha Counter | 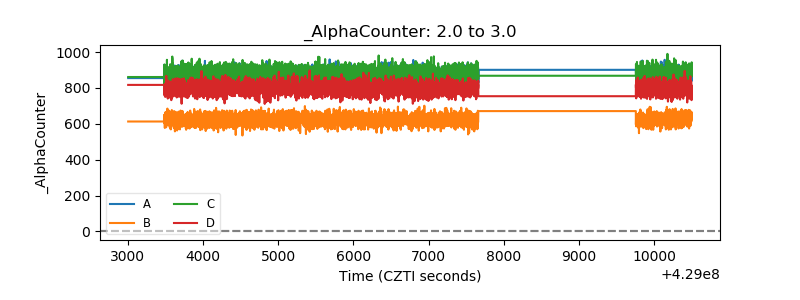 |
| _CPM_Rate | 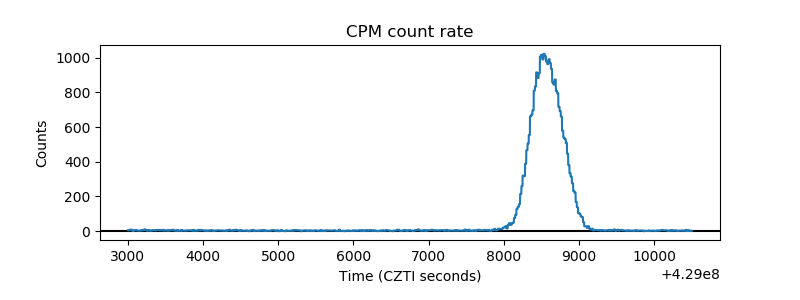 |
| CZT Counter | 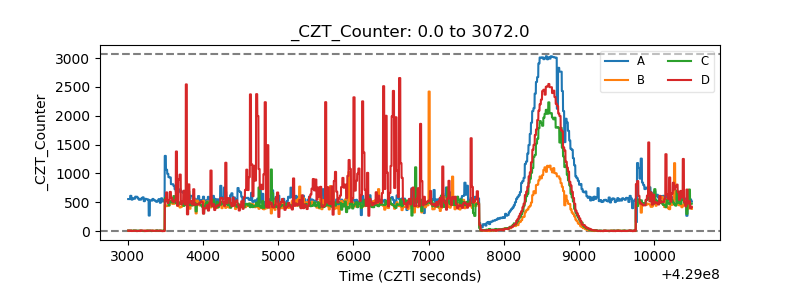 |
| +2.5 Volts monitor | 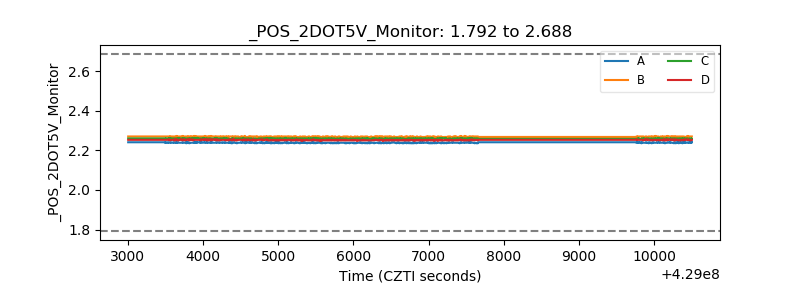 |
| +5 Volts monitor | 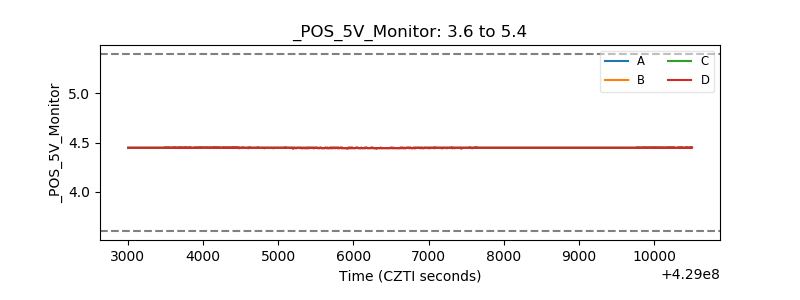 |
| _ROLL_ROT | 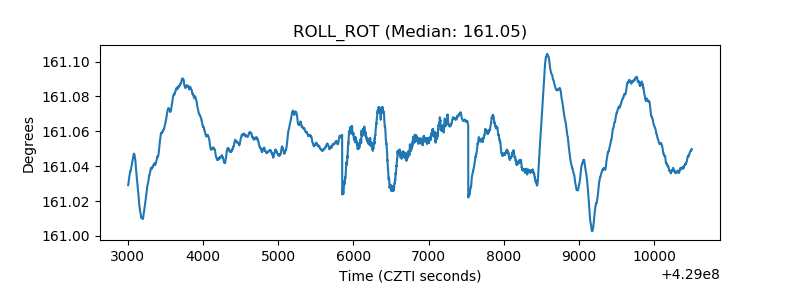 |
| _Roll_DEC | 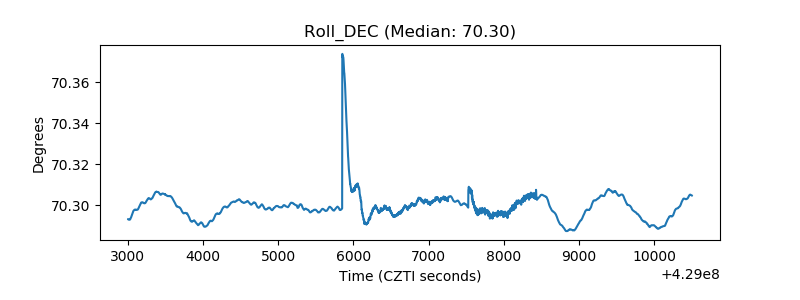 |
| _Roll_RA | 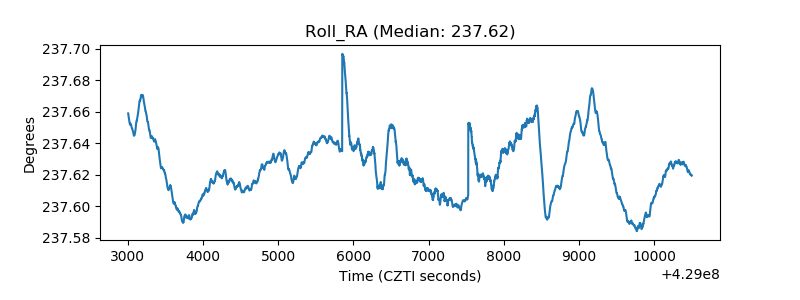 |
| Veto Counter | 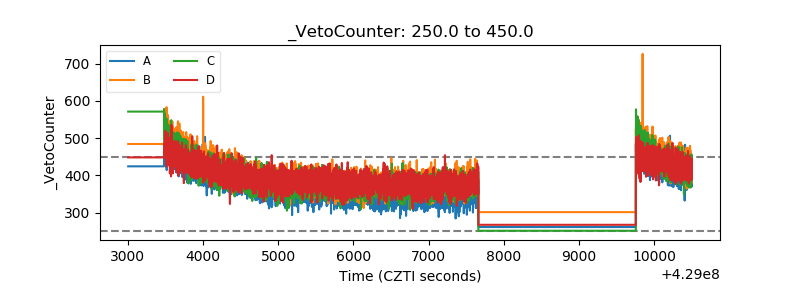 |