| Param | Original file | Final file |
|---|---|---|
| Filename | modeM0/AS1C07_001T10_9000005806_42477cztM0_level2.fits | modeM0/AS1C07_001T10_9000005806_42477cztM0_level2_quad_clean.evt |
| Size (bytes) | 315,576,000 | 88,004,160 |
| Size | 301.0 MB | 83.9 MB |
| Events in quadrant A | 3,144,443 | 596,897 |
| Events in quadrant B | 2,421,462 | 593,292 |
| Events in quadrant C | 2,526,966 | 567,596 |
| Events in quadrant D | 3,170,179 | 530,836 |
| Mode M9 | |||
|---|---|---|---|
| Quadrant | BADHDUFLAG | Total packets | Discarded packets |
| A | 0 | 19 | 0 |
| B | 0 | 20 | 0 |
| C | 0 | 20 | 0 |
| D | 0 | 20 | 0 |
| Mode SS | |||
|---|---|---|---|
| Quadrant | BADHDUFLAG | Total packets | Discarded packets |
| A | 0 | 110 | 0 |
| B | 0 | 110 | 0 |
| C | 0 | 110 | 0 |
| D | 0 | 110 | 0 |
| Mode M0 | |||
|---|---|---|---|
| Quadrant | BADHDUFLAG | Total packets | Discarded packets |
| A | 0 | 12602 | 2 |
| B | 0 | 11086 | 2 |
| C | 0 | 11035 | 2 |
| D | 0 | 13246 | 2 |
| Quadrant | Total seconds | Saturated seconds | Saturation percentage |
|---|---|---|---|
| A | 5368 | 20 | 0.372578% |
| B | 5368 | 20 | 0.372578% |
| C | 5368 | 9 | 0.167660% |
| D | 5367 | 148 | 2.757593% |
Noise dominated data is calculated using 1-second bins in cleaned event files. If a bin has >2000 counts, and if more than 50% of those come from <1% of pixels, then it is considered to be noise-dominated and hence unusable.
| Quadrant | # 1 sec bins | Bins with >0 counts | Bins with >2000 counts | High rate bins dominated by noise | Noise dominated (total time) | Noise dominated (detector-on time) | Marked lightcurve |
|---|---|---|---|---|---|---|---|
| A | 7280 | 5369 | 6 | 6 | 0.08% | 0.11% |  |
| B | 7280 | 5369 | 9 | 9 | 0.12% | 0.17% |  |
| C | 7280 | 5369 | 6 | 6 | 0.08% | 0.11% |  |
| D | 7279 | 5368 | 126 | 126 | 1.73% | 2.35% |  |
Top three noisy pixels from each quadrant. If the there are fewer than three noisy pixels in the level2.evt file, extra rows are filled as -1
| Pixel properties | Quadrant properties | ||||||
|---|---|---|---|---|---|---|---|
| Quadrant | DetID | PixID | Counts | Sigma | Mean | Median | Sigma |
| A | 10 | 83 | 618501 | 5321.2 | 565 | 554 | 116.1 |
| A | 12 | 189 | 281375 | 2418.18 | 565 | 554 | 116.1 |
| A | 13 | 248 | 20469 | 171.49 | 565 | 554 | 116.1 |
| B | 0 | 186 | 68755 | 632.78 | 557 | 541 | 107.8 |
| B | 15 | 35 | 42355 | 387.88 | 557 | 541 | 107.8 |
| B | 5 | 172 | 38452 | 351.68 | 557 | 541 | 107.8 |
| C | 15 | 214 | 225918 | 1762.51 | 551 | 552 | 127.9 |
| C | 14 | 254 | 71017 | 551.08 | 551 | 552 | 127.9 |
| C | 0 | 239 | 61443 | 476.21 | 551 | 552 | 127.9 |
| D | 1 | 52 | 356898 | 2650.63 | 553 | 538 | 134.4 |
| D | 10 | 118 | 300320 | 2229.8 | 553 | 538 | 134.4 |
| D | 9 | 19 | 55861 | 411.5 | 553 | 538 | 134.4 |
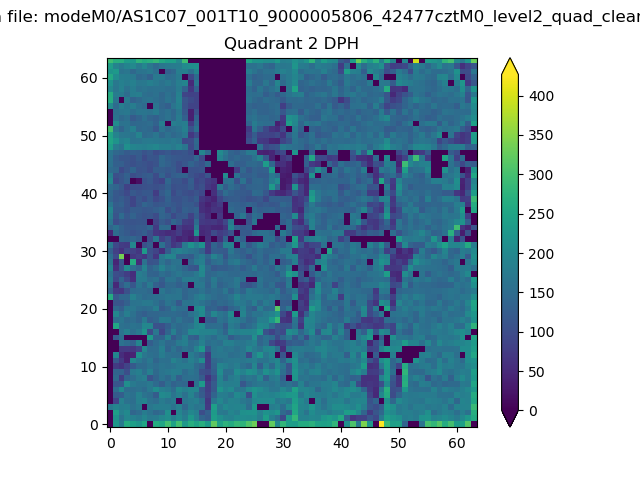
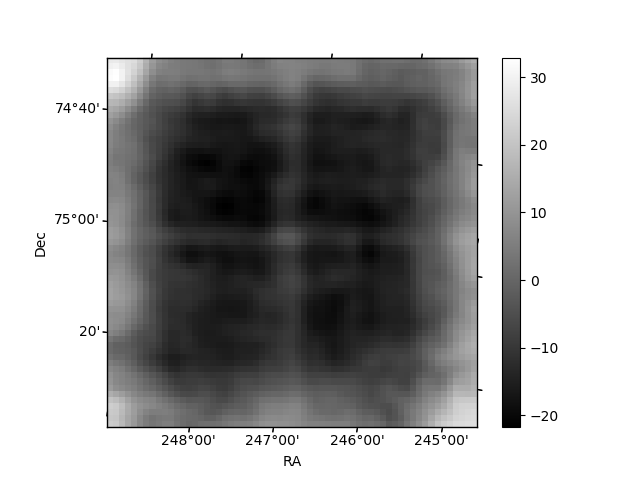
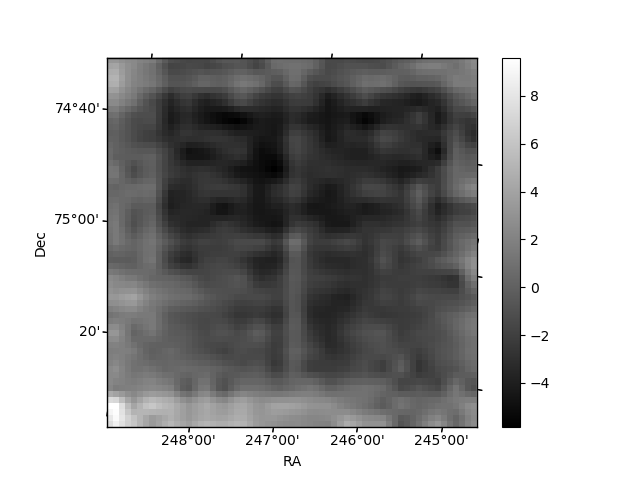
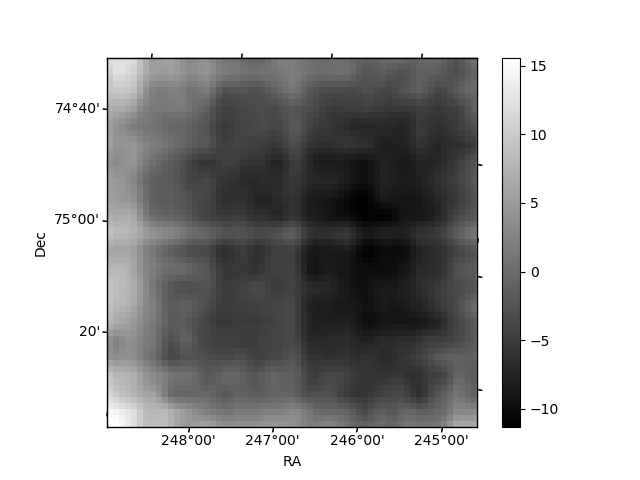
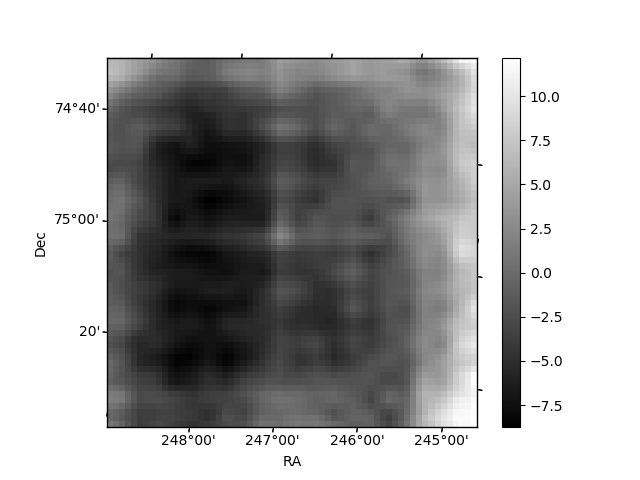
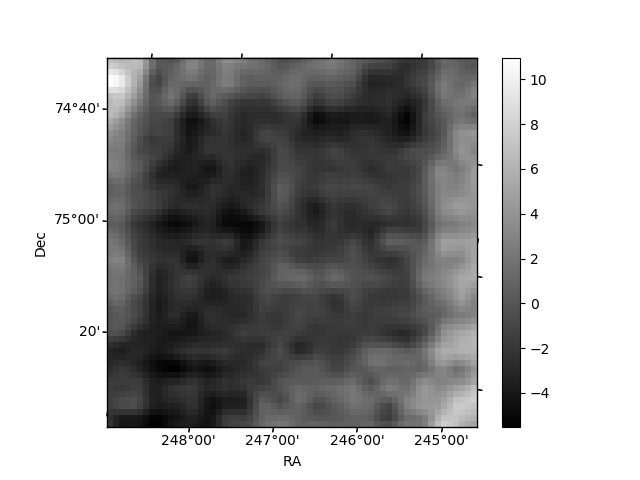
Histogram calculated using DETX and DETY for each event in the final _common_clean file
| Quadrant A | 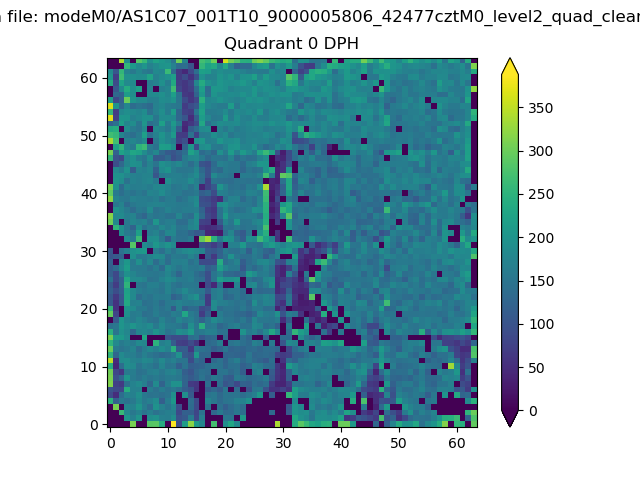 |
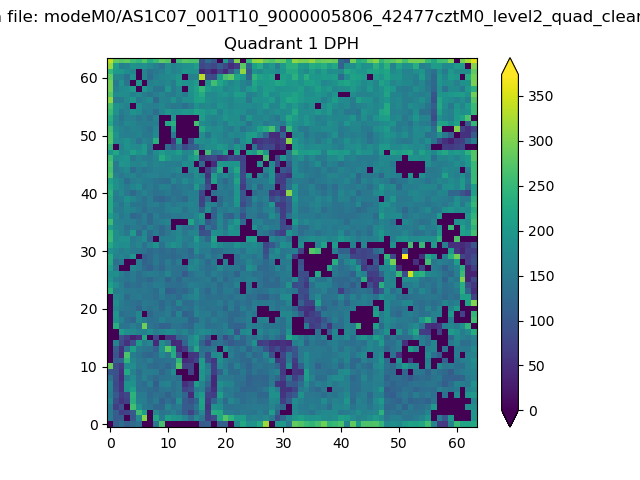 |
Quadrant B |
|---|---|---|---|
| Quadrant D | 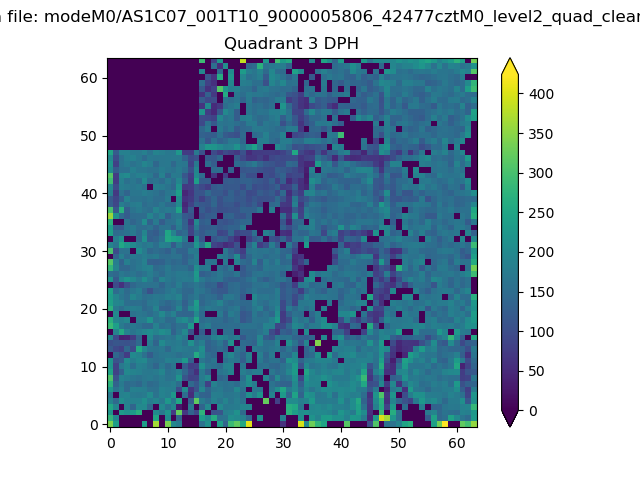 |
 |
Quadrant C |
| Plot type | Count rate plots | Images |
|---|---|---|
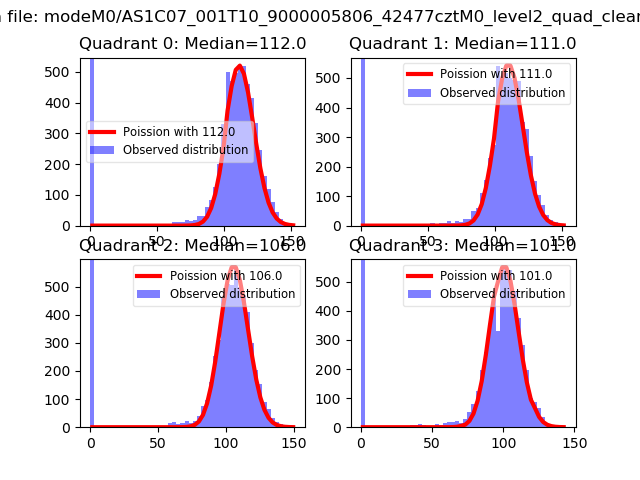
| Comparison with Poisson distribution Blue bars denote a histogram of data divided into 1 sec bins. Red curve is a Poisson curve with rate = median count rate of data. |
 |
 |
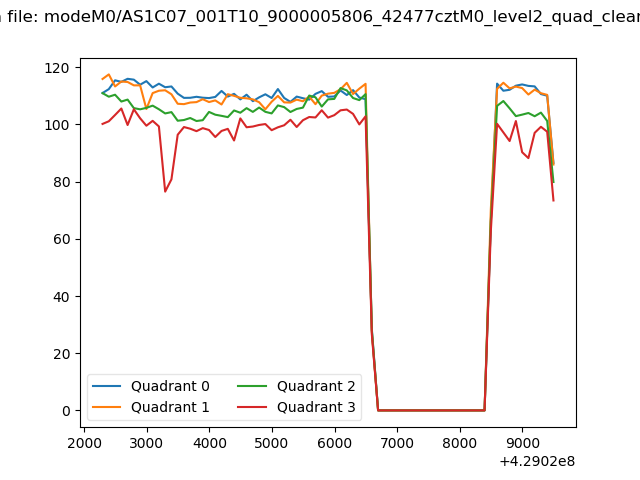
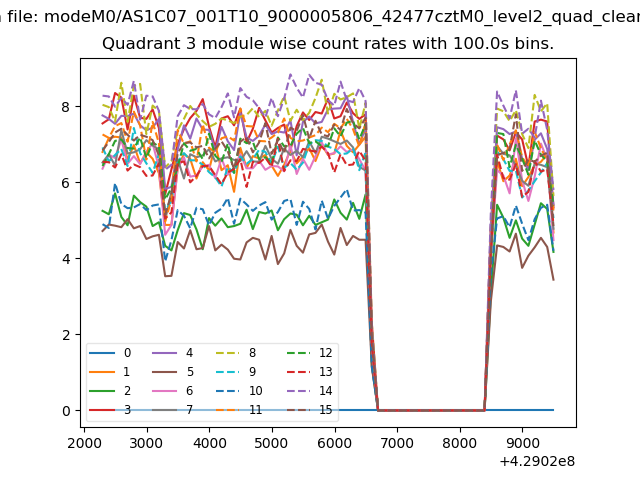
| Quadrant-wise count rates Data is divided into 100 sec bins |
 |
|
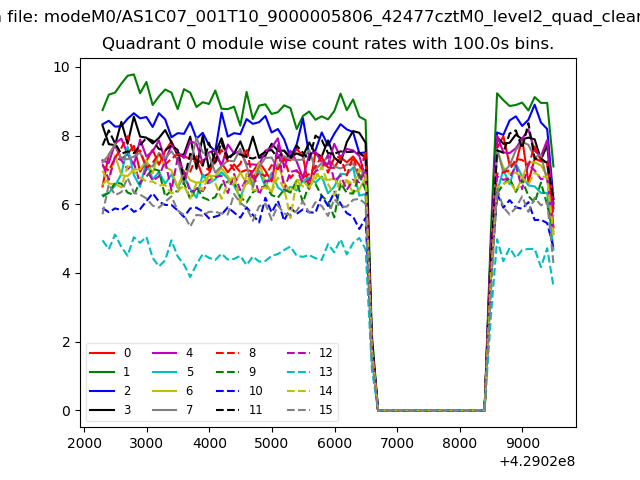
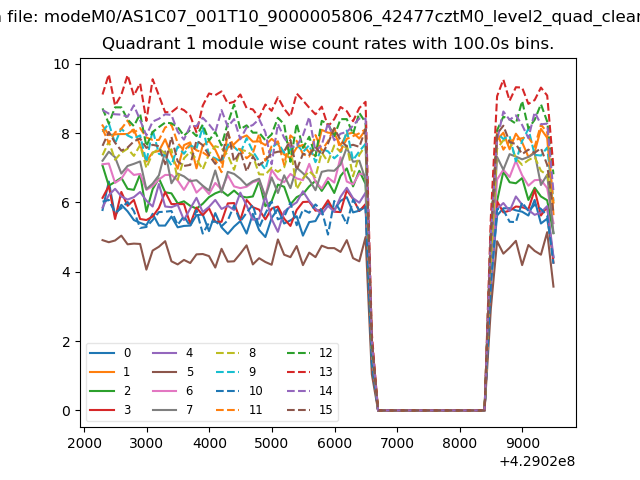
| Module-wise count rates for Quadrant A Data is divided into 100 sec bins |
 |
 |
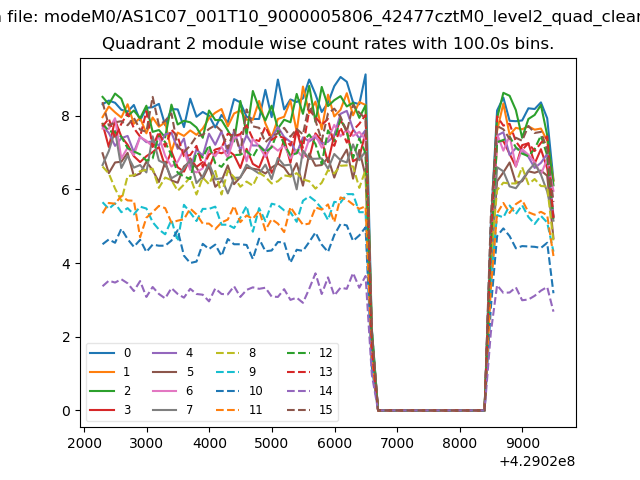
| Module-wise count rates for Quadrant B Data is divided into 100 sec bins |
 |
 |
| Module-wise count rates for Quadrant C Data is divided into 100 sec bins |
 |
 |
| Module-wise count rates for Quadrant D Data is divided into 100 sec bins |
 |
 |
| Parameter | Plot |
|---|---|
| CZT HV Monitor | 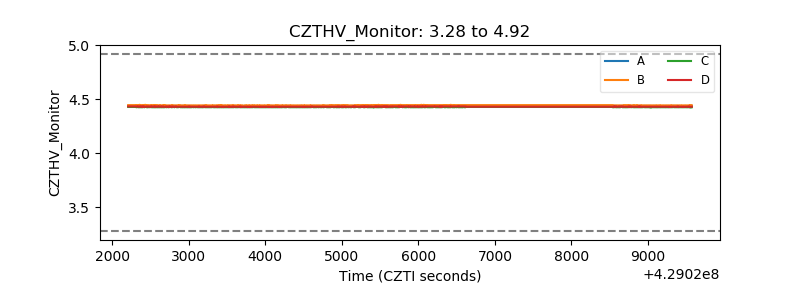 |
| D_VDD | 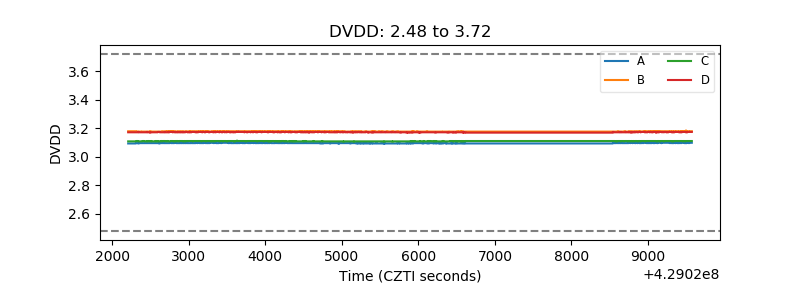 |
| Temperature 1 | 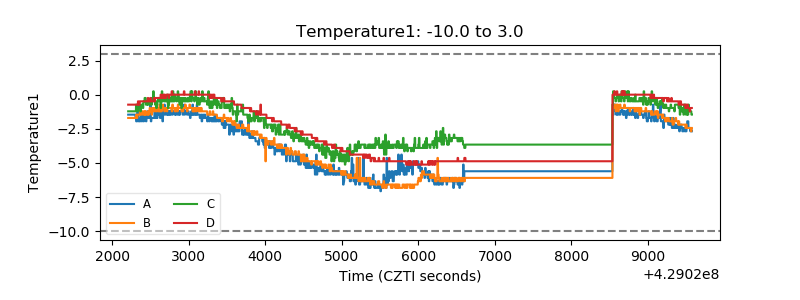 |
| Veto HV Monitor | 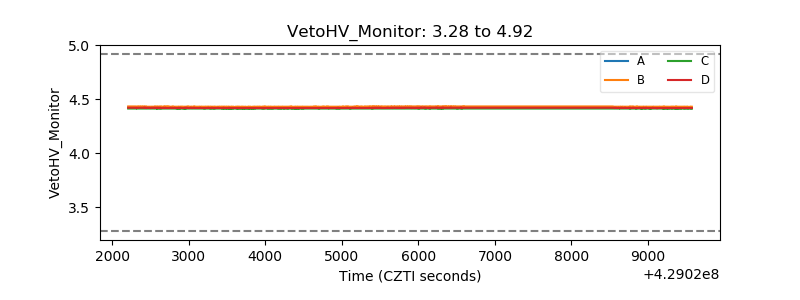 |
| Veto LLD | 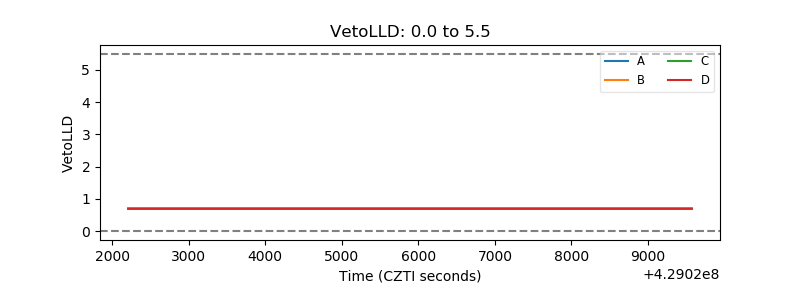 |
| Alpha Counter |  |
| _CPM_Rate | 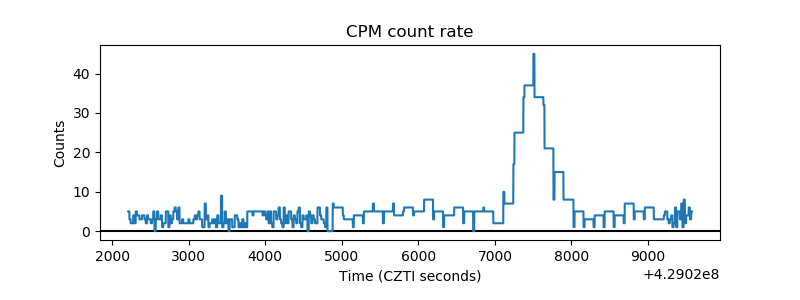 |
| CZT Counter | 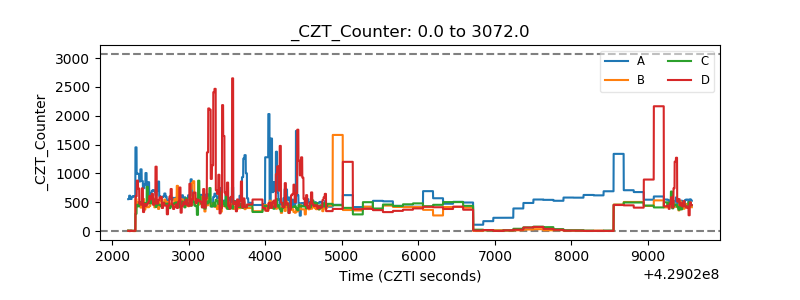 |
| +2.5 Volts monitor | 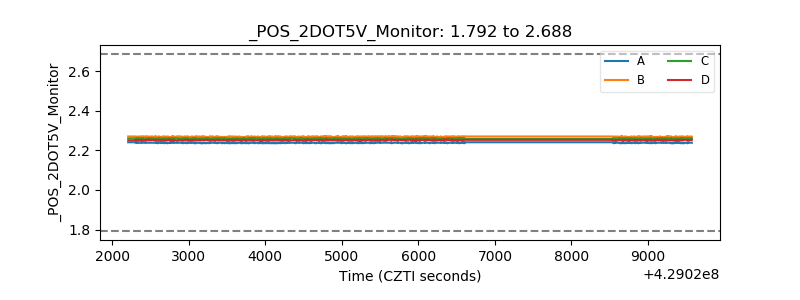 |
| +5 Volts monitor | 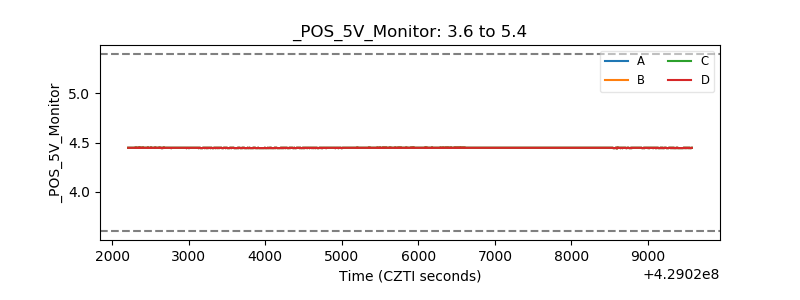 |
| _ROLL_ROT | 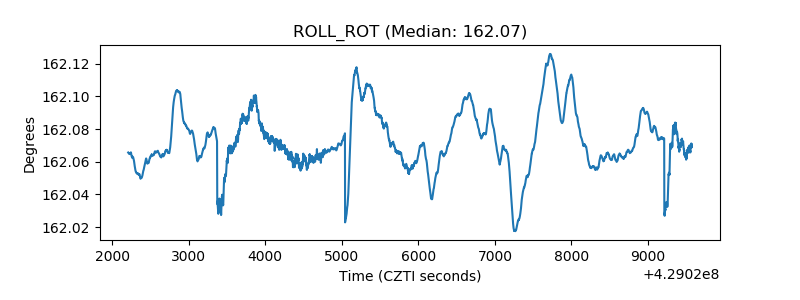 |
| _Roll_DEC | 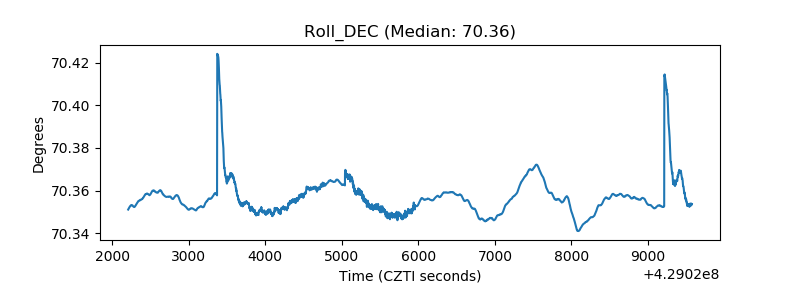 |
| _Roll_RA | 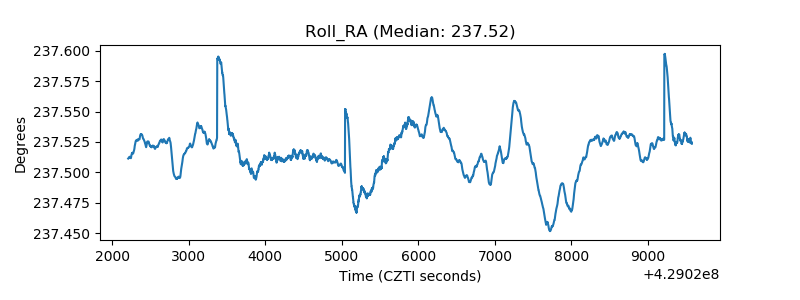 |
| Veto Counter | 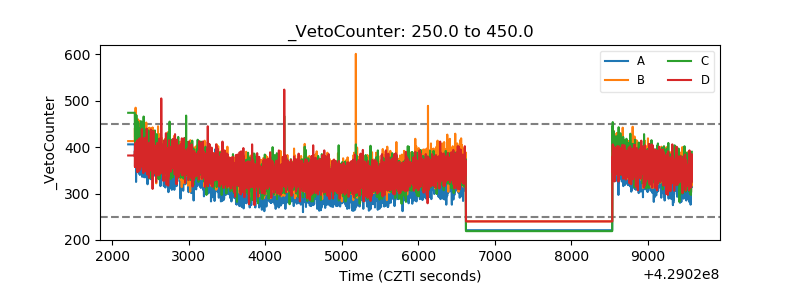 |