| Param | Original file | Final file |
|---|---|---|
| Filename | modeM0/AS1C07_001T10_9000005806_42479cztM0_level2.fits | modeM0/AS1C07_001T10_9000005806_42479cztM0_level2_quad_clean.evt |
| Size (bytes) | 379,946,880 | 88,977,600 |
| Size | 362.3 MB | 84.9 MB |
| Events in quadrant A | 3,055,484 | 615,736 |
| Events in quadrant B | 2,551,847 | 615,862 |
| Events in quadrant C | 2,635,150 | 596,721 |
| Events in quadrant D | 5,374,748 | 464,296 |
| Mode M9 | |||
|---|---|---|---|
| Quadrant | BADHDUFLAG | Total packets | Discarded packets |
| A | 0 | 13 | 0 |
| B | 0 | 14 | 0 |
| C | 0 | 14 | 0 |
| D | 0 | 14 | 0 |
| Mode SS | |||
|---|---|---|---|
| Quadrant | BADHDUFLAG | Total packets | Discarded packets |
| A | 0 | 118 | 0 |
| B | 0 | 118 | 0 |
| C | 0 | 118 | 0 |
| D | 0 | 118 | 0 |
| Mode M0 | |||
|---|---|---|---|
| Quadrant | BADHDUFLAG | Total packets | Discarded packets |
| A | 0 | 12581 | 2 |
| B | 0 | 11863 | 2 |
| C | 0 | 11689 | 2 |
| D | 0 | 20092 | 9 |
| Quadrant | Total seconds | Saturated seconds | Saturation percentage |
|---|---|---|---|
| A | 5736 | 14 | 0.244073% |
| B | 5736 | 20 | 0.348675% |
| C | 5736 | 10 | 0.174338% |
| D | 5735 | 1119 | 19.511770% |
Noise dominated data is calculated using 1-second bins in cleaned event files. If a bin has >2000 counts, and if more than 50% of those come from <1% of pixels, then it is considered to be noise-dominated and hence unusable.
| Quadrant | # 1 sec bins | Bins with >0 counts | Bins with >2000 counts | High rate bins dominated by noise | Noise dominated (total time) | Noise dominated (detector-on time) | Marked lightcurve |
|---|---|---|---|---|---|---|---|
| A | 7078 | 5737 | 4 | 4 | 0.06% | 0.07% | 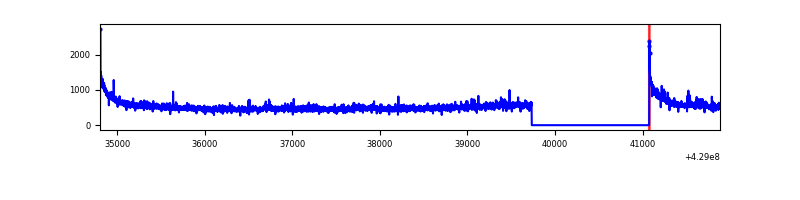 |
| B | 7078 | 5737 | 10 | 10 | 0.14% | 0.17% | 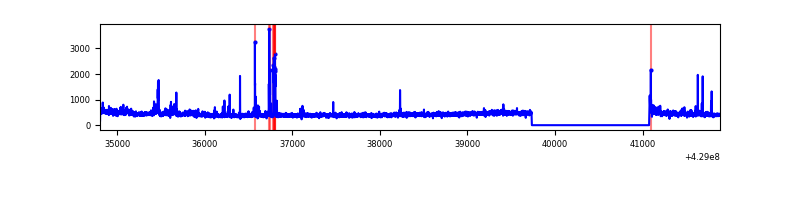 |
| C | 7078 | 5737 | 2 | 2 | 0.03% | 0.03% | 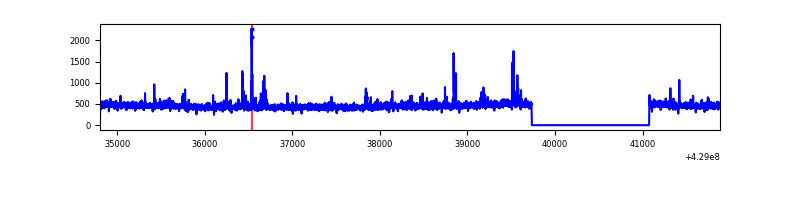 |
| D | 7077 | 5736 | 1066 | 1066 | 15.06% | 18.58% | 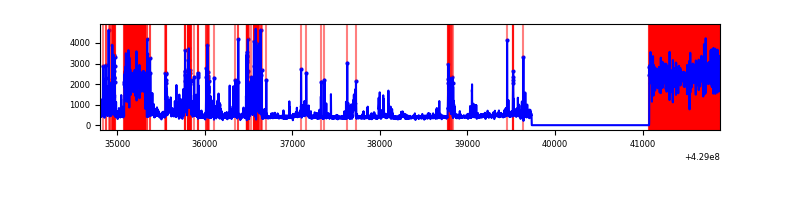 |
Top three noisy pixels from each quadrant. If the there are fewer than three noisy pixels in the level2.evt file, extra rows are filled as -1
| Pixel properties | Quadrant properties | ||||||
|---|---|---|---|---|---|---|---|
| Quadrant | DetID | PixID | Counts | Sigma | Mean | Median | Sigma |
| A | 10 | 83 | 622568 | 5001.65 | 602 | 590 | 124.4 |
| A | 12 | 189 | 63596 | 506.66 | 602 | 590 | 124.4 |
| A | 13 | 6 | 21442 | 167.68 | 602 | 590 | 124.4 |
| B | 5 | 172 | 76289 | 661.35 | 594 | 577 | 114.5 |
| B | 0 | 186 | 69338 | 600.64 | 594 | 577 | 114.5 |
| B | 5 | 207 | 20532 | 174.31 | 594 | 577 | 114.5 |
| C | 15 | 214 | 238899 | 1727.98 | 586 | 590 | 137.9 |
| C | 14 | 254 | 56742 | 407.16 | 586 | 590 | 137.9 |
| C | 12 | 249 | 24004 | 169.77 | 586 | 590 | 137.9 |
| D | 2 | 16 | 2135141 | 15754.04 | 553 | 536 | 135.5 |
| D | 1 | 52 | 199545 | 1468.75 | 553 | 536 | 135.5 |
| D | 12 | 233 | 178826 | 1315.84 | 553 | 536 | 135.5 |
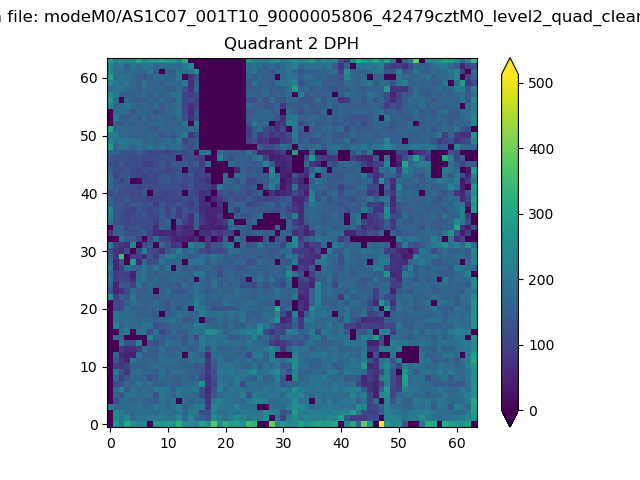
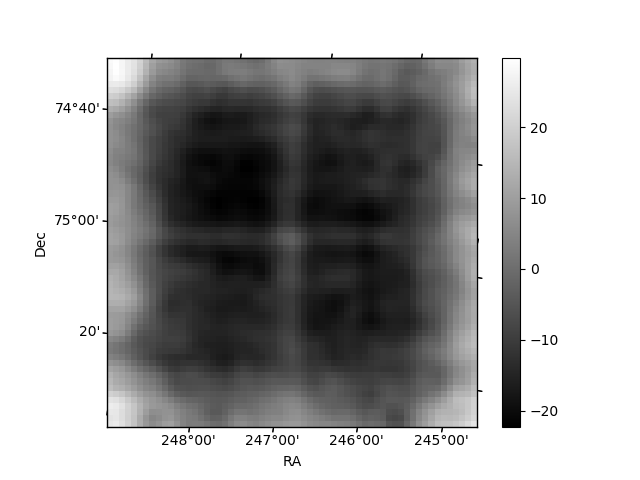
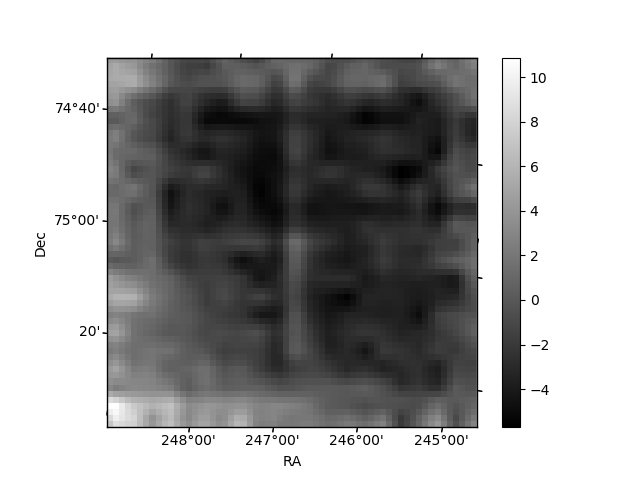
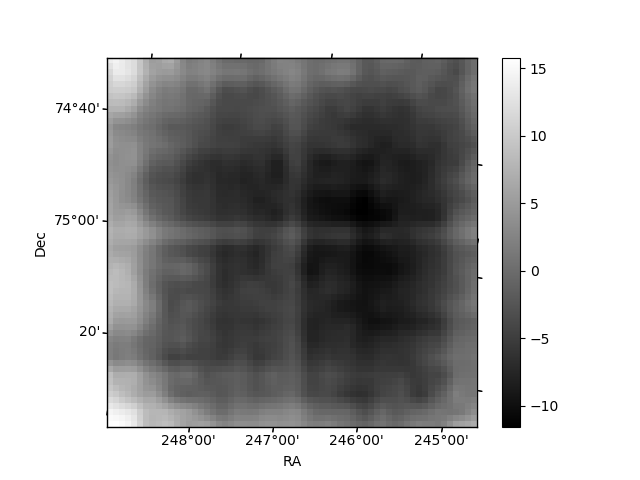
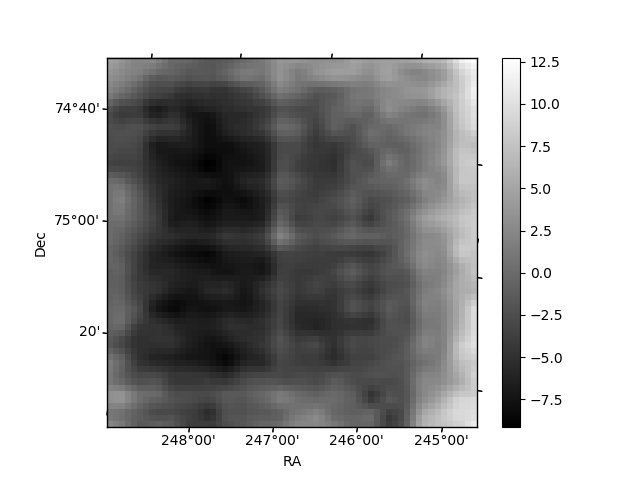
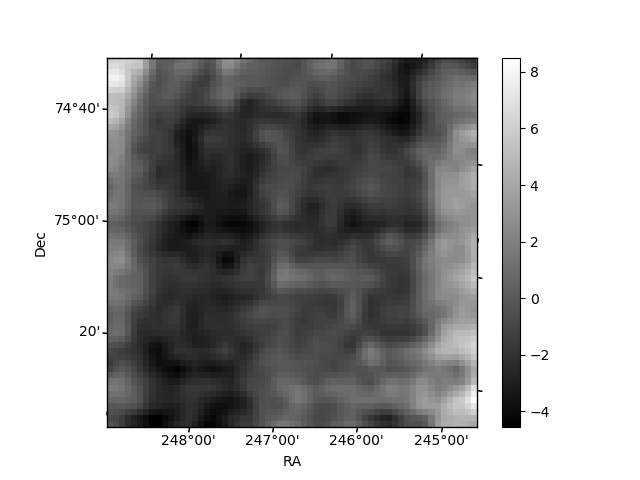
Histogram calculated using DETX and DETY for each event in the final _common_clean file
| Quadrant A | 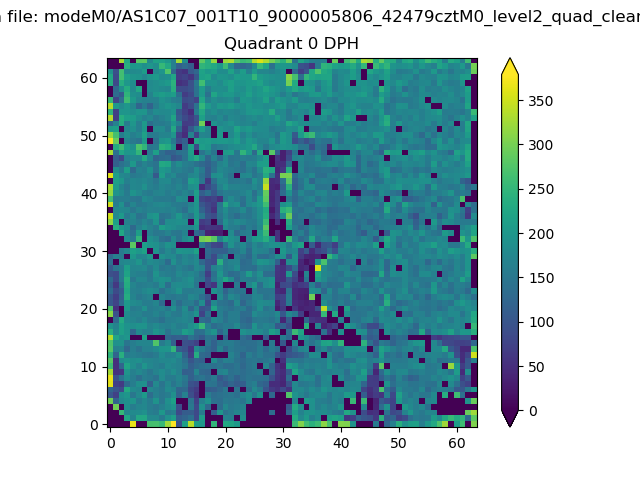 |
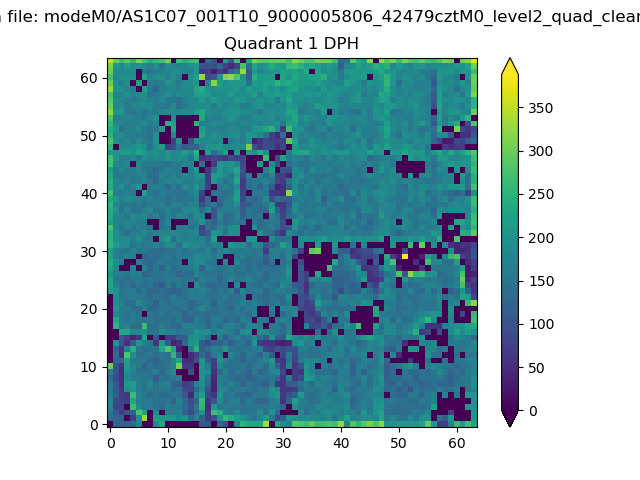 |
Quadrant B |
|---|---|---|---|
| Quadrant D | 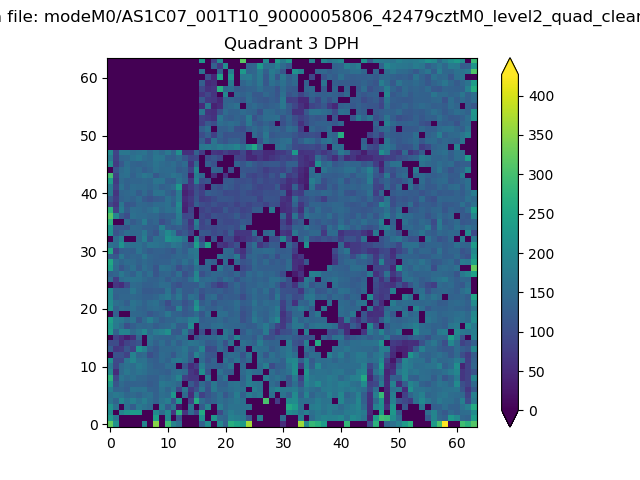 |
 |
Quadrant C |
| Plot type | Count rate plots | Images |
|---|---|---|
| Comparison with Poisson distribution Blue bars denote a histogram of data divided into 1 sec bins. Red curve is a Poisson curve with rate = median count rate of data. |
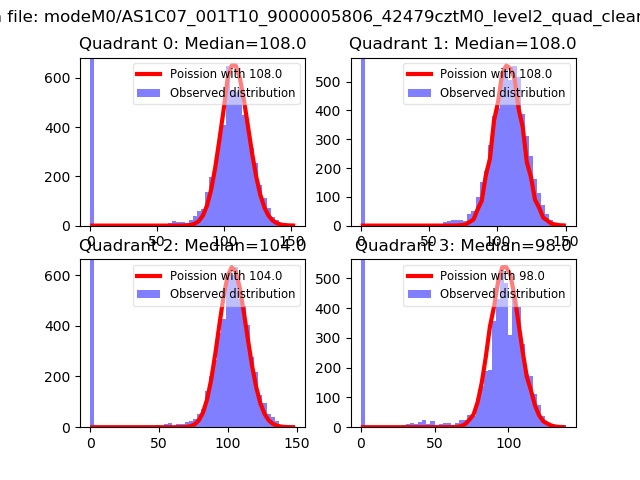 |
 |
| Quadrant-wise count rates Data is divided into 100 sec bins |
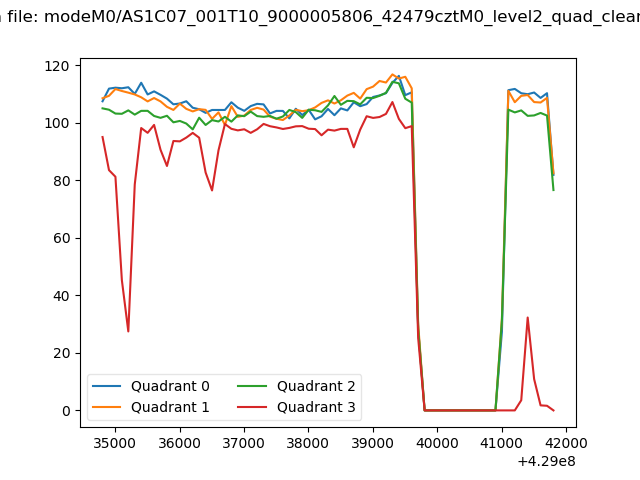 |
|
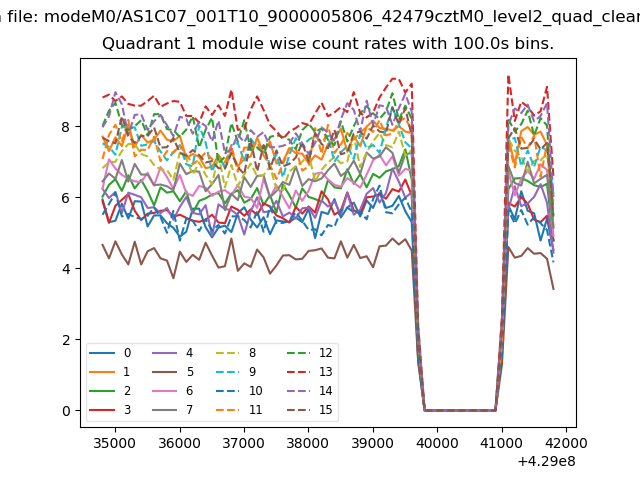
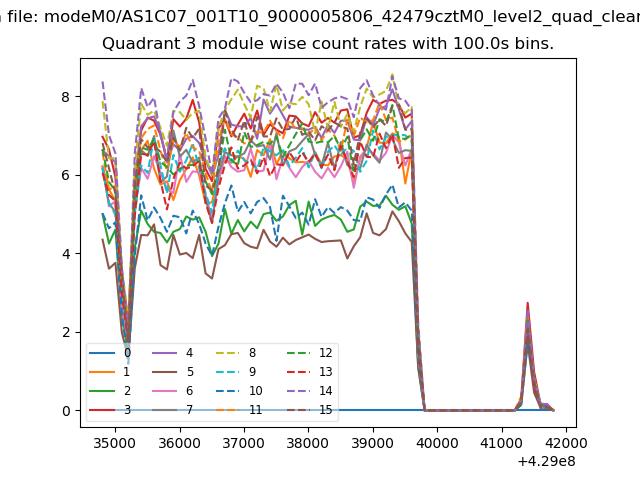
| Module-wise count rates for Quadrant A Data is divided into 100 sec bins |
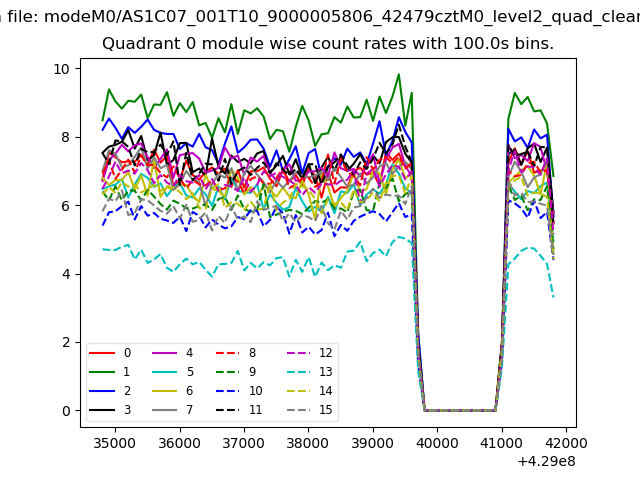 |
 |
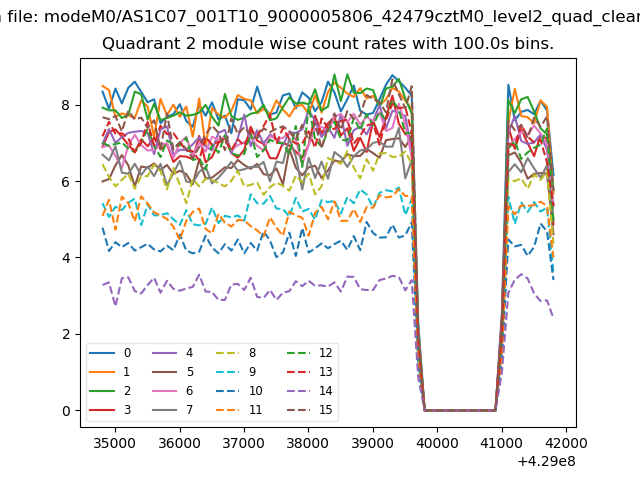
| Module-wise count rates for Quadrant B Data is divided into 100 sec bins |
 |
 |
| Module-wise count rates for Quadrant C Data is divided into 100 sec bins |
 |
 |
| Module-wise count rates for Quadrant D Data is divided into 100 sec bins |
 |
 |
| Parameter | Plot |
|---|---|
| CZT HV Monitor | 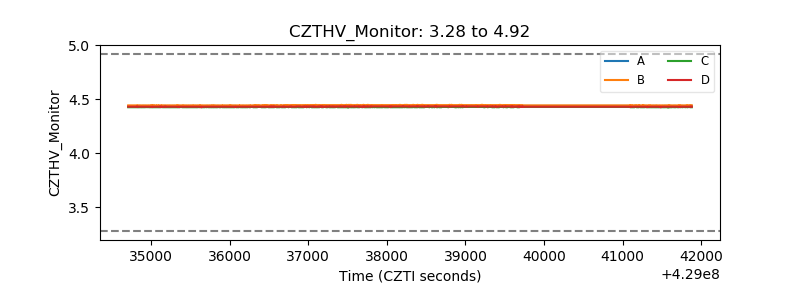 |
| D_VDD | 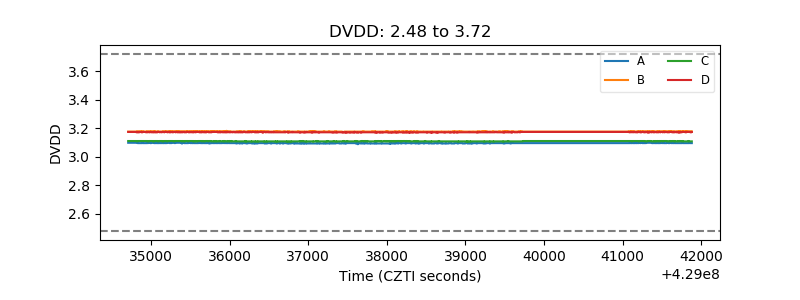 |
| Temperature 1 | 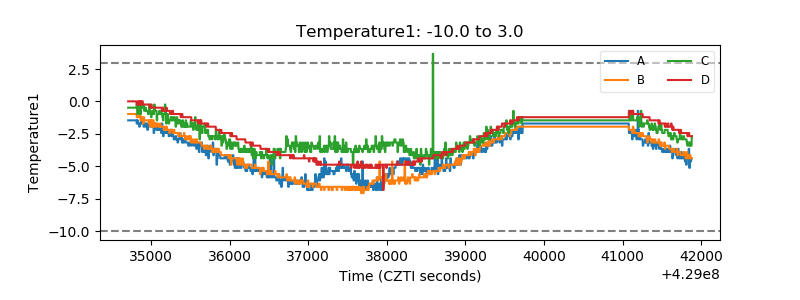 |
| Veto HV Monitor | 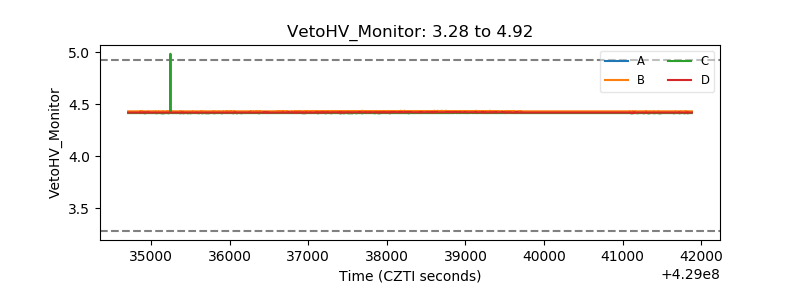 |
| Veto LLD | 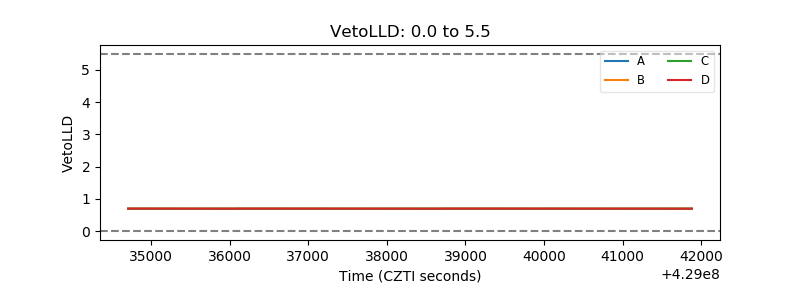 |
| Alpha Counter | 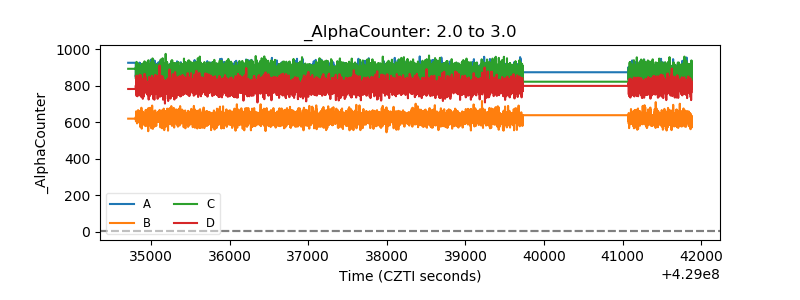 |
| _CPM_Rate | 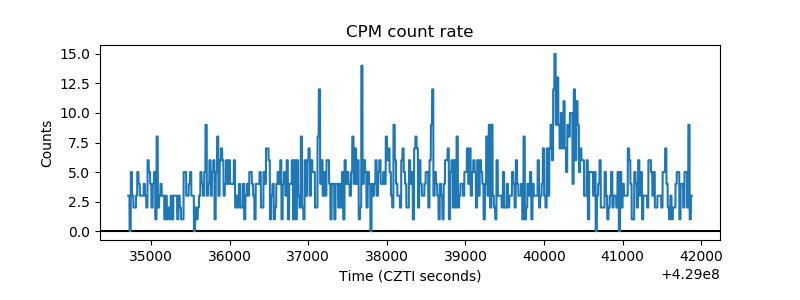 |
| CZT Counter | 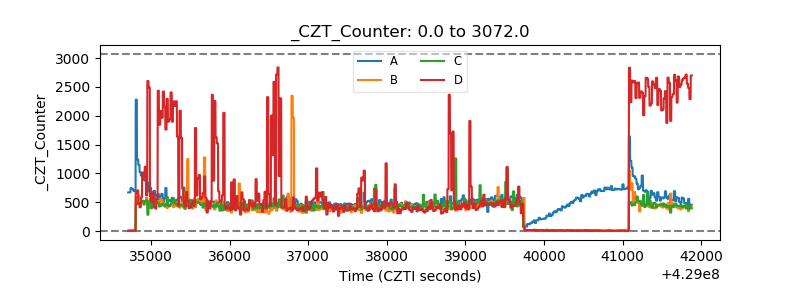 |
| +2.5 Volts monitor | 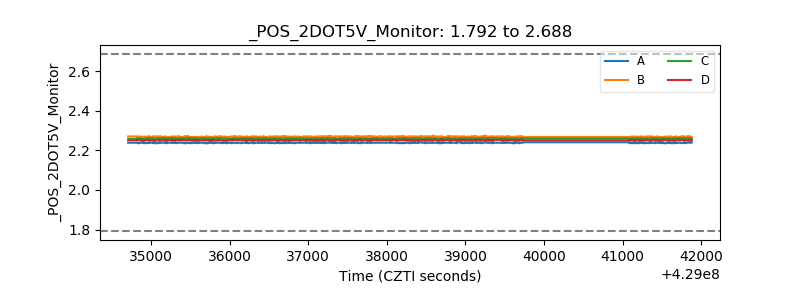 |
| +5 Volts monitor | 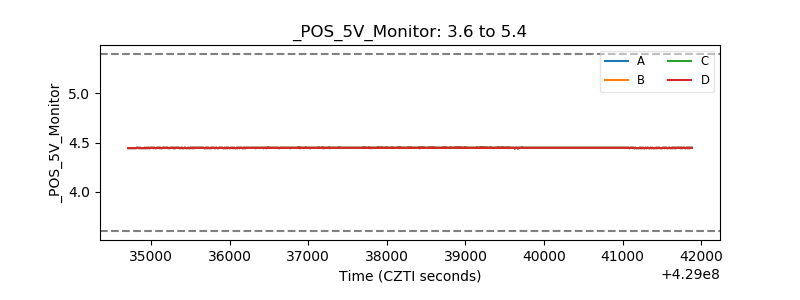 |
| _ROLL_ROT | 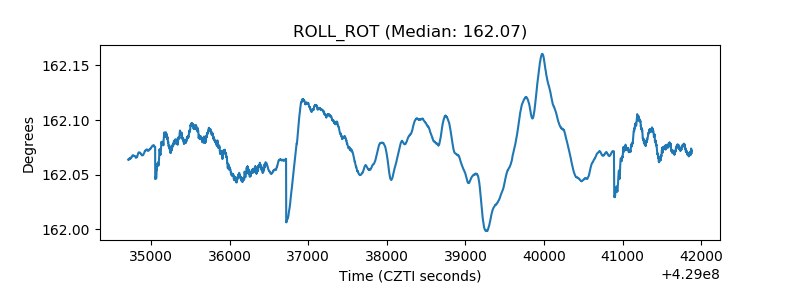 |
| _Roll_DEC | 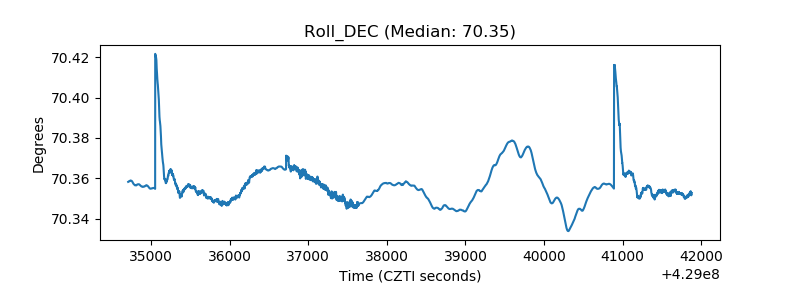 |
| _Roll_RA | 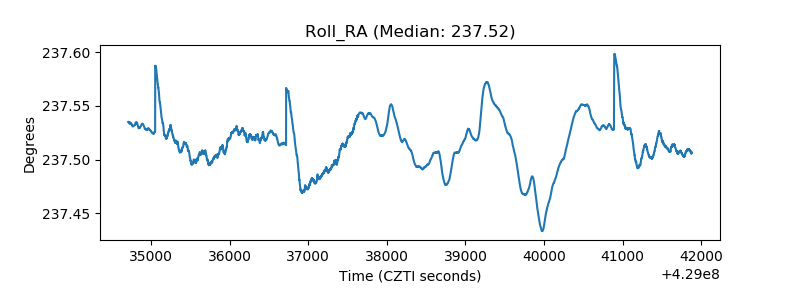 |
| Veto Counter | 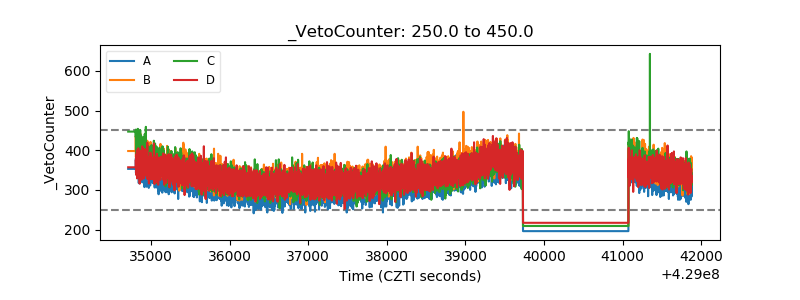 |