| Param | Original file | Final file |
|---|---|---|
| Filename | modeM0/AS1C07_001T10_9000005806_42480cztM0_level2.fits | modeM0/AS1C07_001T10_9000005806_42480cztM0_level2_quad_clean.evt |
| Size (bytes) | 399,988,800 | 92,589,120 |
| Size | 381.5 MB | 88.3 MB |
| Events in quadrant A | 3,268,635 | 636,712 |
| Events in quadrant B | 2,659,318 | 637,827 |
| Events in quadrant C | 2,728,991 | 621,726 |
| Events in quadrant D | 5,686,549 | 491,860 |
| Mode M9 | |||
|---|---|---|---|
| Quadrant | BADHDUFLAG | Total packets | Discarded packets |
| A | 0 | 15 | 0 |
| B | 0 | 16 | 0 |
| C | 0 | 16 | 0 |
| D | 0 | 16 | 0 |
| Mode SS | |||
|---|---|---|---|
| Quadrant | BADHDUFLAG | Total packets | Discarded packets |
| A | 0 | 122 | 0 |
| B | 0 | 122 | 0 |
| C | 0 | 122 | 0 |
| D | 0 | 122 | 0 |
| Mode M0 | |||
|---|---|---|---|
| Quadrant | BADHDUFLAG | Total packets | Discarded packets |
| A | 0 | 13382 | 2 |
| B | 0 | 12358 | 2 |
| C | 0 | 12078 | 2 |
| D | 0 | 21314 | 2 |
| Quadrant | Total seconds | Saturated seconds | Saturation percentage |
|---|---|---|---|
| A | 5941 | 14 | 0.235651% |
| B | 5941 | 10 | 0.168322% |
| C | 5941 | 9 | 0.151490% |
| D | 5941 | 1060 | 17.842114% |
Noise dominated data is calculated using 1-second bins in cleaned event files. If a bin has >2000 counts, and if more than 50% of those come from <1% of pixels, then it is considered to be noise-dominated and hence unusable.
| Quadrant | # 1 sec bins | Bins with >0 counts | Bins with >2000 counts | High rate bins dominated by noise | Noise dominated (total time) | Noise dominated (detector-on time) | Marked lightcurve |
|---|---|---|---|---|---|---|---|
| A | 7254 | 5942 | 6 | 6 | 0.08% | 0.10% | 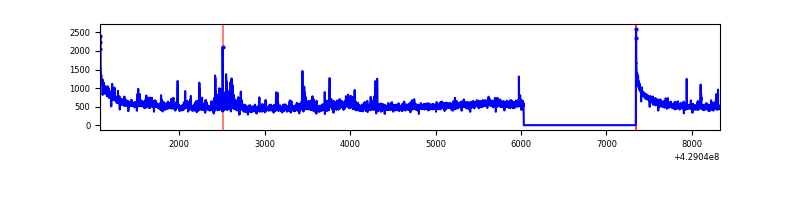 |
| B | 7254 | 5942 | 3 | 3 | 0.04% | 0.05% | 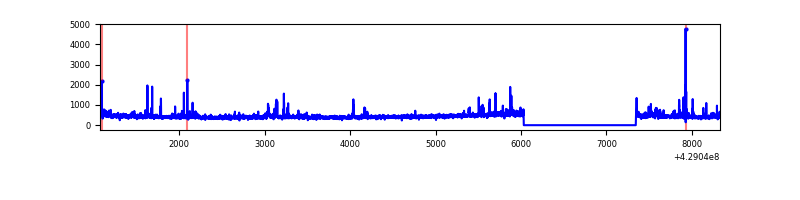 |
| C | 7254 | 5942 | 2 | 2 | 0.03% | 0.03% | 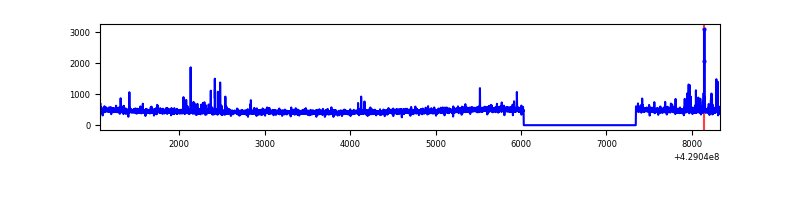 |
| D | 7254 | 5942 | 975 | 975 | 13.44% | 16.41% | 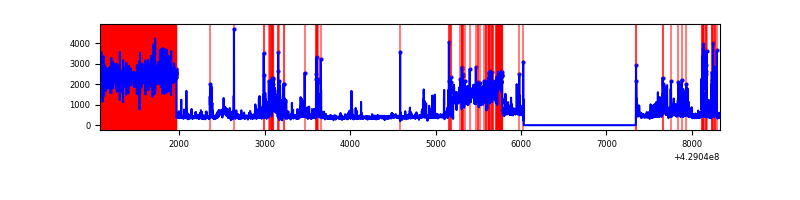 |
Top three noisy pixels from each quadrant. If the there are fewer than three noisy pixels in the level2.evt file, extra rows are filled as -1
| Pixel properties | Quadrant properties | ||||||
|---|---|---|---|---|---|---|---|
| Quadrant | DetID | PixID | Counts | Sigma | Mean | Median | Sigma |
| A | 10 | 83 | 619701 | 4844.22 | 623 | 610 | 127.8 |
| A | 12 | 189 | 193698 | 1510.86 | 623 | 610 | 127.8 |
| A | 13 | 6 | 15103 | 113.4 | 623 | 610 | 127.8 |
| B | 0 | 245 | 63185 | 525.86 | 616 | 597 | 119.0 |
| B | 0 | 186 | 51306 | 426.05 | 616 | 597 | 119.0 |
| B | 5 | 172 | 51180 | 424.99 | 616 | 597 | 119.0 |
| C | 15 | 214 | 244954 | 1720.87 | 608 | 612 | 142.0 |
| C | 14 | 254 | 50590 | 351.99 | 608 | 612 | 142.0 |
| C | 0 | 239 | 18674 | 127.21 | 608 | 612 | 142.0 |
| D | 2 | 16 | 2491631 | 17500.97 | 579 | 561 | 142.3 |
| D | 12 | 0 | 211538 | 1482.22 | 579 | 561 | 142.3 |
| D | 4 | 239 | 192949 | 1351.62 | 579 | 561 | 142.3 |
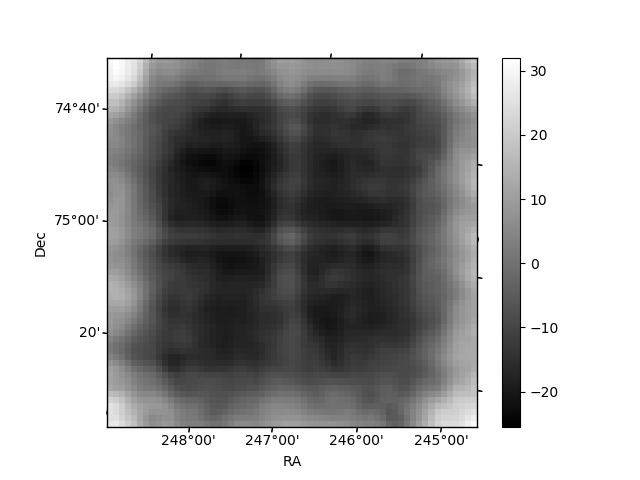
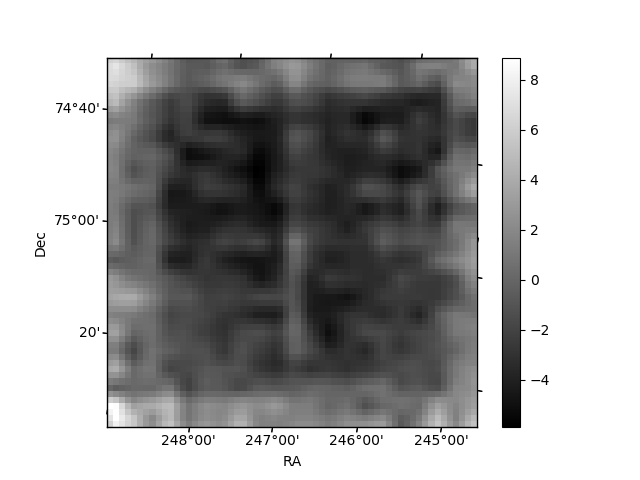
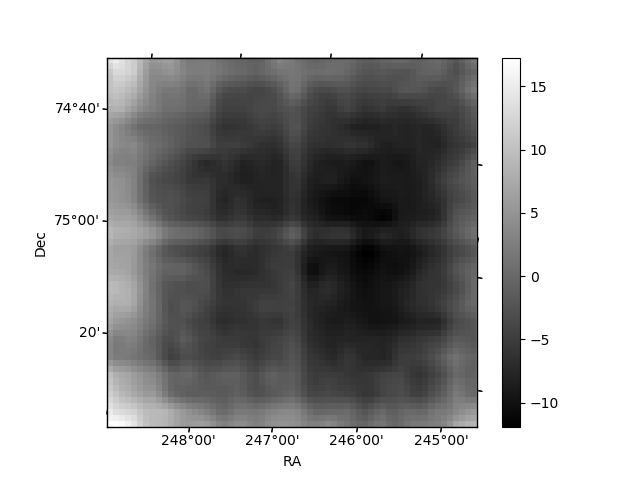
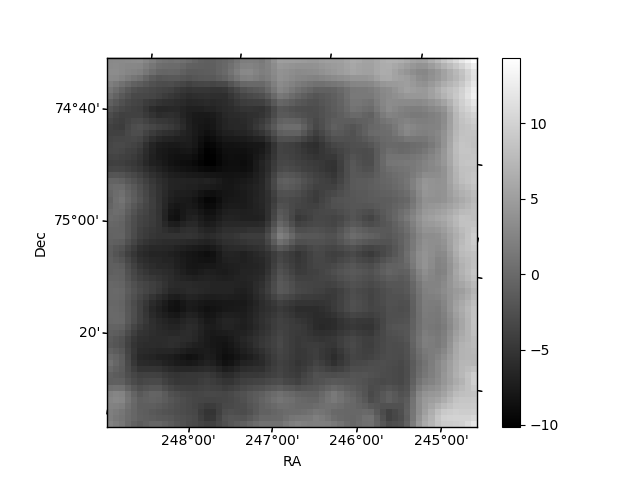
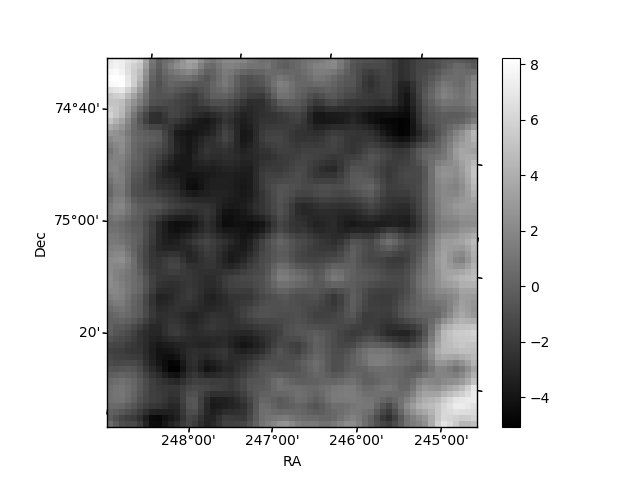
Histogram calculated using DETX and DETY for each event in the final _common_clean file
| Quadrant A | 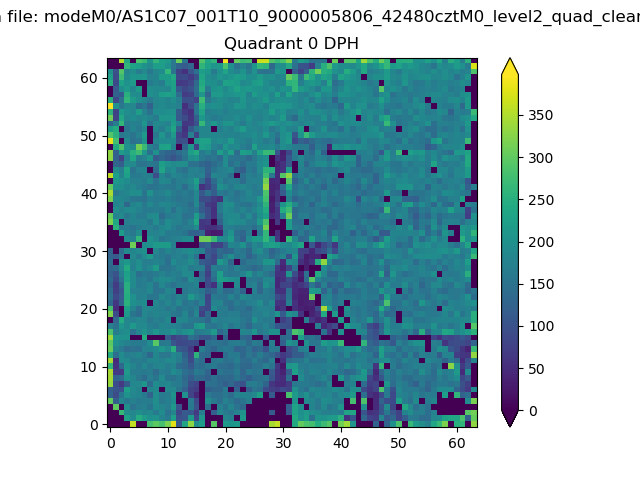 |
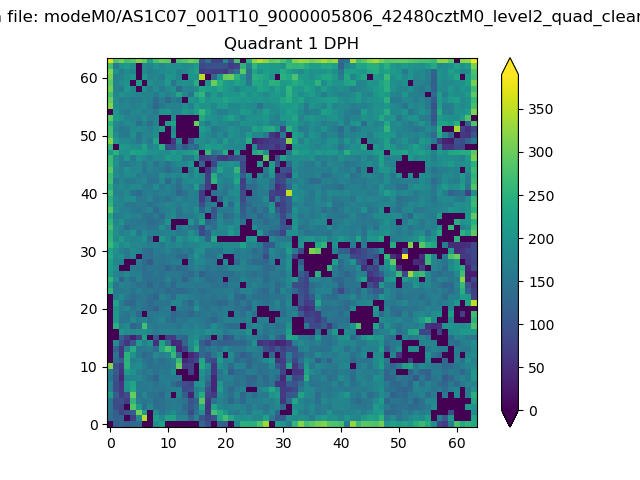 |
Quadrant B |
|---|---|---|---|
| Quadrant D | 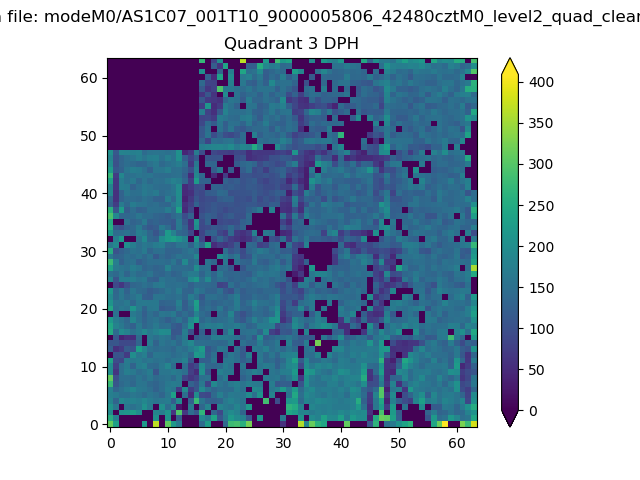 |
 |
Quadrant C |
| Plot type | Count rate plots | Images |
|---|---|---|
| Comparison with Poisson distribution Blue bars denote a histogram of data divided into 1 sec bins. Red curve is a Poisson curve with rate = median count rate of data. |
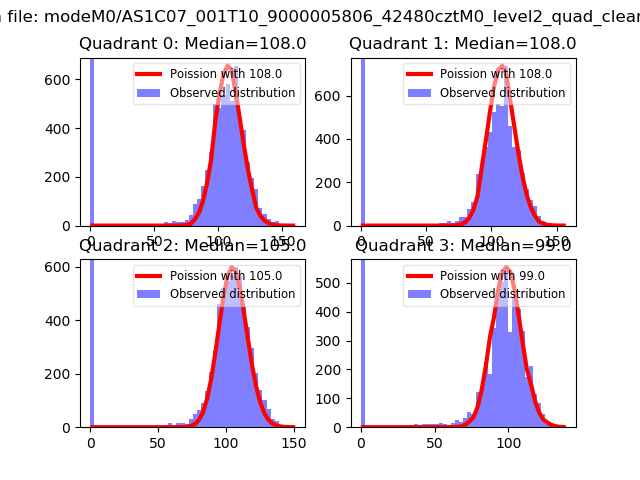 |
 |
| Quadrant-wise count rates Data is divided into 100 sec bins |
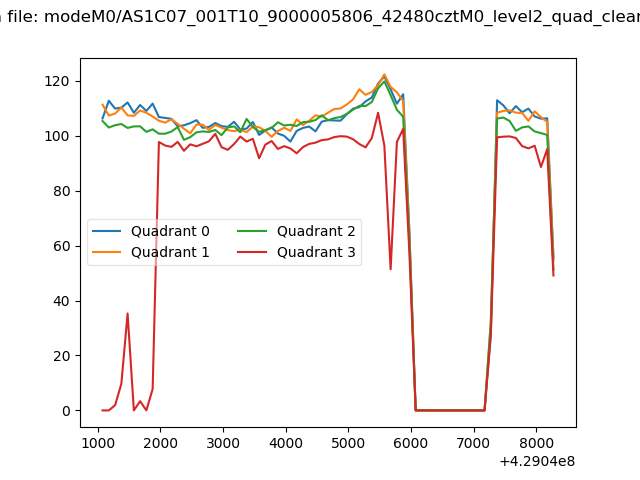 |
|
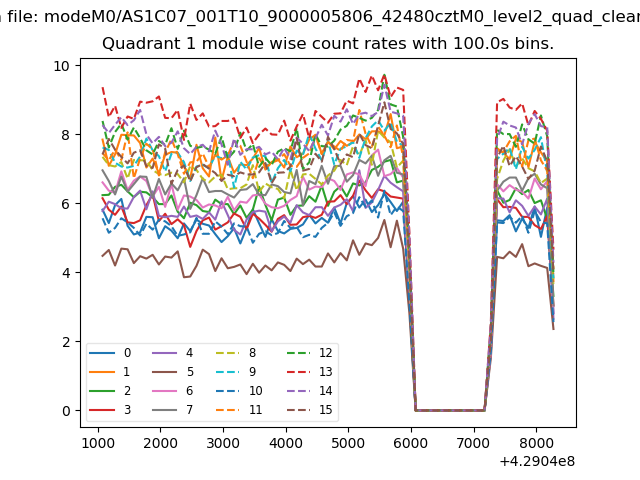
| Module-wise count rates for Quadrant A Data is divided into 100 sec bins |
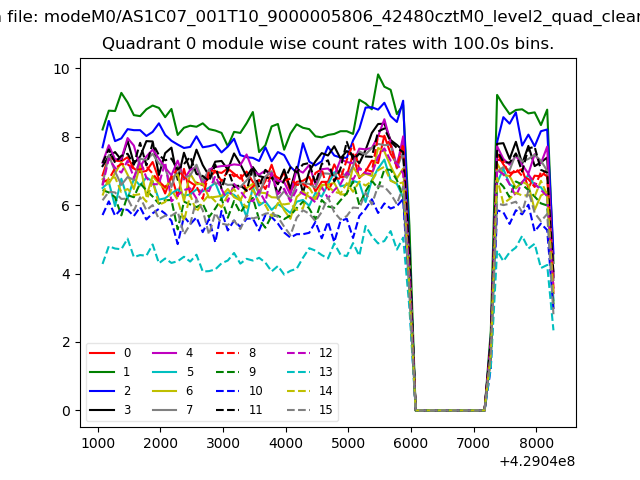 |
 |
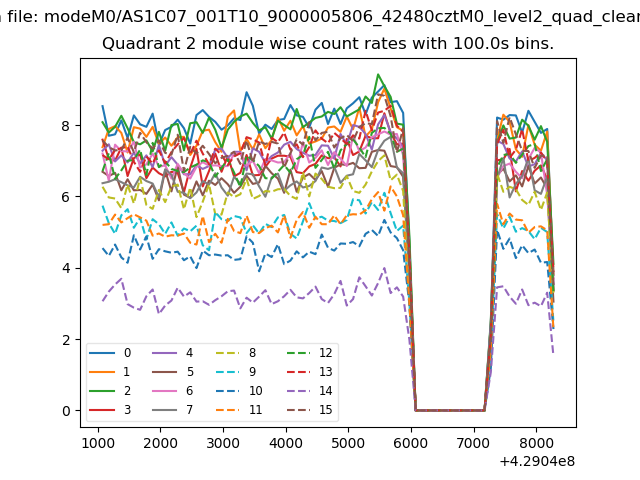
| Module-wise count rates for Quadrant B Data is divided into 100 sec bins |
 |
 |
| Module-wise count rates for Quadrant C Data is divided into 100 sec bins |
 |
 |
| Module-wise count rates for Quadrant D Data is divided into 100 sec bins |
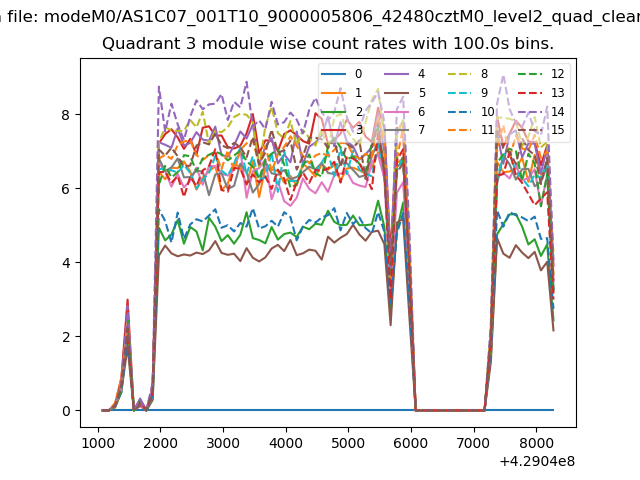 |
 |
| Parameter | Plot |
|---|---|
| CZT HV Monitor | 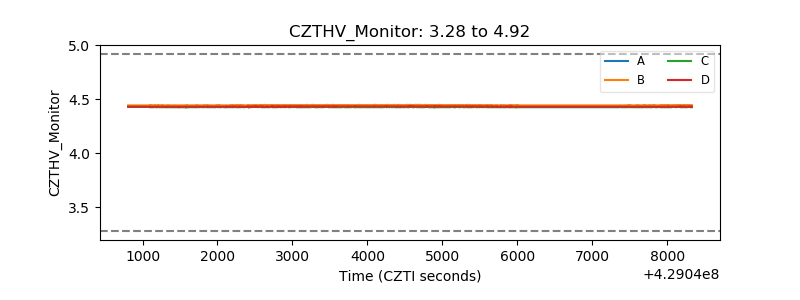 |
| D_VDD | 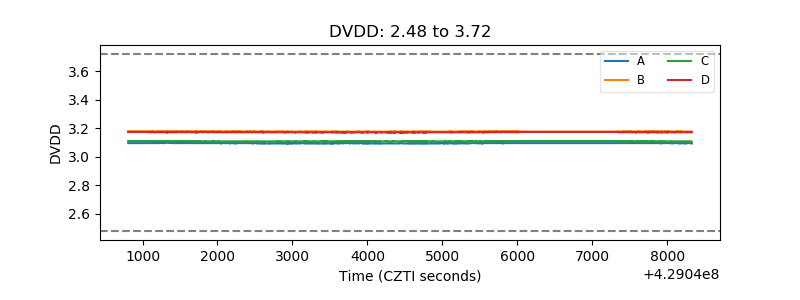 |
| Temperature 1 | 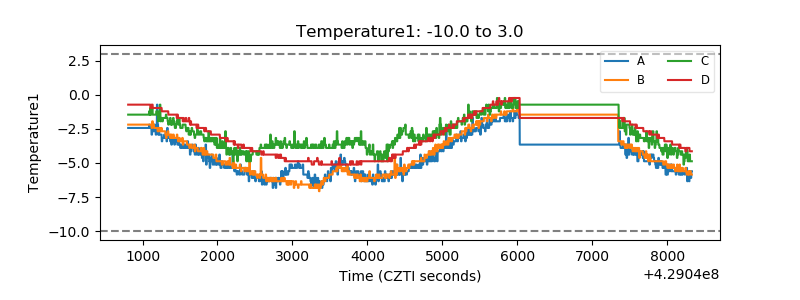 |
| Veto HV Monitor | 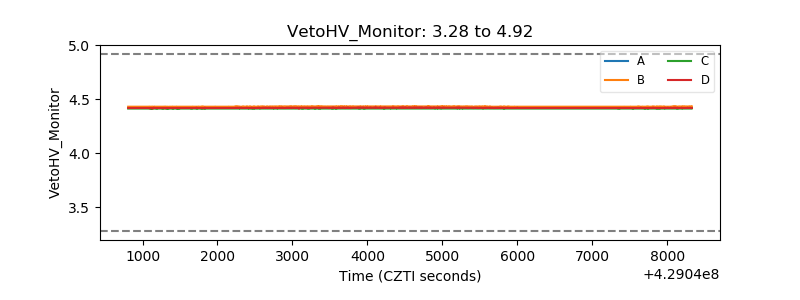 |
| Veto LLD | 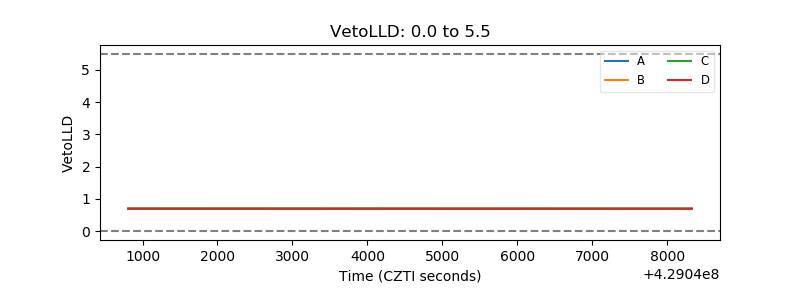 |
| Alpha Counter | 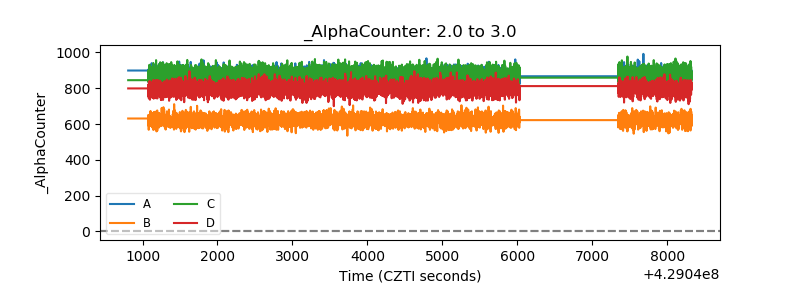 |
| _CPM_Rate | 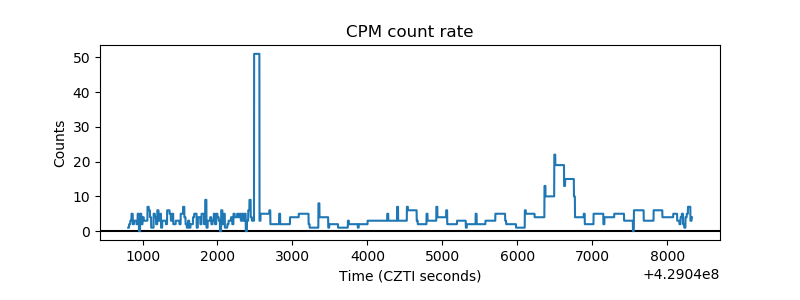 |
| CZT Counter | 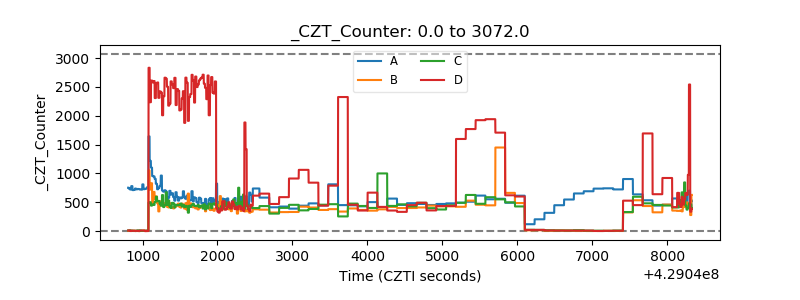 |
| +2.5 Volts monitor | 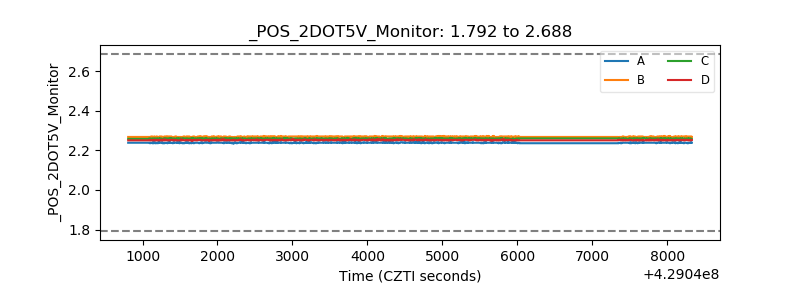 |
| +5 Volts monitor | 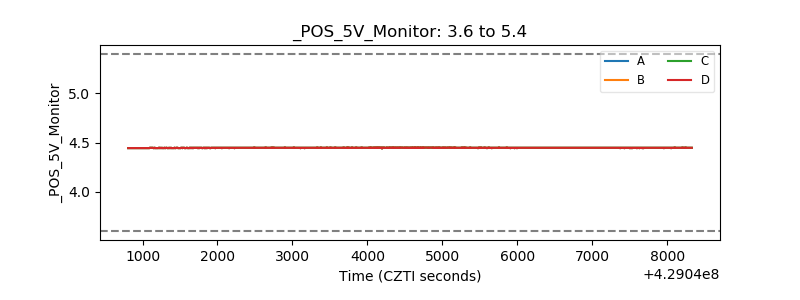 |
| _ROLL_ROT |  |
| _Roll_DEC | 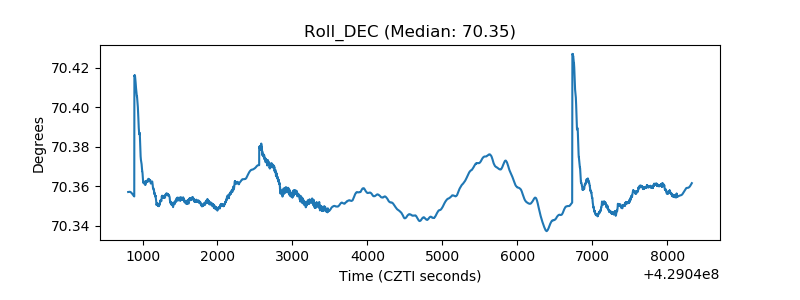 |
| _Roll_RA | 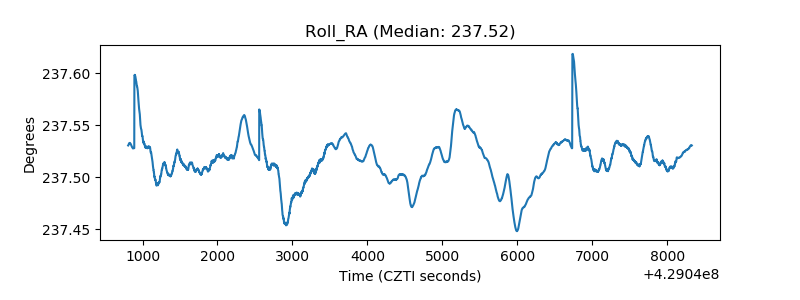 |
| Veto Counter | 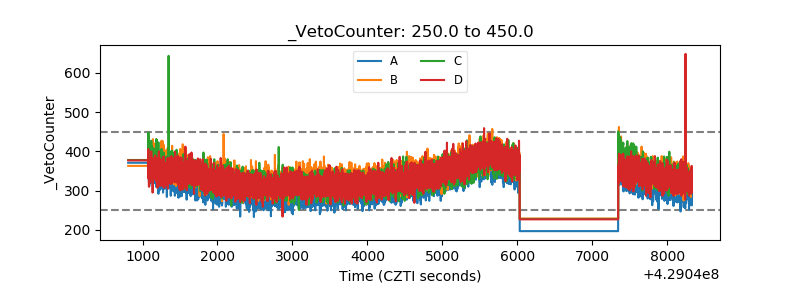 |