| Param | Original file | Final file |
|---|---|---|
| Filename | modeM0/AS1C07_001T10_9000005806_42484cztM0_level2.fits | modeM0/AS1C07_001T10_9000005806_42484cztM0_level2_quad_clean.evt |
| Size (bytes) | 320,880,960 | 90,308,160 |
| Size | 306.0 MB | 86.1 MB |
| Events in quadrant A | 2,997,345 | 598,308 |
| Events in quadrant B | 2,627,943 | 606,122 |
| Events in quadrant C | 2,601,836 | 592,400 |
| Events in quadrant D | 3,211,865 | 543,751 |
| Mode M9 | |||
|---|---|---|---|
| Quadrant | BADHDUFLAG | Total packets | Discarded packets |
| A | 0 | 32 | 0 |
| B | 0 | 32 | 0 |
| C | 0 | 32 | 0 |
| D | 0 | 32 | 0 |
| Mode SS | |||
|---|---|---|---|
| Quadrant | BADHDUFLAG | Total packets | Discarded packets |
| A | 0 | 116 | 0 |
| B | 0 | 116 | 0 |
| C | 0 | 116 | 0 |
| D | 0 | 116 | 0 |
| Mode M0 | |||
|---|---|---|---|
| Quadrant | BADHDUFLAG | Total packets | Discarded packets |
| A | 0 | 12472 | 2 |
| B | 0 | 12055 | 2 |
| C | 0 | 11433 | 2 |
| D | 0 | 13588 | 2 |
| Quadrant | Total seconds | Saturated seconds | Saturation percentage |
|---|---|---|---|
| A | 5631 | 22 | 0.390694% |
| B | 5632 | 57 | 1.012074% |
| C | 5632 | 6 | 0.106534% |
| D | 5632 | 94 | 1.669034% |
Noise dominated data is calculated using 1-second bins in cleaned event files. If a bin has >2000 counts, and if more than 50% of those come from <1% of pixels, then it is considered to be noise-dominated and hence unusable.
| Quadrant | # 1 sec bins | Bins with >0 counts | Bins with >2000 counts | High rate bins dominated by noise | Noise dominated (total time) | Noise dominated (detector-on time) | Marked lightcurve |
|---|---|---|---|---|---|---|---|
| A | 8855 | 5633 | 12 | 12 | 0.14% | 0.21% | 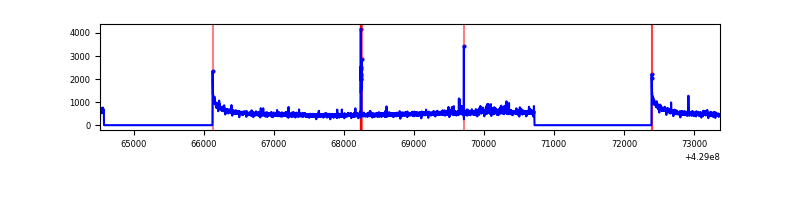 |
| B | 8856 | 5634 | 38 | 38 | 0.43% | 0.67% | 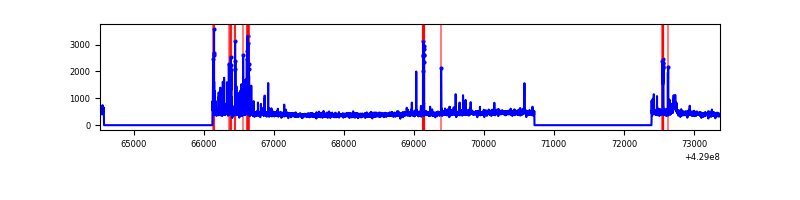 |
| C | 8856 | 5634 | 4 | 4 | 0.05% | 0.07% | 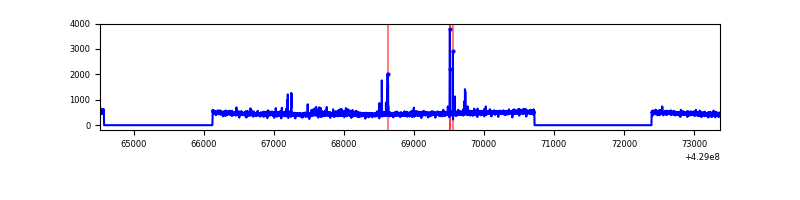 |
| D | 8856 | 5634 | 92 | 92 | 1.04% | 1.63% | 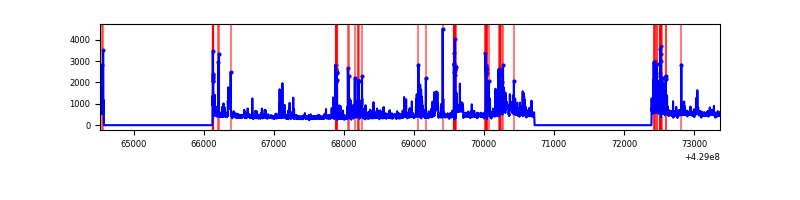 |
Top three noisy pixels from each quadrant. If the there are fewer than three noisy pixels in the level2.evt file, extra rows are filled as -1
| Pixel properties | Quadrant properties | ||||||
|---|---|---|---|---|---|---|---|
| Quadrant | DetID | PixID | Counts | Sigma | Mean | Median | Sigma |
| A | 10 | 83 | 581343 | 4704.19 | 596 | 584 | 123.5 |
| A | 12 | 189 | 65077 | 522.4 | 596 | 584 | 123.5 |
| A | 14 | 235 | 26870 | 212.92 | 596 | 584 | 123.5 |
| B | 5 | 255 | 215075 | 1873.58 | 589 | 574 | 114.5 |
| B | 0 | 229 | 39647 | 341.29 | 589 | 574 | 114.5 |
| B | 5 | 172 | 36206 | 311.23 | 589 | 574 | 114.5 |
| C | 15 | 214 | 234584 | 1723.4 | 581 | 583 | 135.8 |
| C | 14 | 254 | 46443 | 337.76 | 581 | 583 | 135.8 |
| C | 0 | 239 | 33410 | 241.77 | 581 | 583 | 135.8 |
| D | 2 | 16 | 362712 | 2571.5 | 576 | 560 | 140.8 |
| D | 12 | 0 | 97008 | 684.84 | 576 | 560 | 140.8 |
| D | 1 | 52 | 96904 | 684.1 | 576 | 560 | 140.8 |
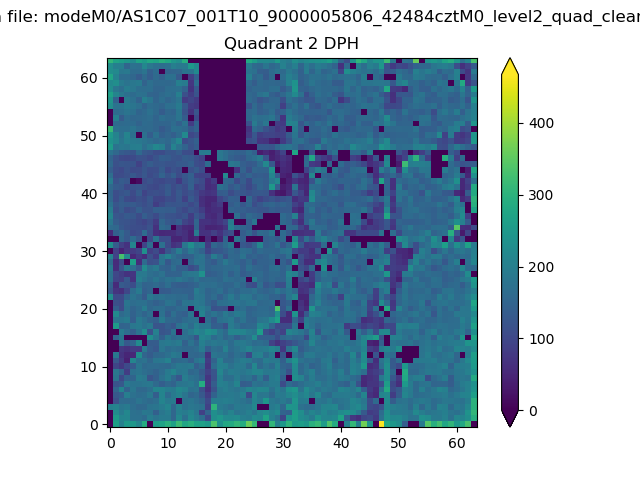
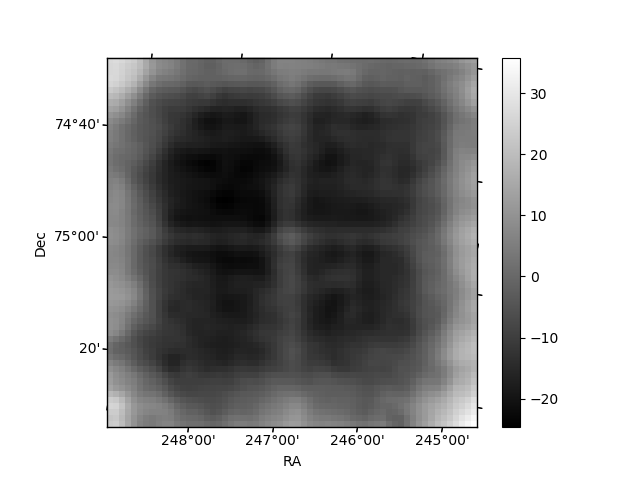
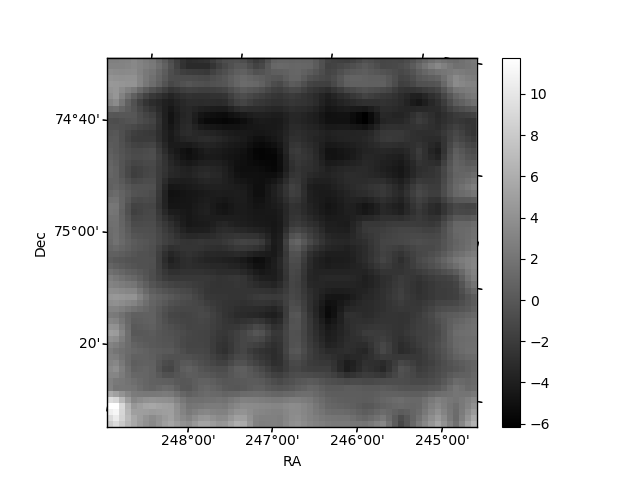
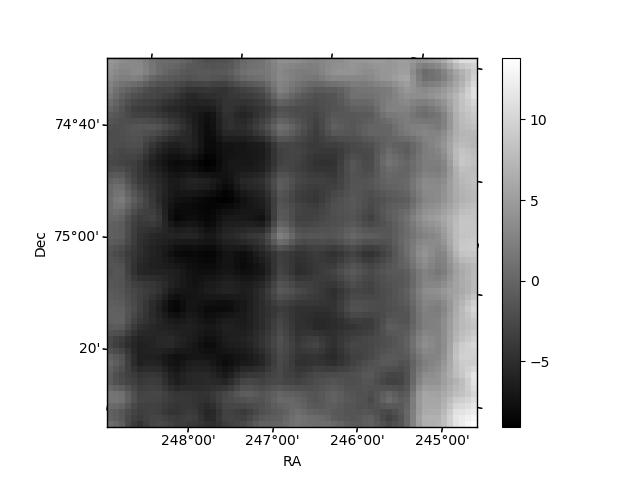
Histogram calculated using DETX and DETY for each event in the final _common_clean file
| Quadrant A | 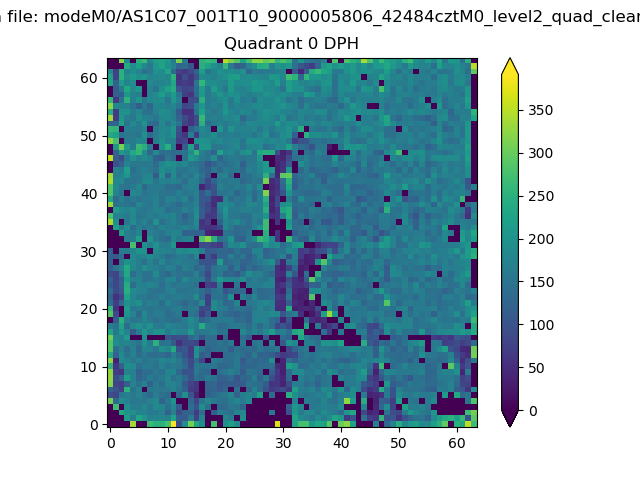 |
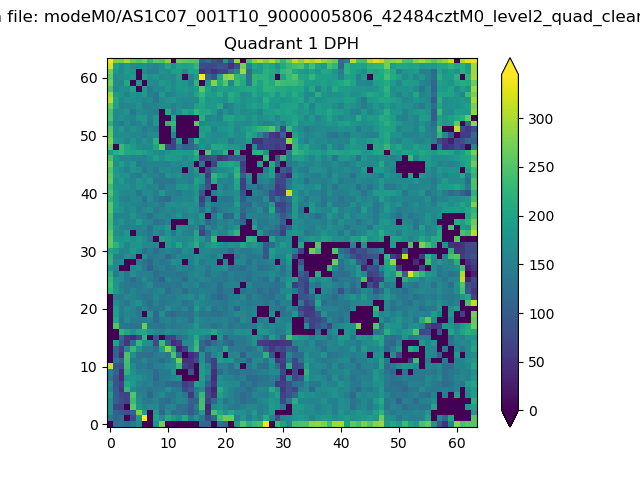 |
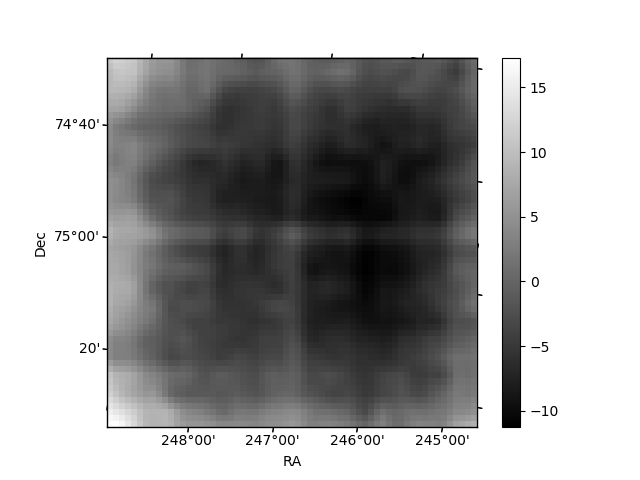
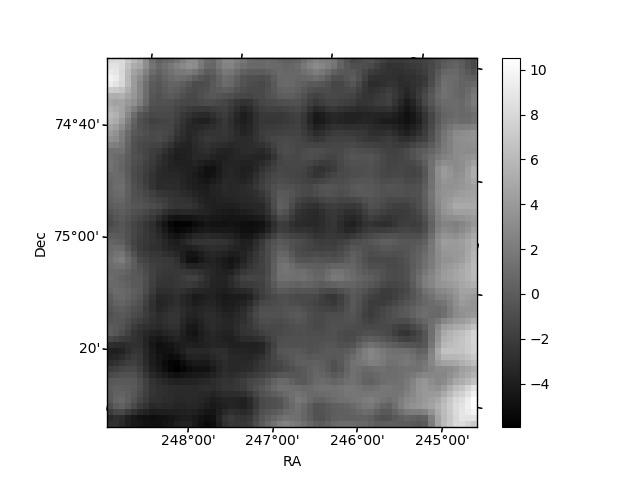
Quadrant B |
|---|---|---|---|
| Quadrant D | 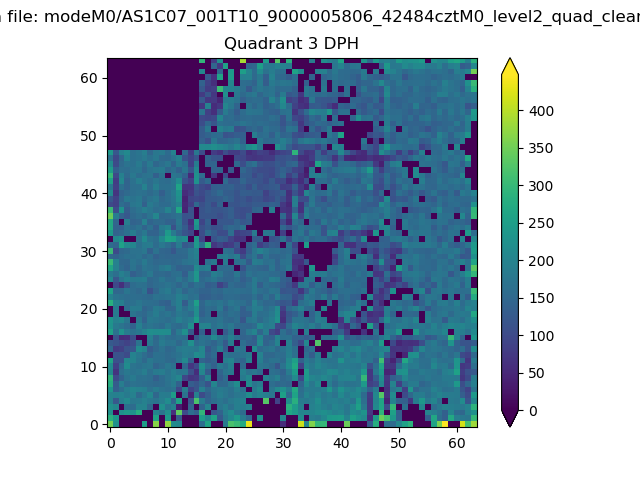 |
 |
Quadrant C |
| Plot type | Count rate plots | Images |
|---|---|---|
| Comparison with Poisson distribution Blue bars denote a histogram of data divided into 1 sec bins. Red curve is a Poisson curve with rate = median count rate of data. |
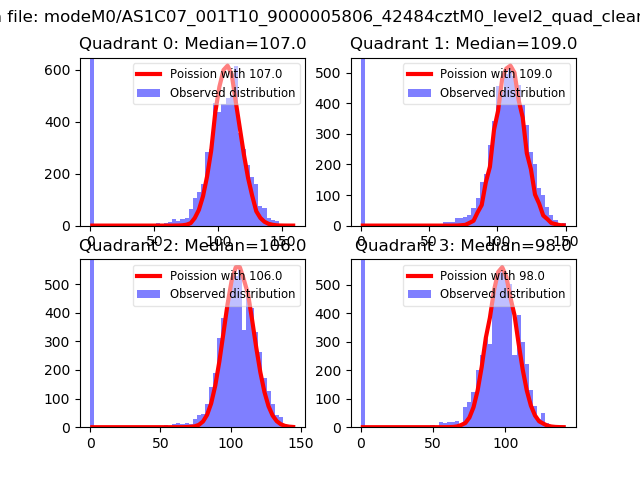 |
 |
| Quadrant-wise count rates Data is divided into 100 sec bins |
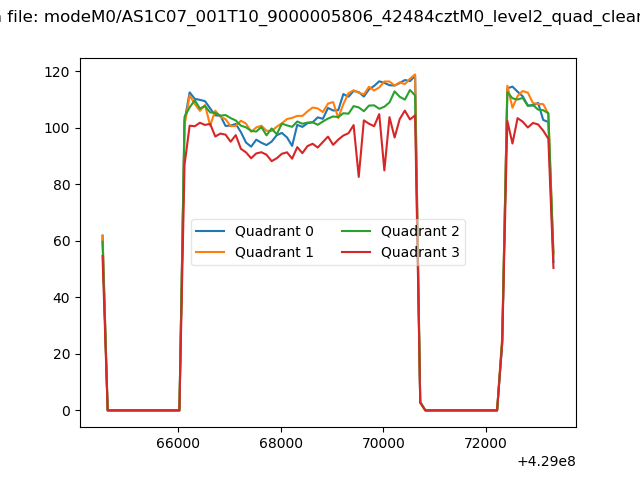 |
|
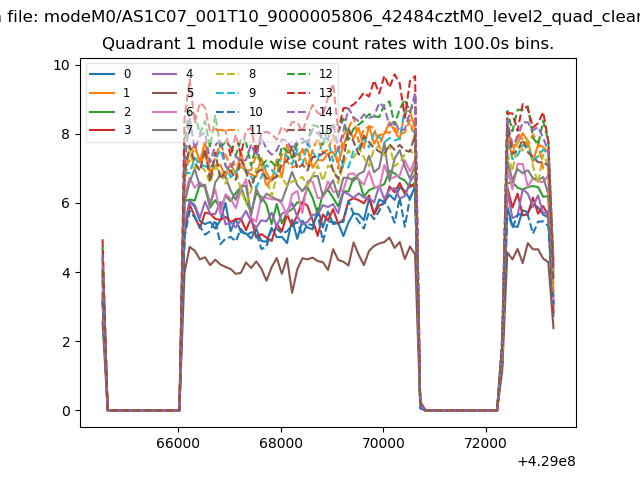
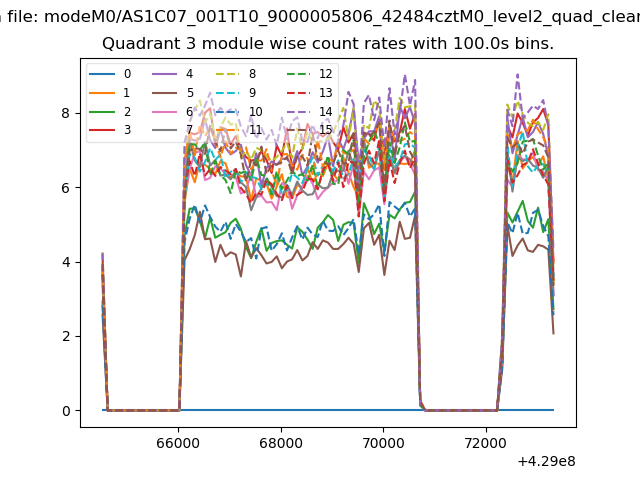
| Module-wise count rates for Quadrant A Data is divided into 100 sec bins |
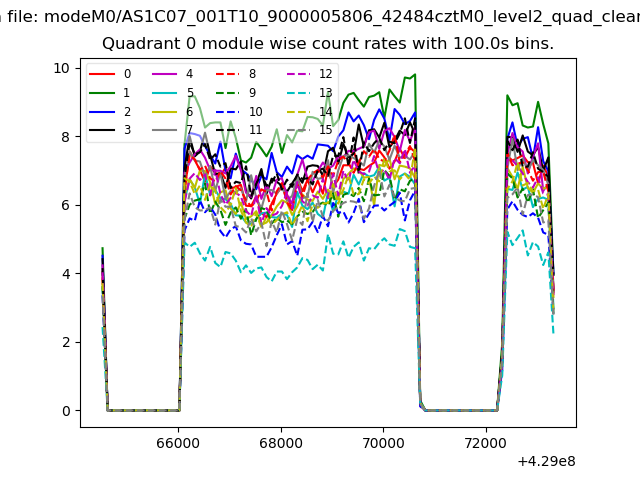 |
 |
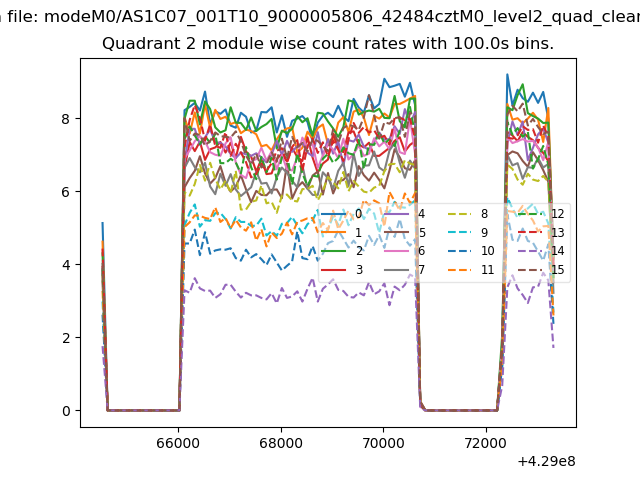
| Module-wise count rates for Quadrant B Data is divided into 100 sec bins |
 |
 |
| Module-wise count rates for Quadrant C Data is divided into 100 sec bins |
 |
 |
| Module-wise count rates for Quadrant D Data is divided into 100 sec bins |
 |
 |
| Parameter | Plot |
|---|---|
| CZT HV Monitor | 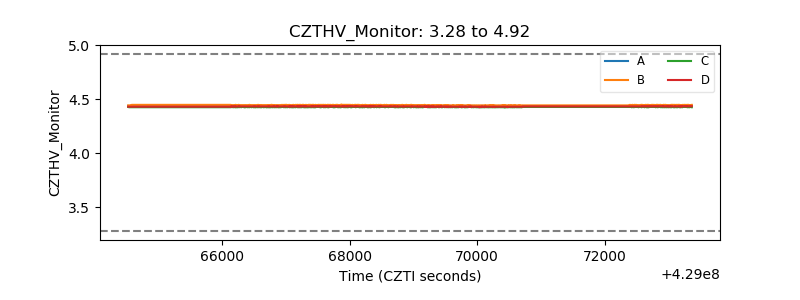 |
| D_VDD | 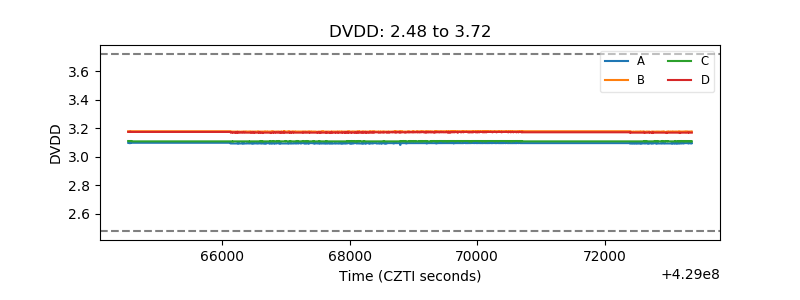 |
| Temperature 1 | 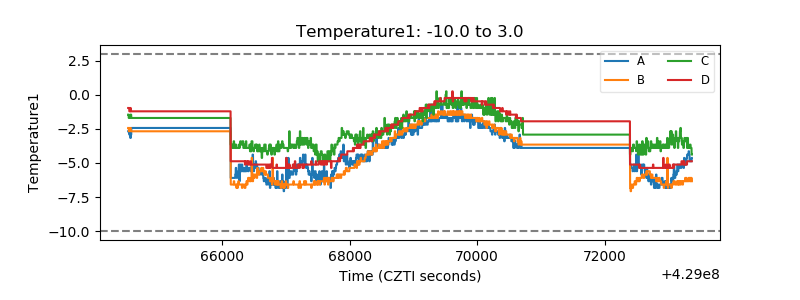 |
| Veto HV Monitor | 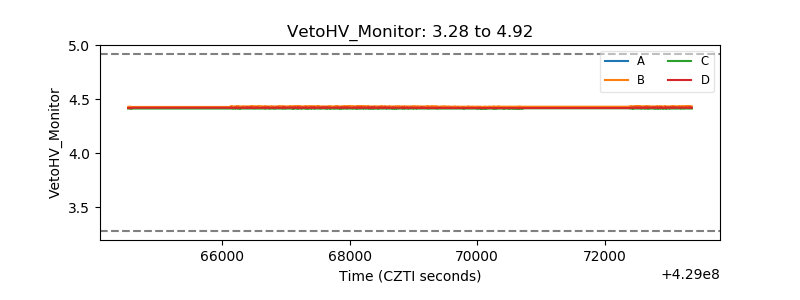 |
| Veto LLD | 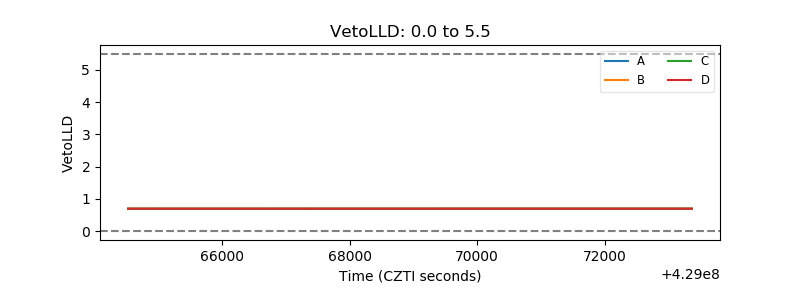 |
| Alpha Counter | 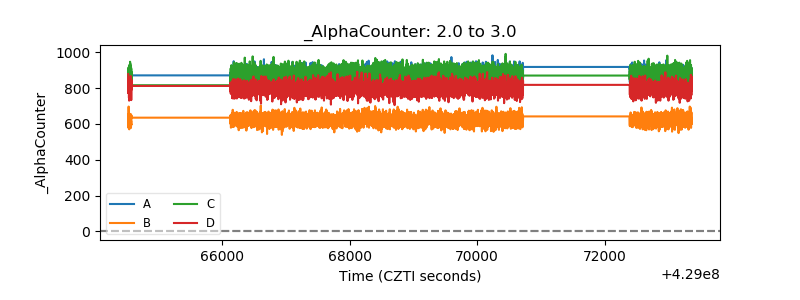 |
| _CPM_Rate | 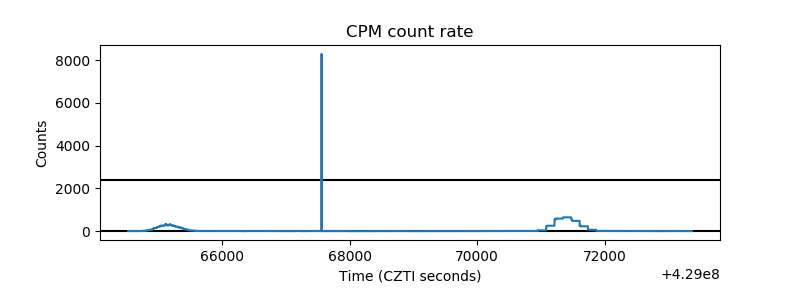 |
| CZT Counter | 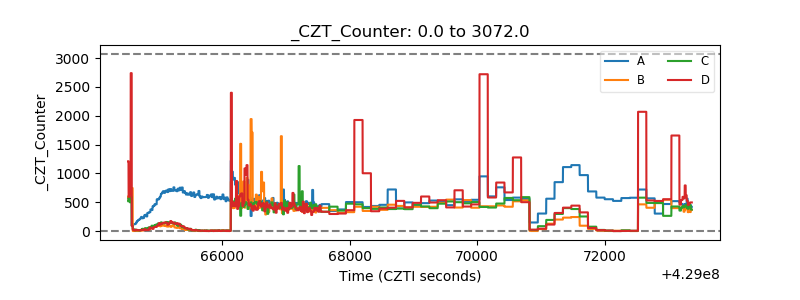 |
| +2.5 Volts monitor | 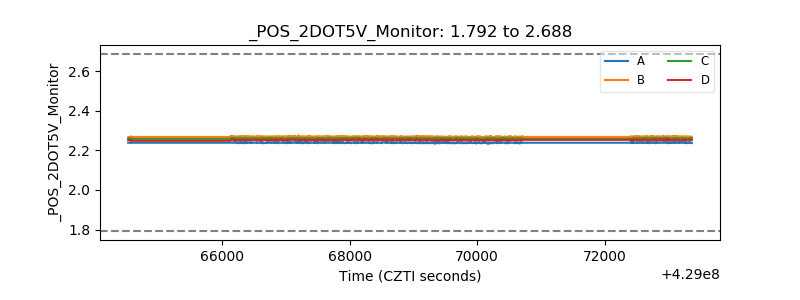 |
| +5 Volts monitor | 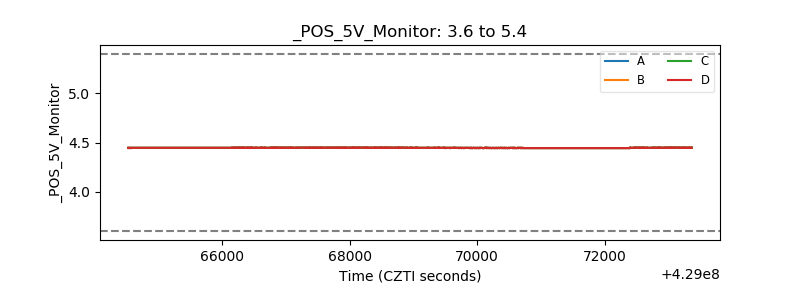 |
| _ROLL_ROT | 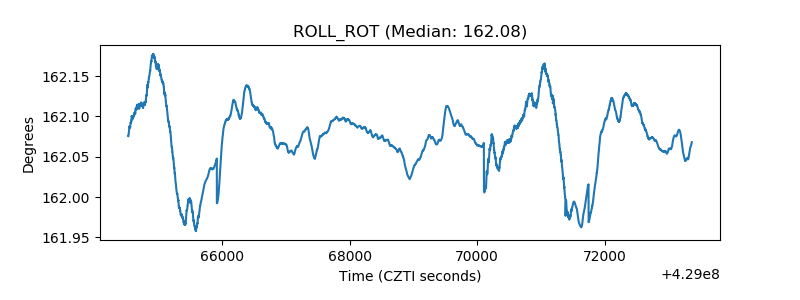 |
| _Roll_DEC | 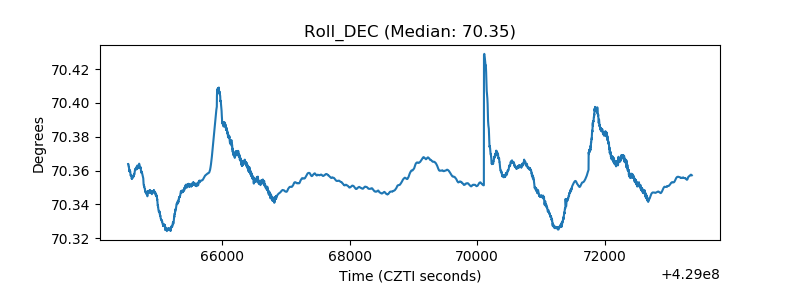 |
| _Roll_RA | 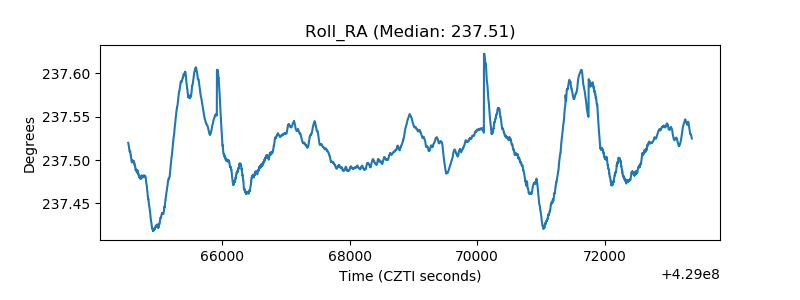 |
| Veto Counter | 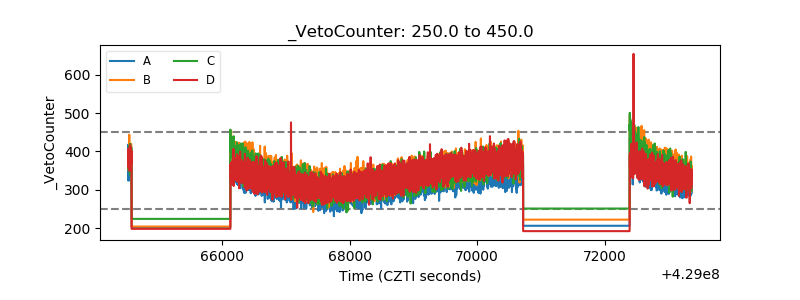 |