| Param | Original file | Final file |
|---|---|---|
| Filename | modeM0/AS1C07_001T10_9000005806_42486cztM0_level2.fits | modeM0/AS1C07_001T10_9000005806_42486cztM0_level2_quad_clean.evt |
| Size (bytes) | 1,486,416,960 | 378,535,680 |
| Size | 1.4 GB | 361.0 MB |
| Events in quadrant A | 12,536,725 | 2,556,247 |
| Events in quadrant B | 11,912,725 | 2,560,725 |
| Events in quadrant C | 11,062,589 | 2,518,345 |
| Events in quadrant D | 17,657,364 | 2,178,678 |
| Mode M9 | |||
|---|---|---|---|
| Quadrant | BADHDUFLAG | Total packets | Discarded packets |
| A | 0 | 78 | 0 |
| B | 0 | 78 | 0 |
| C | 0 | 78 | 0 |
| D | 0 | 78 | 0 |
| Mode SS | |||
|---|---|---|---|
| Quadrant | BADHDUFLAG | Total packets | Discarded packets |
| A | 0 | 488 | 0 |
| B | 0 | 488 | 0 |
| C | 0 | 488 | 0 |
| D | 0 | 488 | 0 |
| Mode M0 | |||
|---|---|---|---|
| Quadrant | BADHDUFLAG | Total packets | Discarded packets |
| A | 0 | 52328 | 6 |
| B | 0 | 53183 | 5 |
| C | 0 | 48905 | 5 |
| D | 0 | 69895 | 5 |
| Quadrant | Total seconds | Saturated seconds | Saturation percentage |
|---|---|---|---|
| A | 23936 | 48 | 0.200535% |
| B | 23937 | 388 | 1.620922% |
| C | 23937 | 36 | 0.150395% |
| D | 23937 | 2063 | 8.618457% |
Noise dominated data is calculated using 1-second bins in cleaned event files. If a bin has >2000 counts, and if more than 50% of those come from <1% of pixels, then it is considered to be noise-dominated and hence unusable.
| Quadrant | # 1 sec bins | Bins with >0 counts | Bins with >2000 counts | High rate bins dominated by noise | Noise dominated (total time) | Noise dominated (detector-on time) | Marked lightcurve |
|---|---|---|---|---|---|---|---|
| A | 31730 | 23941 | 22 | 22 | 0.07% | 0.09% | 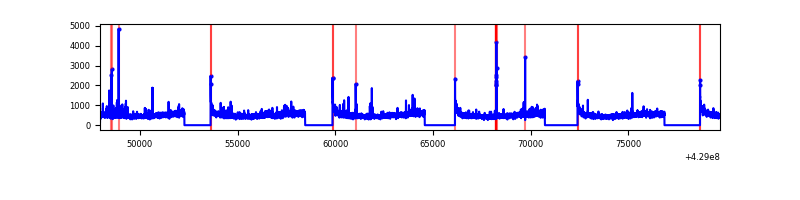 |
| B | 31731 | 23942 | 265 | 265 | 0.84% | 1.11% | 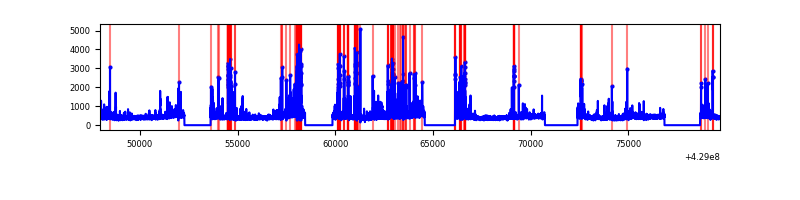 |
| C | 31731 | 23942 | 21 | 21 | 0.07% | 0.09% | 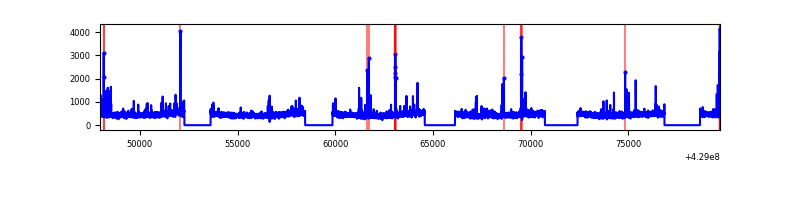 |
| D | 31731 | 23942 | 1940 | 1940 | 6.11% | 8.10% | 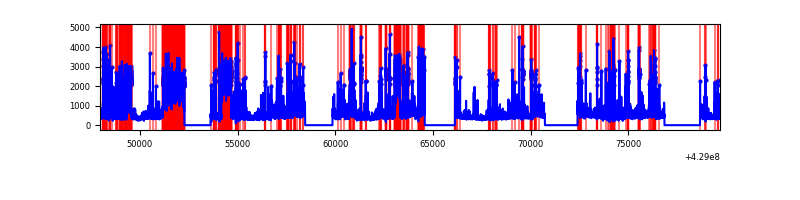 |
Top three noisy pixels from each quadrant. If the there are fewer than three noisy pixels in the level2.evt file, extra rows are filled as -1
| Pixel properties | Quadrant properties | ||||||
|---|---|---|---|---|---|---|---|
| Quadrant | DetID | PixID | Counts | Sigma | Mean | Median | Sigma |
| A | 10 | 83 | 2143192 | 4142.57 | 2540 | 2488 | 516.8 |
| A | 12 | 189 | 346806 | 666.3 | 2540 | 2488 | 516.8 |
| A | 14 | 235 | 89009 | 167.43 | 2540 | 2488 | 516.8 |
| B | 5 | 255 | 835172 | 1763.46 | 2489 | 2417 | 472.2 |
| B | 0 | 245 | 554833 | 1169.81 | 2489 | 2417 | 472.2 |
| B | 5 | 172 | 508122 | 1070.89 | 2489 | 2417 | 472.2 |
| C | 15 | 214 | 976041 | 1714.88 | 2462 | 2477 | 567.7 |
| C | 14 | 254 | 280779 | 490.21 | 2462 | 2477 | 567.7 |
| C | 9 | 54 | 75972 | 129.46 | 2462 | 2477 | 567.7 |
| D | 2 | 16 | 4769019 | 8179.37 | 2410 | 2343 | 582.8 |
| D | 1 | 52 | 691769 | 1183.02 | 2410 | 2343 | 582.8 |
| D | 12 | 0 | 661369 | 1130.85 | 2410 | 2343 | 582.8 |
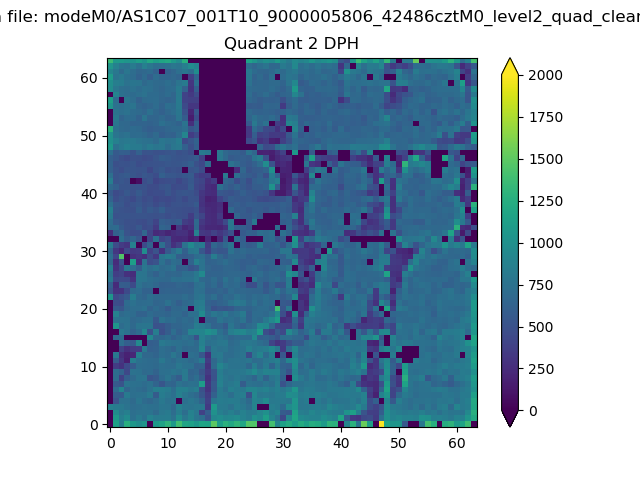
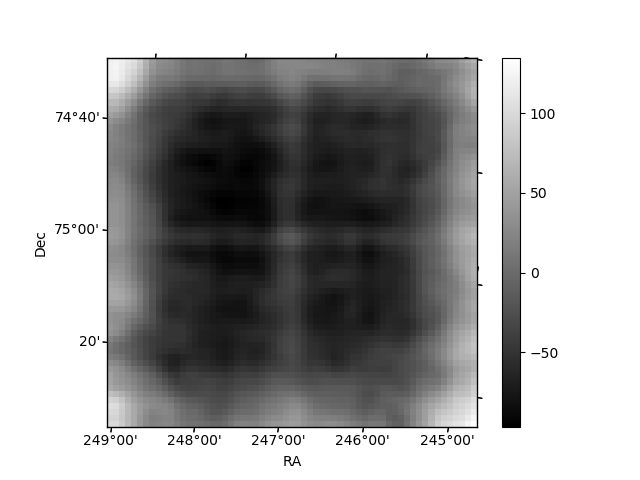
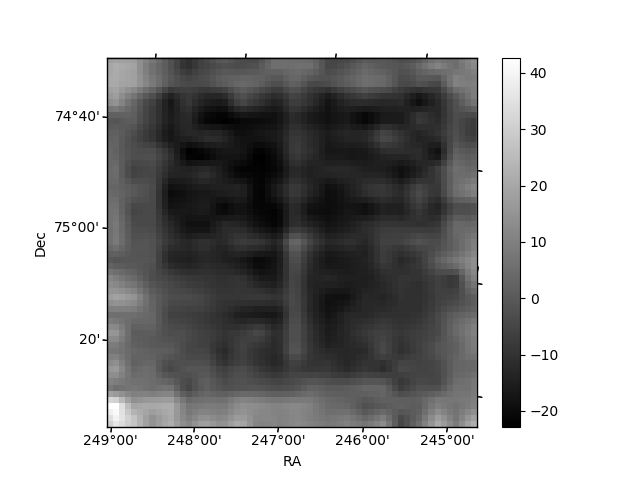
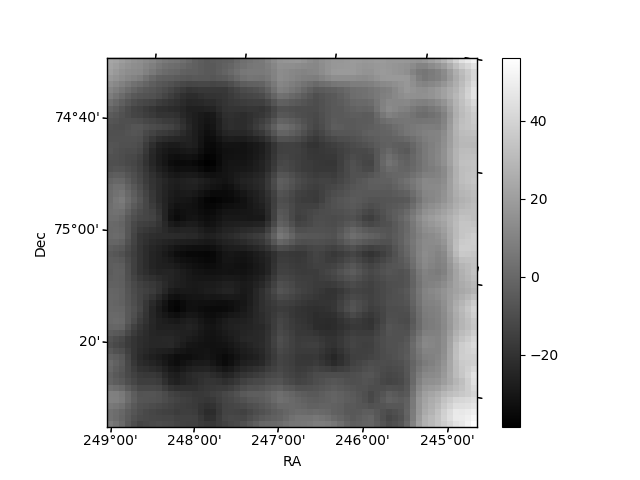
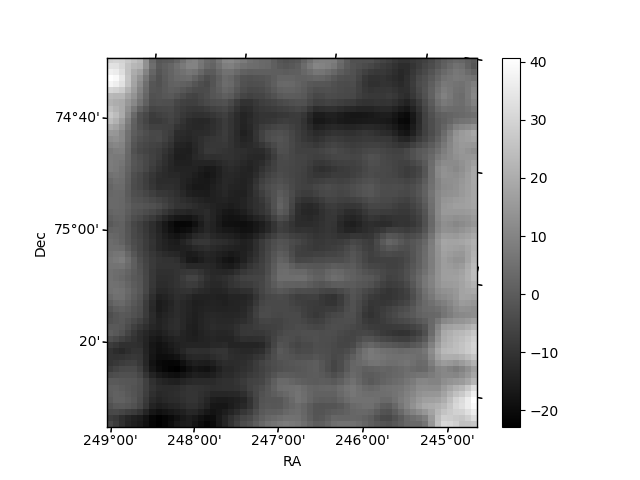
Histogram calculated using DETX and DETY for each event in the final _common_clean file
| Quadrant A | 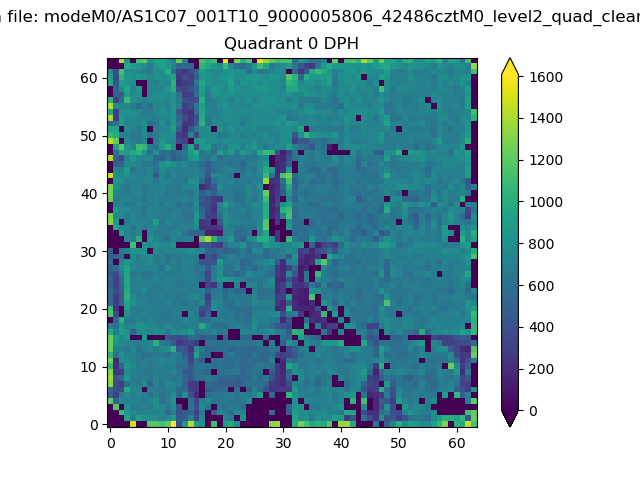 |
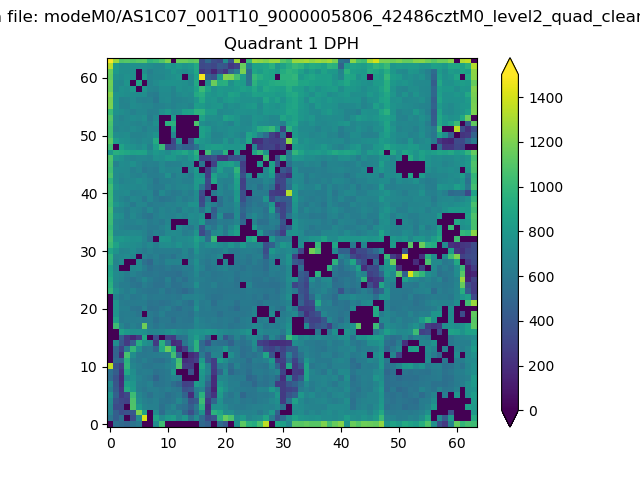 |
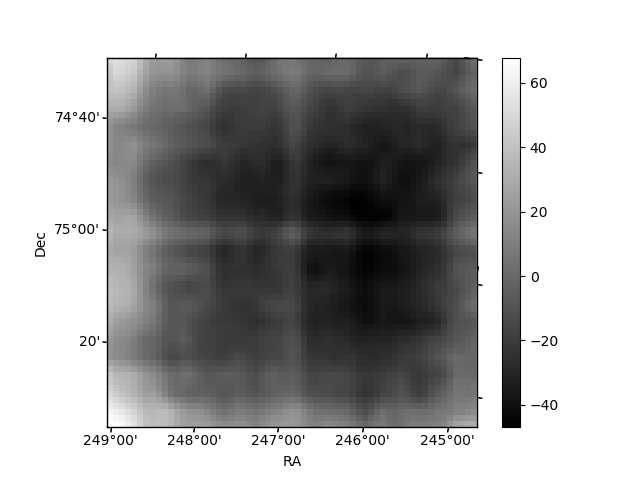
Quadrant B |
|---|---|---|---|
| Quadrant D | 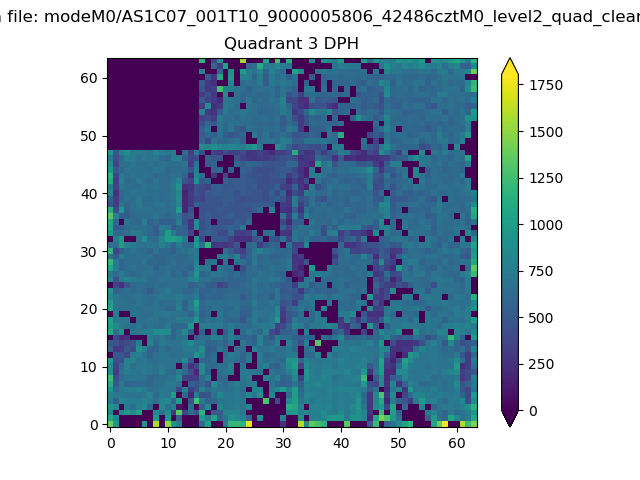 |
 |
Quadrant C |
| Plot type | Count rate plots | Images |
|---|---|---|
| Comparison with Poisson distribution Blue bars denote a histogram of data divided into 1 sec bins. Red curve is a Poisson curve with rate = median count rate of data. |
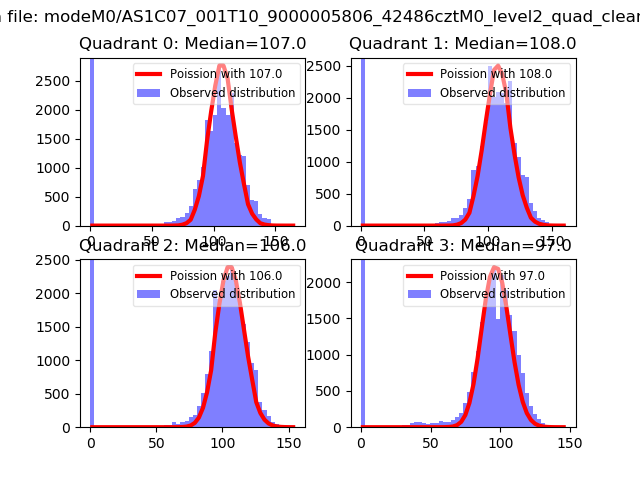 |
 |
| Quadrant-wise count rates Data is divided into 100 sec bins |
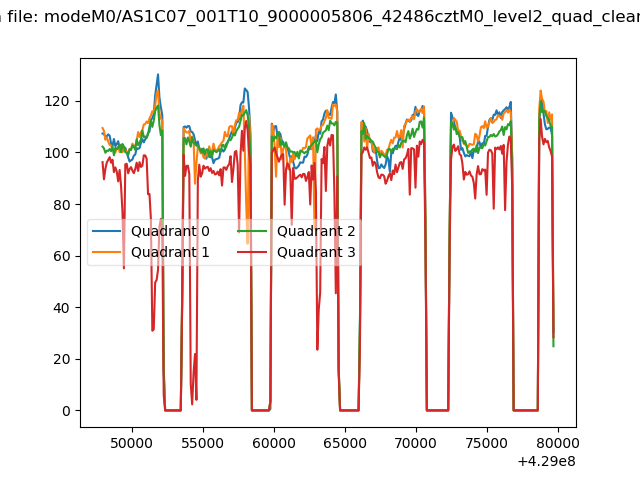 |
|
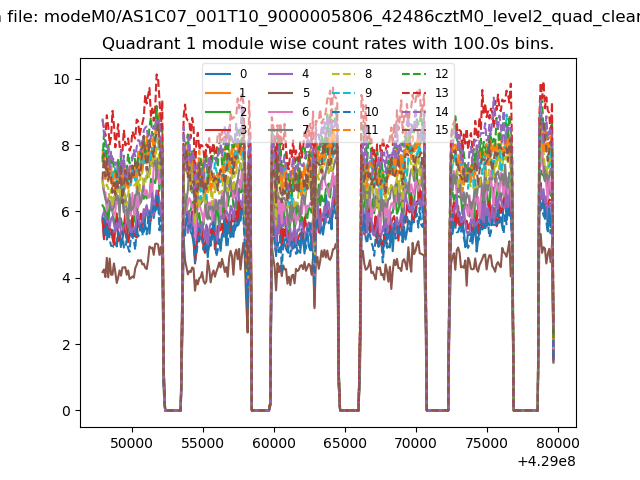
| Module-wise count rates for Quadrant A Data is divided into 100 sec bins |
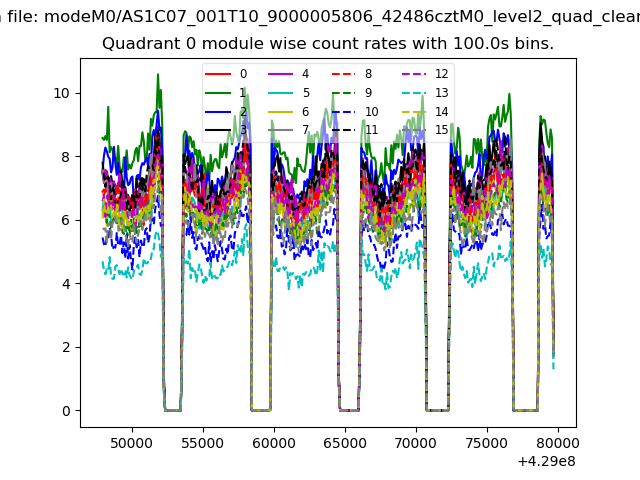 |
 |
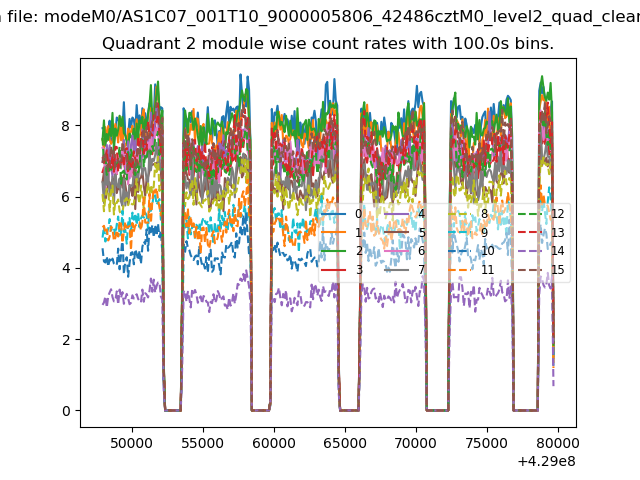
| Module-wise count rates for Quadrant B Data is divided into 100 sec bins |
 |
 |
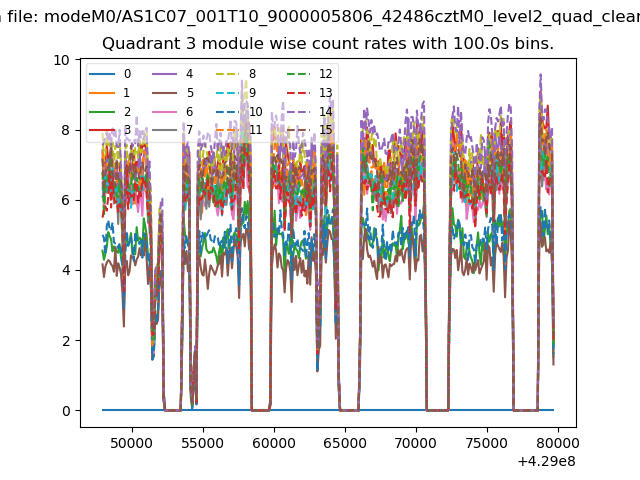
| Module-wise count rates for Quadrant C Data is divided into 100 sec bins |
 |
 |
| Module-wise count rates for Quadrant D Data is divided into 100 sec bins |
 |
 |
| Parameter | Plot |
|---|---|
| CZT HV Monitor | 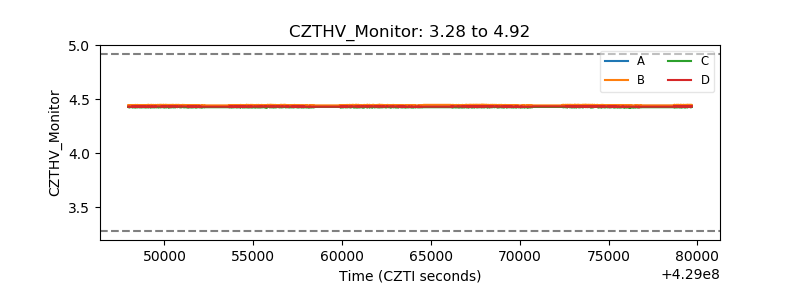 |
| D_VDD |  |
| Temperature 1 | 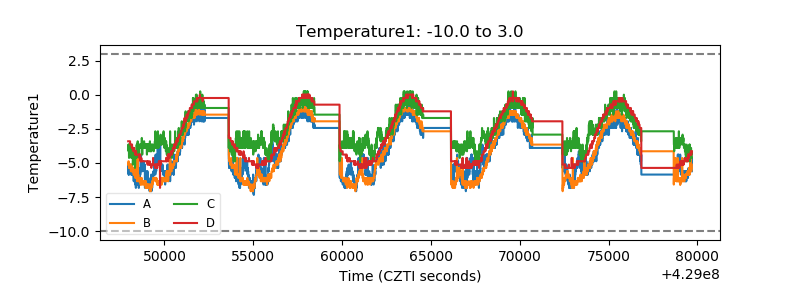 |
| Veto HV Monitor | 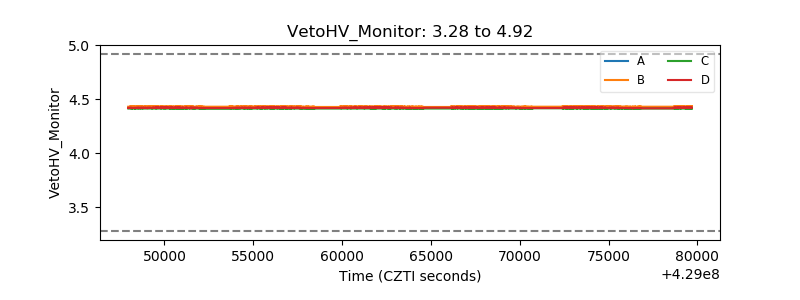 |
| Veto LLD | 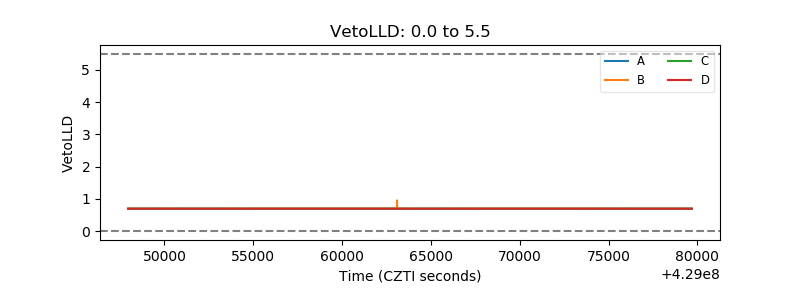 |
| Alpha Counter | 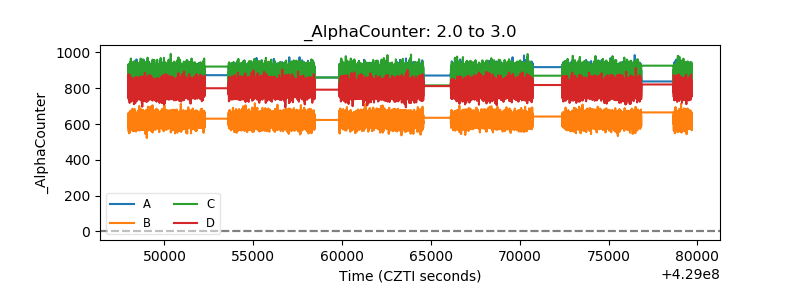 |
| _CPM_Rate | 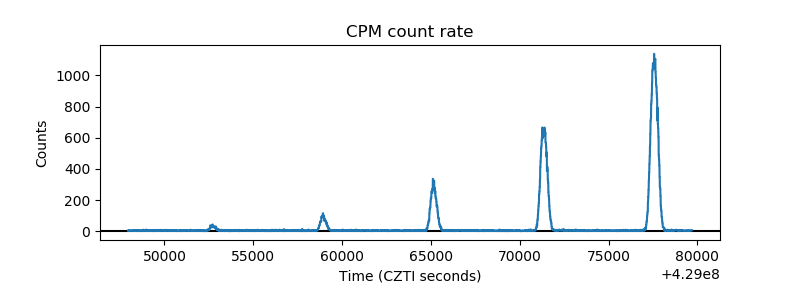 |
| CZT Counter | 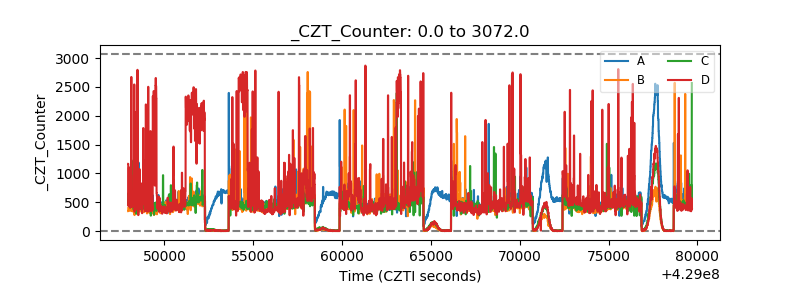 |
| +2.5 Volts monitor | 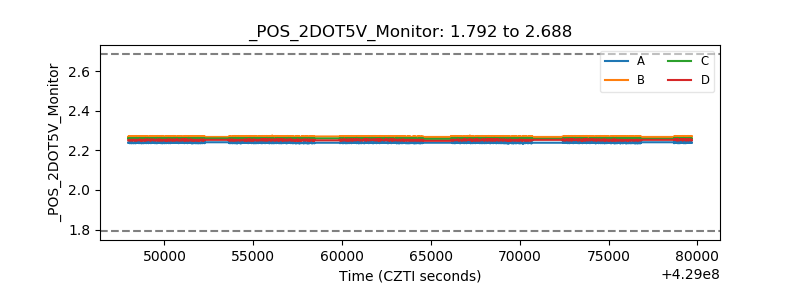 |
| +5 Volts monitor | 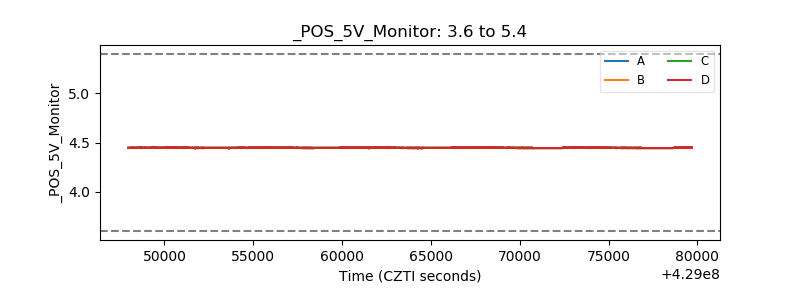 |
| _ROLL_ROT | 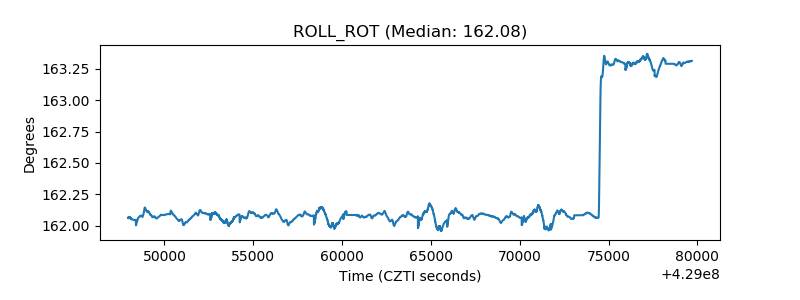 |
| _Roll_DEC | 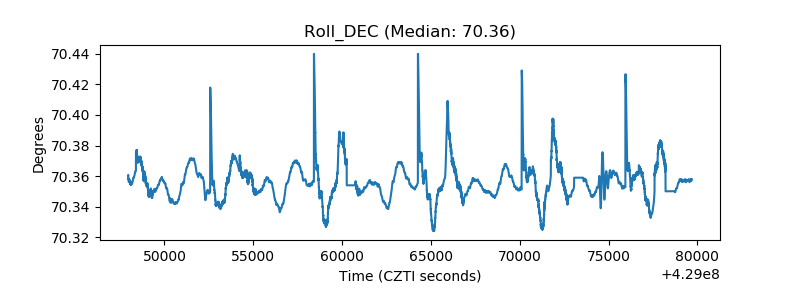 |
| _Roll_RA | 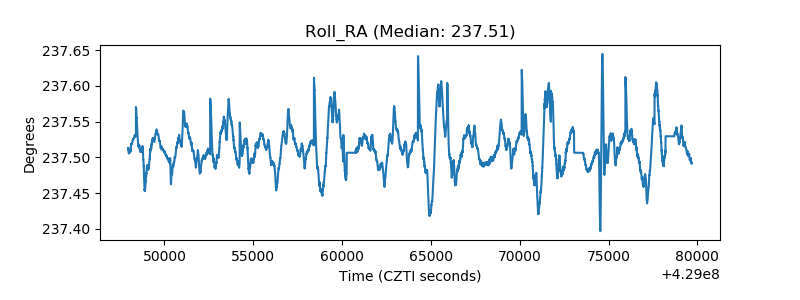 |
| Veto Counter | 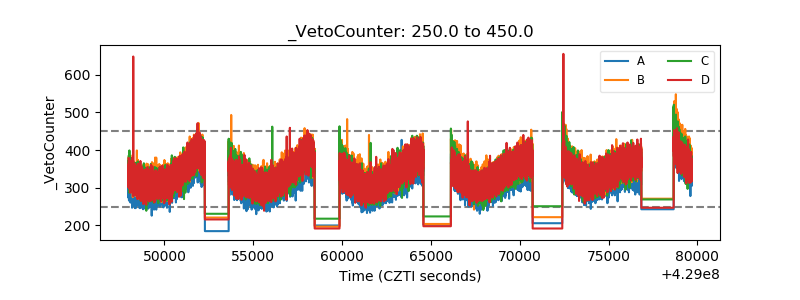 |