| Param | Original file | Final file |
|---|---|---|
| Filename | modeM0/AS1C07_001T10_9000005806_42487cztM0_level2.fits | modeM0/AS1C07_001T10_9000005806_42487cztM0_level2_quad_clean.evt |
| Size (bytes) | 318,081,600 | 86,008,320 |
| Size | 303.3 MB | 82.0 MB |
| Events in quadrant A | 2,790,339 | 587,290 |
| Events in quadrant B | 3,330,311 | 565,833 |
| Events in quadrant C | 2,411,027 | 569,820 |
| Events in quadrant D | 2,842,952 | 521,889 |
| Mode M9 | |||
|---|---|---|---|
| Quadrant | BADHDUFLAG | Total packets | Discarded packets |
| A | 0 | 19 | 0 |
| B | 0 | 19 | 0 |
| C | 0 | 19 | 0 |
| D | 0 | 19 | 0 |
| Mode SS | |||
|---|---|---|---|
| Quadrant | BADHDUFLAG | Total packets | Discarded packets |
| A | 0 | 106 | 0 |
| B | 0 | 106 | 0 |
| C | 0 | 106 | 0 |
| D | 0 | 106 | 0 |
| Mode M0 | |||
|---|---|---|---|
| Quadrant | BADHDUFLAG | Total packets | Discarded packets |
| A | 0 | 11277 | 2 |
| B | 0 | 13490 | 3 |
| C | 0 | 10428 | 2 |
| D | 0 | 12116 | 2 |
| Quadrant | Total seconds | Saturated seconds | Saturation percentage |
|---|---|---|---|
| A | 5127 | 8 | 0.156037% |
| B | 5127 | 342 | 6.670568% |
| C | 5127 | 10 | 0.195046% |
| D | 5127 | 123 | 2.399064% |
Noise dominated data is calculated using 1-second bins in cleaned event files. If a bin has >2000 counts, and if more than 50% of those come from <1% of pixels, then it is considered to be noise-dominated and hence unusable.
| Quadrant | # 1 sec bins | Bins with >0 counts | Bins with >2000 counts | High rate bins dominated by noise | Noise dominated (total time) | Noise dominated (detector-on time) | Marked lightcurve |
|---|---|---|---|---|---|---|---|
| A | 7040 | 5128 | 1 | 1 | 0.01% | 0.02% | 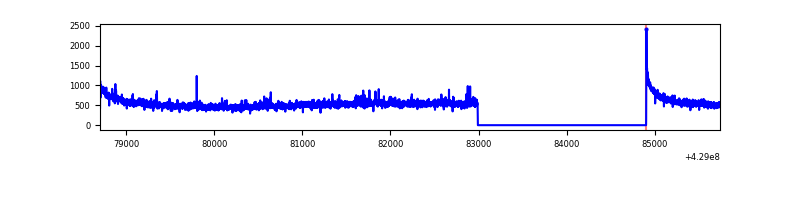 |
| B | 7040 | 5128 | 228 | 228 | 3.24% | 4.45% | 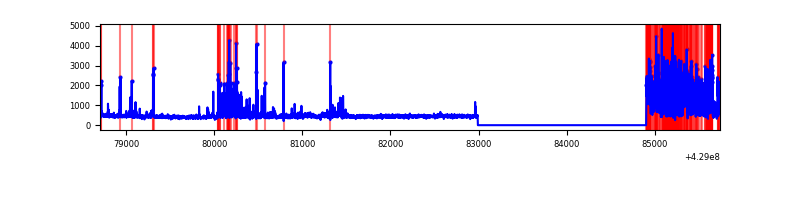 |
| C | 7040 | 5128 | 6 | 6 | 0.09% | 0.12% | 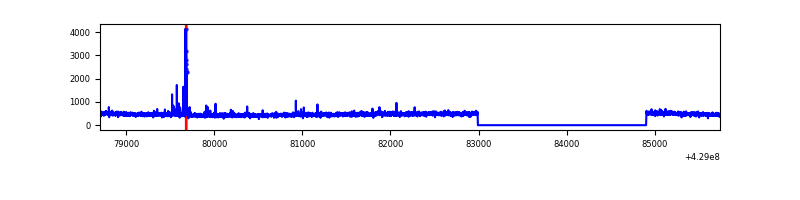 |
| D | 7040 | 5128 | 95 | 95 | 1.35% | 1.85% | 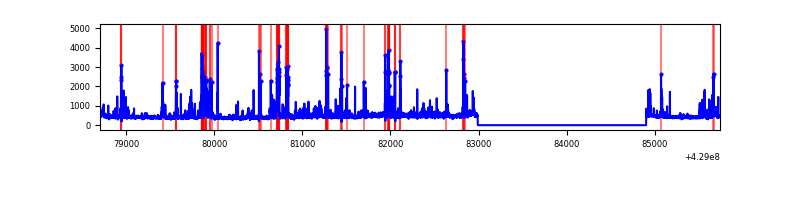 |
Top three noisy pixels from each quadrant. If the there are fewer than three noisy pixels in the level2.evt file, extra rows are filled as -1
| Pixel properties | Quadrant properties | ||||||
|---|---|---|---|---|---|---|---|
| Quadrant | DetID | PixID | Counts | Sigma | Mean | Median | Sigma |
| A | 10 | 83 | 523490 | 4542.96 | 566 | 556 | 115.1 |
| A | 12 | 189 | 60458 | 520.39 | 566 | 556 | 115.1 |
| A | 13 | 6 | 15823 | 132.63 | 566 | 556 | 115.1 |
| B | 5 | 255 | 1086779 | 10408.07 | 545 | 530 | 104.4 |
| B | 0 | 229 | 38417 | 363.02 | 545 | 530 | 104.4 |
| B | 5 | 172 | 26934 | 252.99 | 545 | 530 | 104.4 |
| C | 15 | 214 | 218983 | 1728.14 | 543 | 545 | 126.4 |
| C | 14 | 254 | 52602 | 411.84 | 543 | 545 | 126.4 |
| C | 9 | 54 | 7463 | 54.73 | 543 | 545 | 126.4 |
| D | 2 | 249 | 174519 | 1325.5 | 542 | 528 | 131.3 |
| D | 12 | 6 | 161658 | 1227.52 | 542 | 528 | 131.3 |
| D | 1 | 47 | 68191 | 515.47 | 542 | 528 | 131.3 |
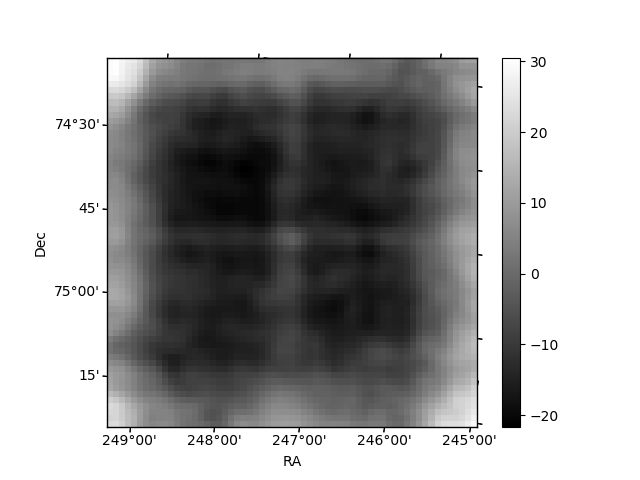
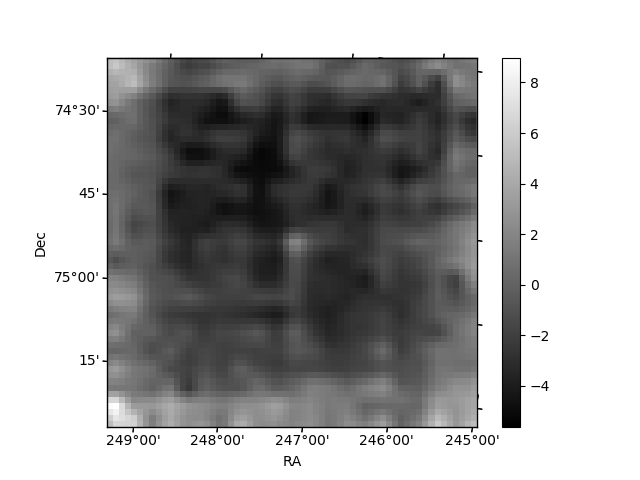
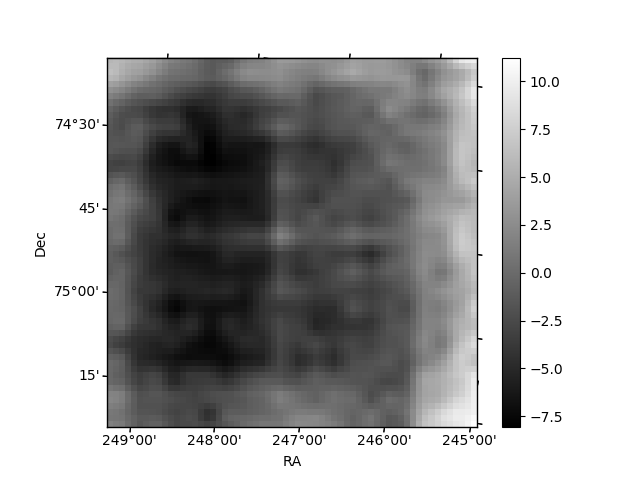
Histogram calculated using DETX and DETY for each event in the final _common_clean file
| Quadrant A | 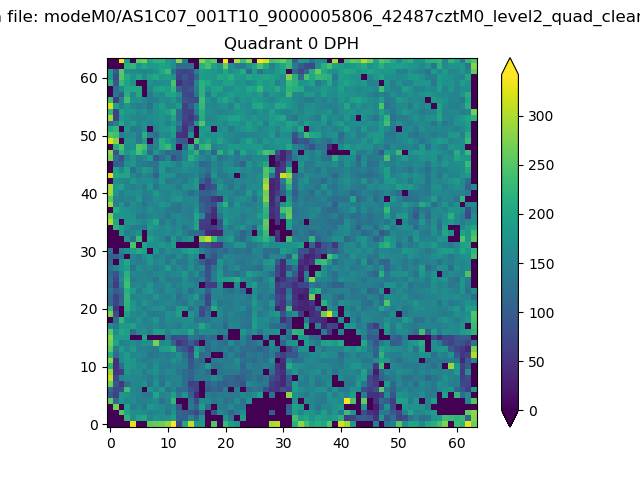 |
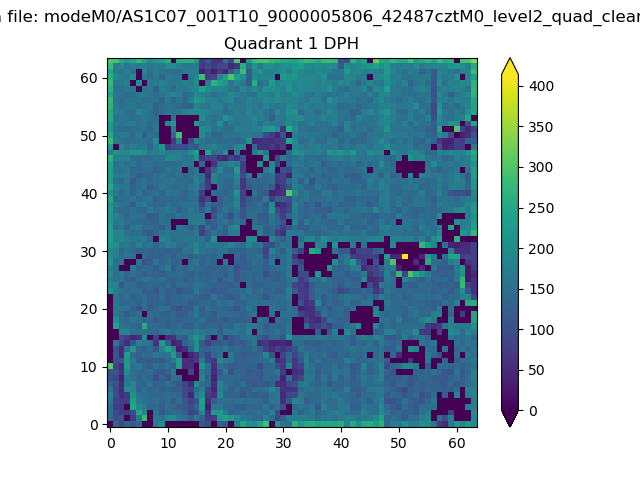 |
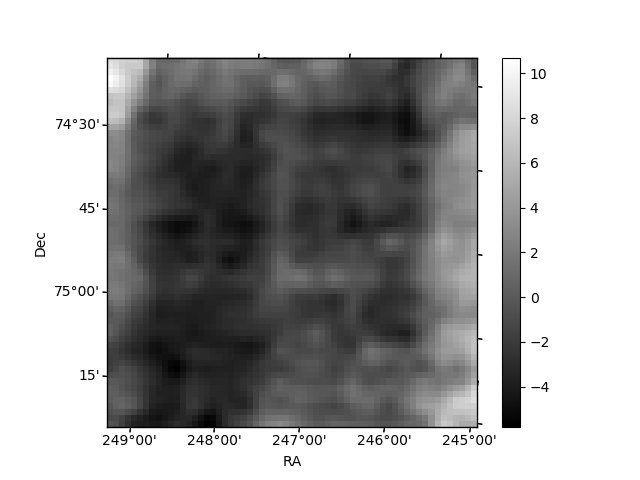
Quadrant B |
|---|---|---|---|
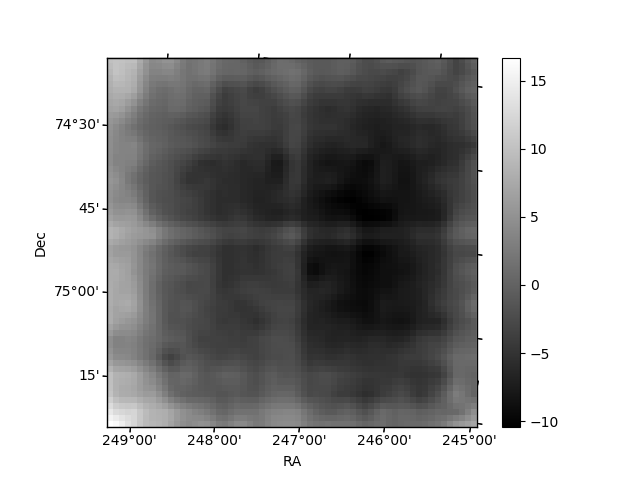
| Quadrant D | 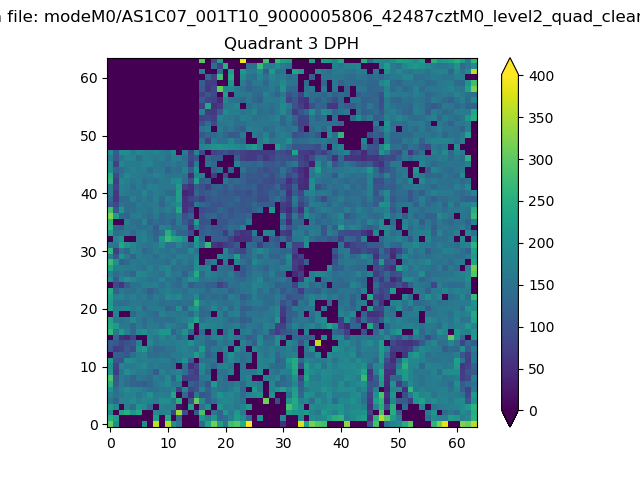 |
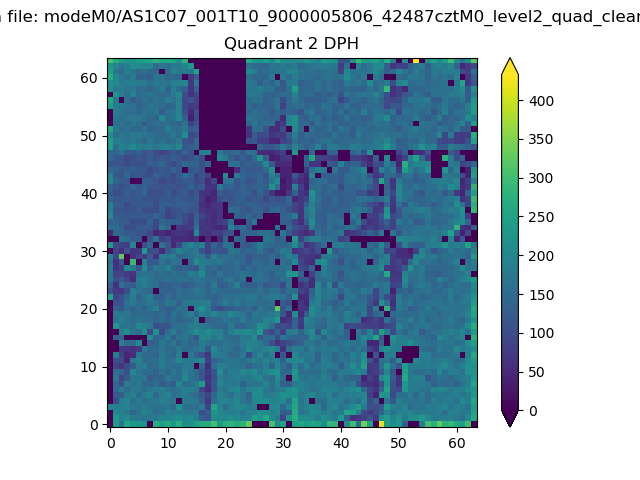 |
Quadrant C |
| Plot type | Count rate plots | Images |
|---|---|---|
| Comparison with Poisson distribution Blue bars denote a histogram of data divided into 1 sec bins. Red curve is a Poisson curve with rate = median count rate of data. |
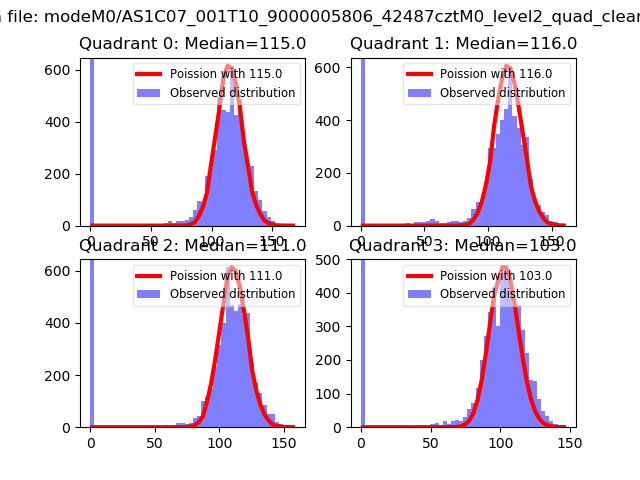 |
 |
| Quadrant-wise count rates Data is divided into 100 sec bins |
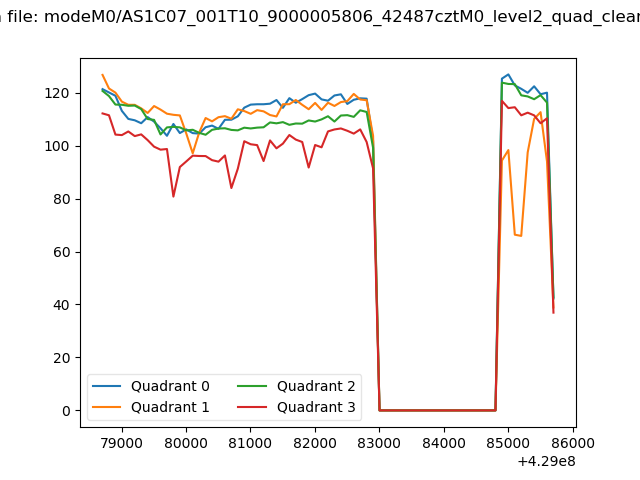 |
|
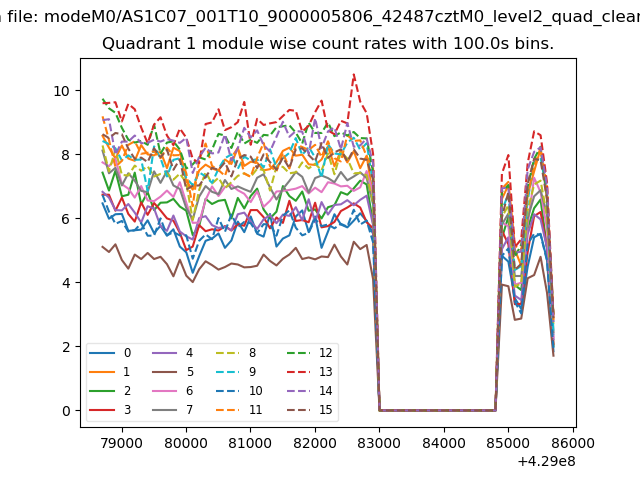
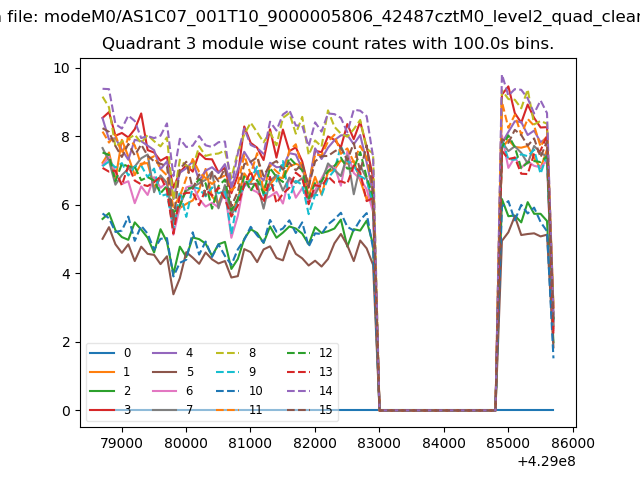
| Module-wise count rates for Quadrant A Data is divided into 100 sec bins |
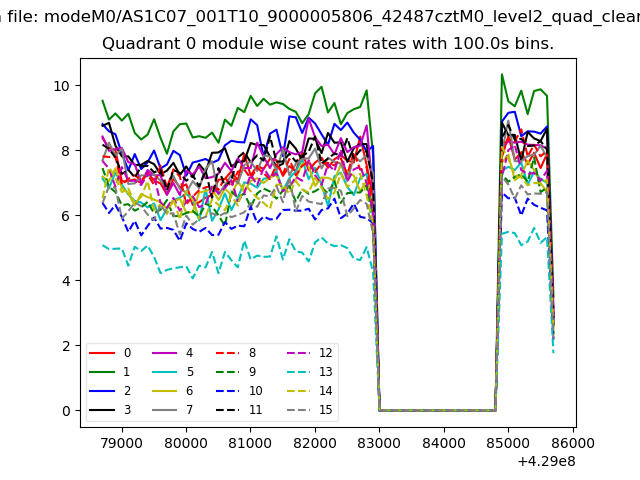 |
 |
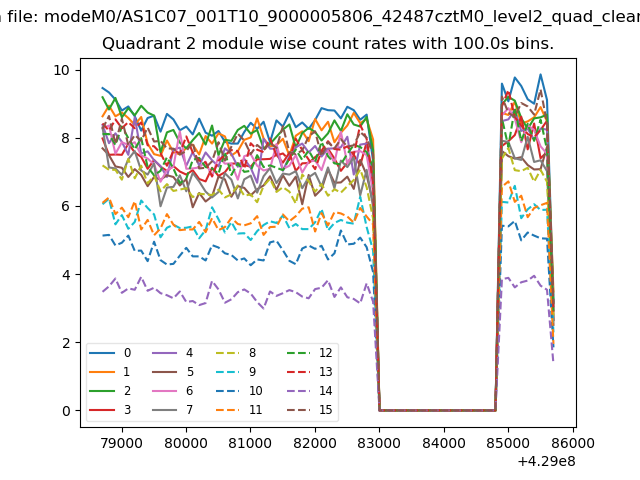
| Module-wise count rates for Quadrant B Data is divided into 100 sec bins |
 |
 |
| Module-wise count rates for Quadrant C Data is divided into 100 sec bins |
 |
 |
| Module-wise count rates for Quadrant D Data is divided into 100 sec bins |
 |
 |
| Parameter | Plot |
|---|---|
| CZT HV Monitor | 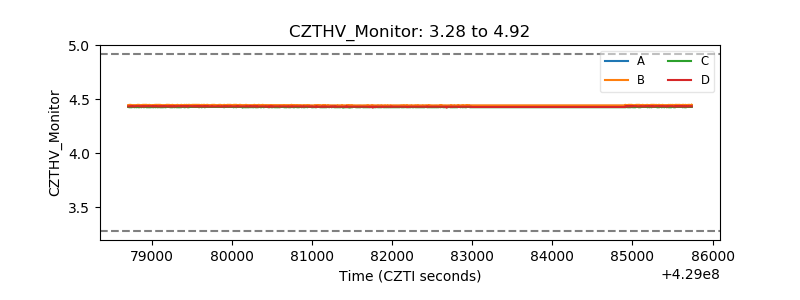 |
| D_VDD | 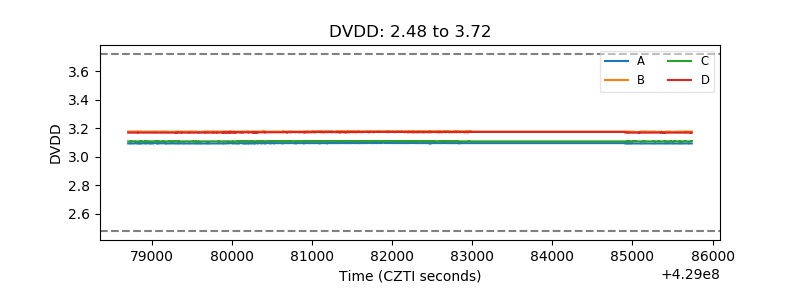 |
| Temperature 1 | 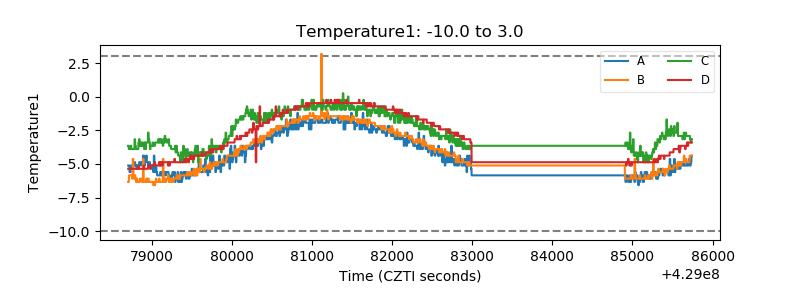 |
| Veto HV Monitor | 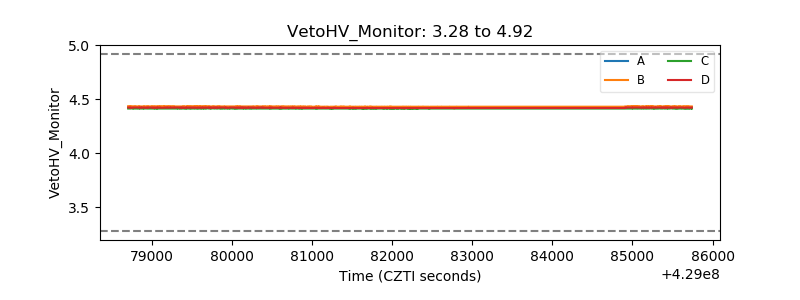 |
| Veto LLD | 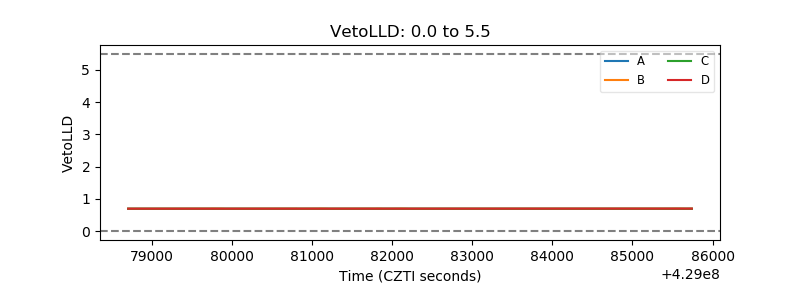 |
| Alpha Counter | 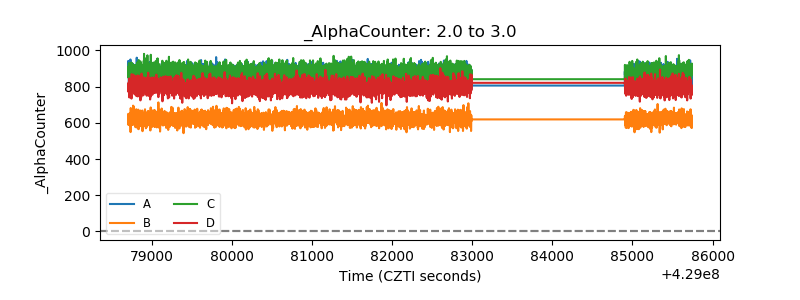 |
| _CPM_Rate | 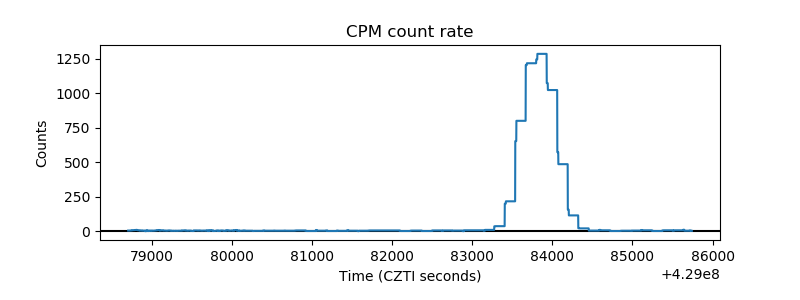 |
| CZT Counter | 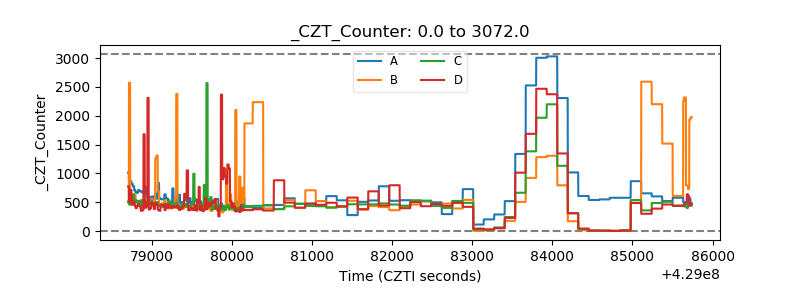 |
| +2.5 Volts monitor |  |
| +5 Volts monitor | 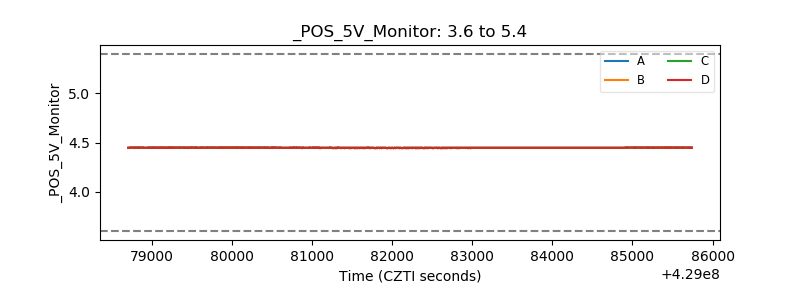 |
| _ROLL_ROT | 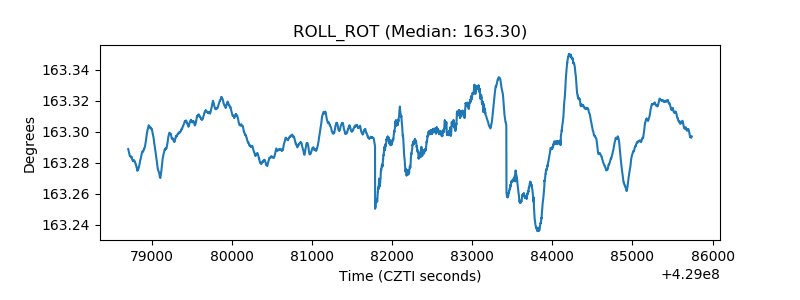 |
| _Roll_DEC | 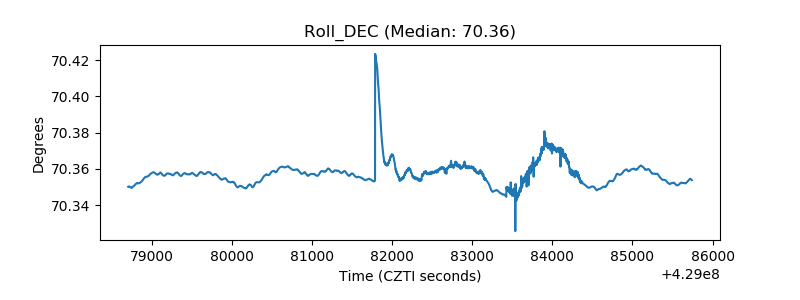 |
| _Roll_RA | 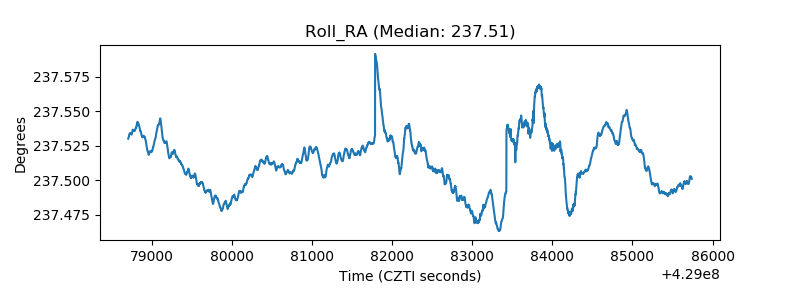 |
| Veto Counter | 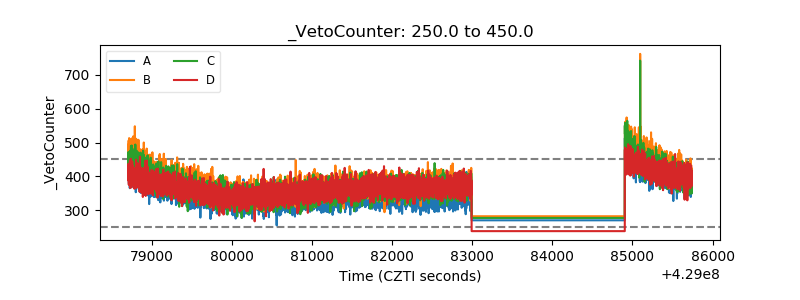 |