| Param | Original file | Final file |
|---|---|---|
| Filename | modeM0/AS1C07_001T10_9000005806_42488cztM0_level2.fits | modeM0/AS1C07_001T10_9000005806_42488cztM0_level2_quad_clean.evt |
| Size (bytes) | 331,680,960 | 86,201,280 |
| Size | 316.3 MB | 82.2 MB |
| Events in quadrant A | 2,883,535 | 599,113 |
| Events in quadrant B | 3,609,989 | 562,630 |
| Events in quadrant C | 2,368,126 | 571,820 |
| Events in quadrant D | 3,025,433 | 524,959 |
| Mode M9 | |||
|---|---|---|---|
| Quadrant | BADHDUFLAG | Total packets | Discarded packets |
| A | 0 | 23 | 0 |
| B | 0 | 24 | 0 |
| C | 0 | 24 | 0 |
| D | 0 | 24 | 0 |
| Mode SS | |||
|---|---|---|---|
| Quadrant | BADHDUFLAG | Total packets | Discarded packets |
| A | 0 | 104 | 0 |
| B | 0 | 104 | 0 |
| C | 0 | 104 | 0 |
| D | 0 | 104 | 0 |
| Mode M0 | |||
|---|---|---|---|
| Quadrant | BADHDUFLAG | Total packets | Discarded packets |
| A | 0 | 11486 | 2 |
| B | 0 | 14162 | 2 |
| C | 0 | 10140 | 2 |
| D | 0 | 12442 | 2 |
| Quadrant | Total seconds | Saturated seconds | Saturation percentage |
|---|---|---|---|
| A | 5011 | 16 | 0.319298% |
| B | 5011 | 469 | 9.359409% |
| C | 5010 | 4 | 0.079840% |
| D | 5010 | 153 | 3.053892% |
Noise dominated data is calculated using 1-second bins in cleaned event files. If a bin has >2000 counts, and if more than 50% of those come from <1% of pixels, then it is considered to be noise-dominated and hence unusable.
| Quadrant | # 1 sec bins | Bins with >0 counts | Bins with >2000 counts | High rate bins dominated by noise | Noise dominated (total time) | Noise dominated (detector-on time) | Marked lightcurve |
|---|---|---|---|---|---|---|---|
| A | 7043 | 5012 | 8 | 8 | 0.11% | 0.16% | 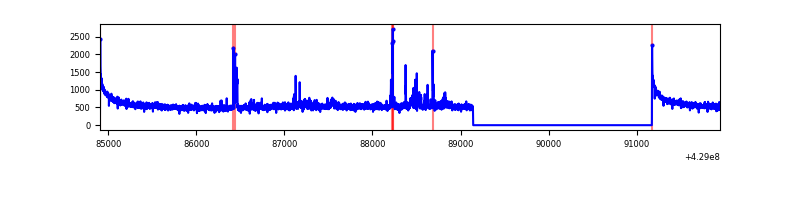 |
| B | 7043 | 5012 | 318 | 318 | 4.52% | 6.34% | 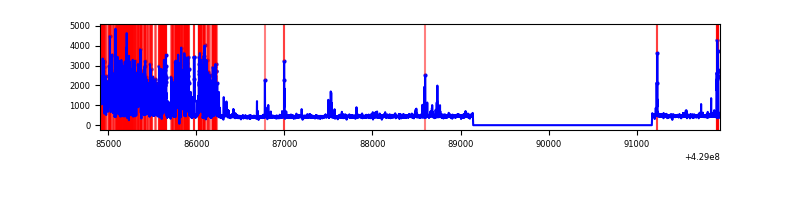 |
| C | 7042 | 5011 | 3 | 3 | 0.04% | 0.06% | 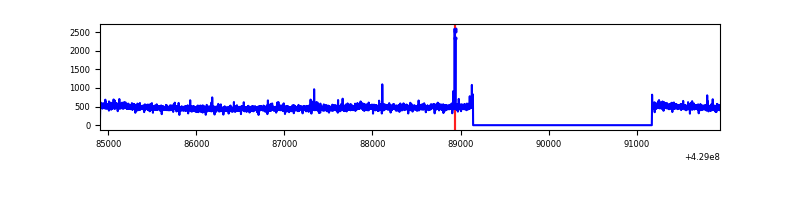 |
| D | 7042 | 5011 | 128 | 128 | 1.82% | 2.55% | 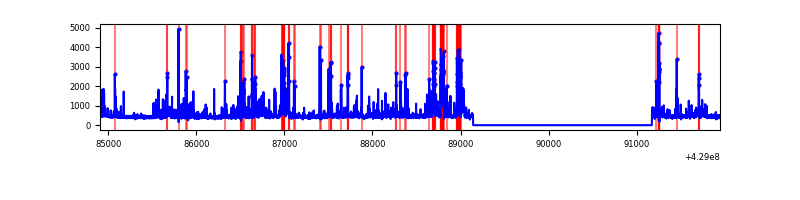 |
Top three noisy pixels from each quadrant. If the there are fewer than three noisy pixels in the level2.evt file, extra rows are filled as -1
| Pixel properties | Quadrant properties | ||||||
|---|---|---|---|---|---|---|---|
| Quadrant | DetID | PixID | Counts | Sigma | Mean | Median | Sigma |
| A | 10 | 83 | 545063 | 4745.9 | 564 | 553 | 114.7 |
| A | 12 | 189 | 92493 | 801.34 | 564 | 553 | 114.7 |
| A | 7 | 3 | 50215 | 432.85 | 564 | 553 | 114.7 |
| B | 5 | 255 | 1390061 | 13575.57 | 537 | 524 | 102.4 |
| B | 5 | 172 | 71107 | 689.59 | 537 | 524 | 102.4 |
| B | 15 | 85 | 19678 | 187.13 | 537 | 524 | 102.4 |
| C | 15 | 214 | 213552 | 1727.7 | 538 | 542 | 123.3 |
| C | 4 | 254 | 17612 | 138.45 | 538 | 542 | 123.3 |
| C | 14 | 254 | 12465 | 96.71 | 538 | 542 | 123.3 |
| D | 12 | 0 | 283792 | 2159.93 | 540 | 525 | 131.1 |
| D | 12 | 233 | 185199 | 1408.15 | 540 | 525 | 131.1 |
| D | 2 | 249 | 77386 | 586.07 | 540 | 525 | 131.1 |
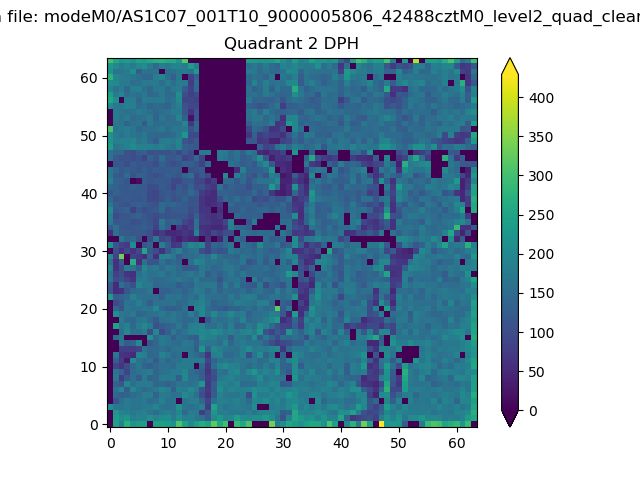
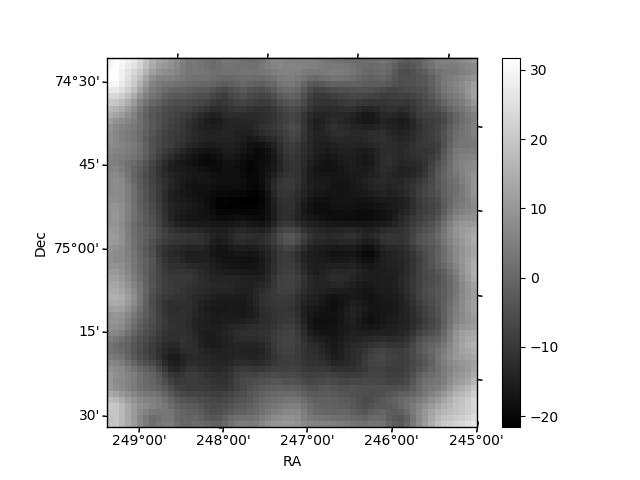
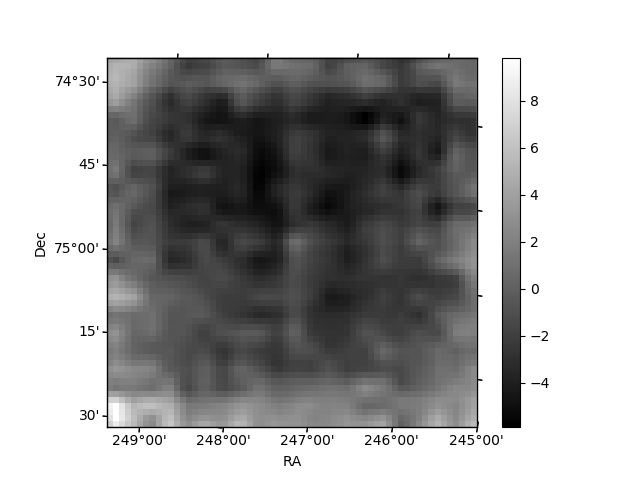
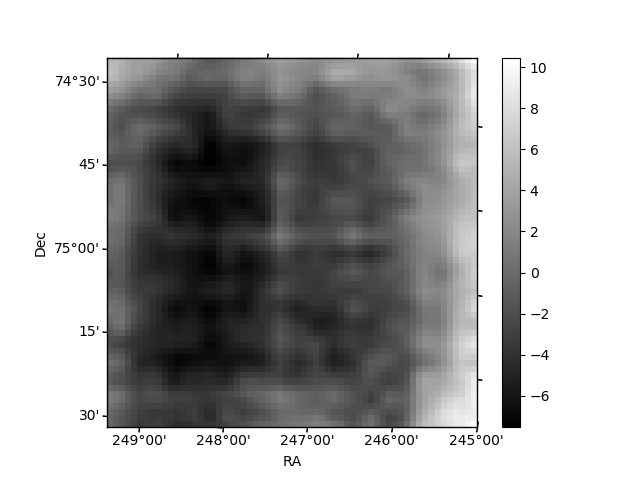
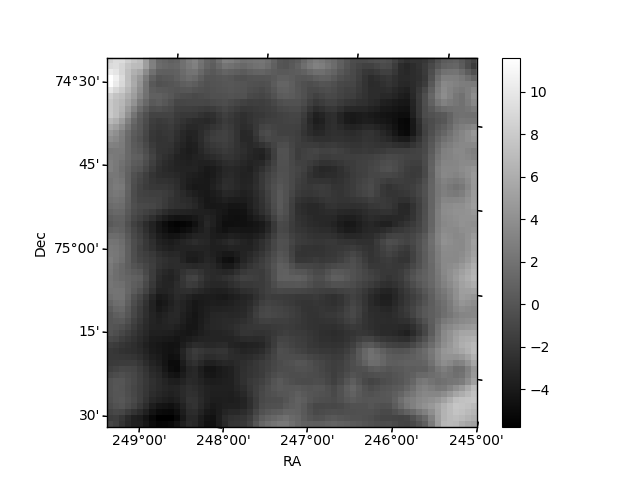
Histogram calculated using DETX and DETY for each event in the final _common_clean file
| Quadrant A | 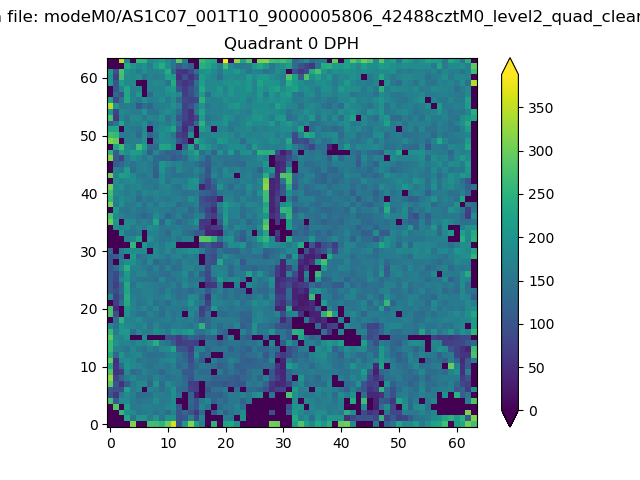 |
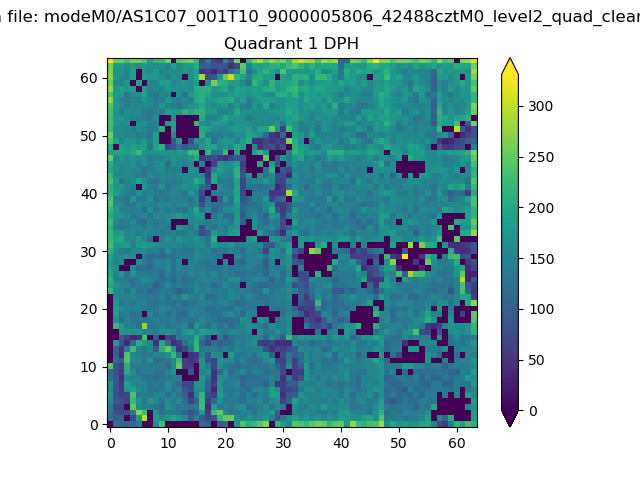 |
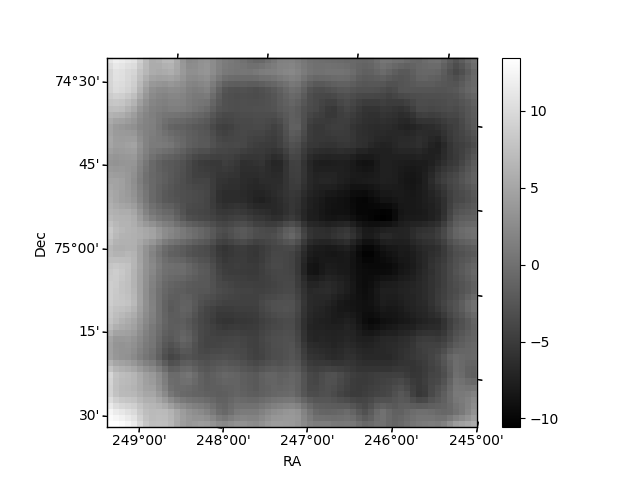
Quadrant B |
|---|---|---|---|
| Quadrant D | 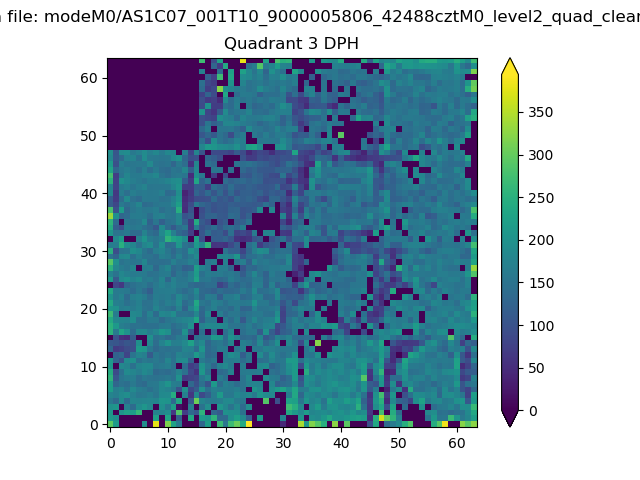 |
 |
Quadrant C |
| Plot type | Count rate plots | Images |
|---|---|---|
| Comparison with Poisson distribution Blue bars denote a histogram of data divided into 1 sec bins. Red curve is a Poisson curve with rate = median count rate of data. |
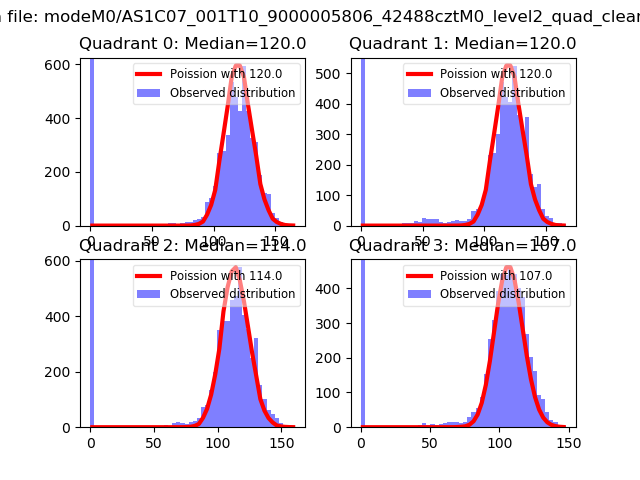 |
 |
| Quadrant-wise count rates Data is divided into 100 sec bins |
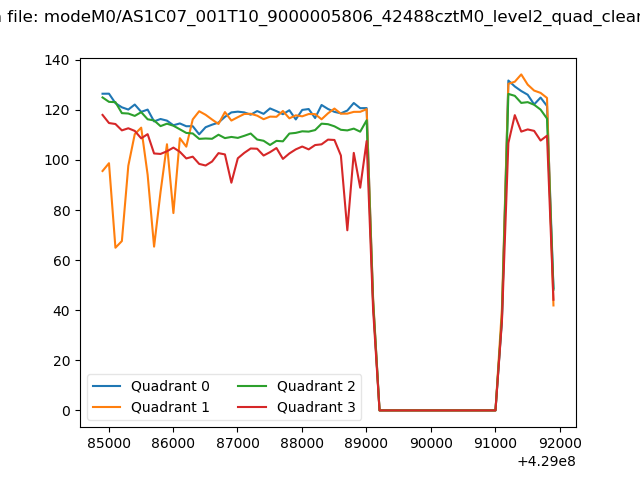 |
|
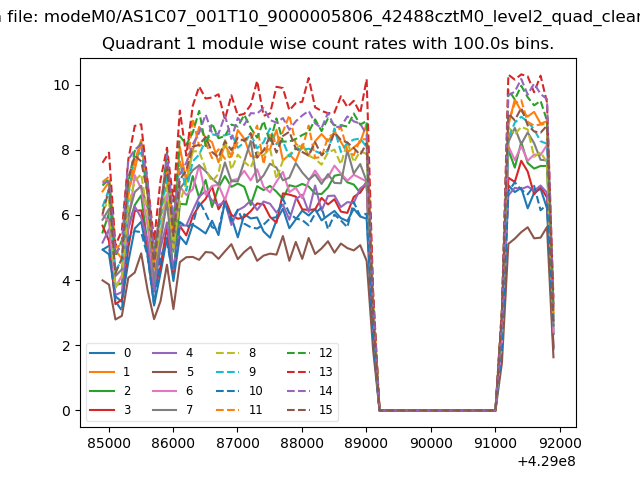
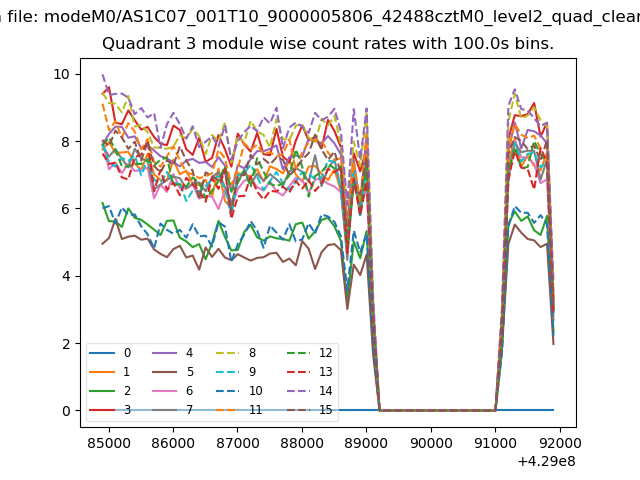
| Module-wise count rates for Quadrant A Data is divided into 100 sec bins |
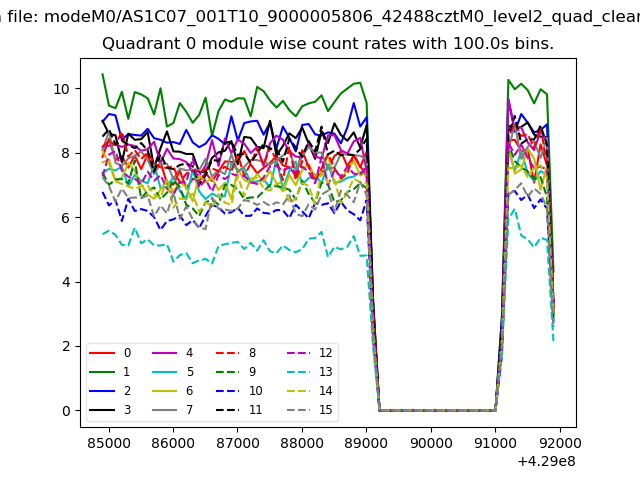 |
 |
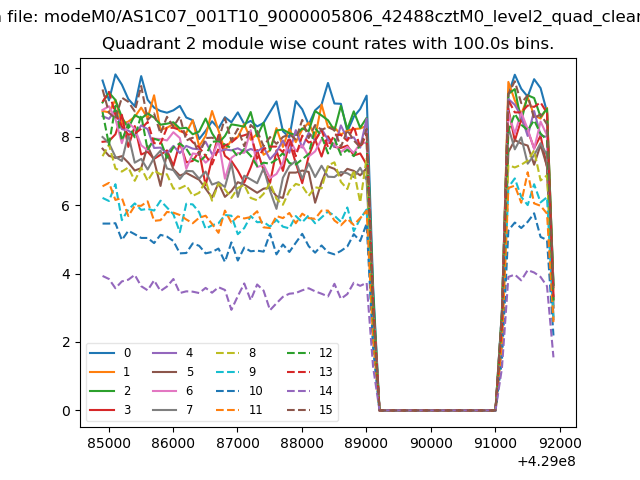
| Module-wise count rates for Quadrant B Data is divided into 100 sec bins |
 |
 |
| Module-wise count rates for Quadrant C Data is divided into 100 sec bins |
 |
 |
| Module-wise count rates for Quadrant D Data is divided into 100 sec bins |
 |
 |
| Parameter | Plot |
|---|---|
| CZT HV Monitor | 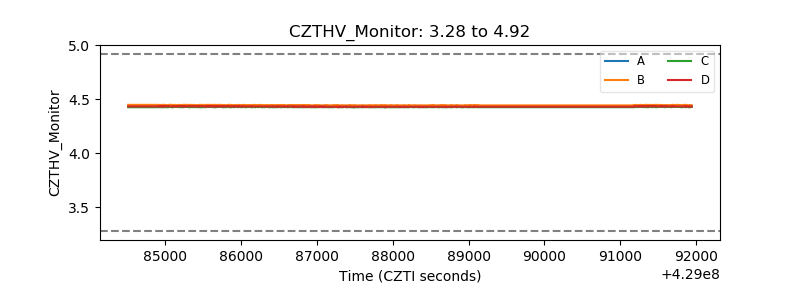 |
| D_VDD | 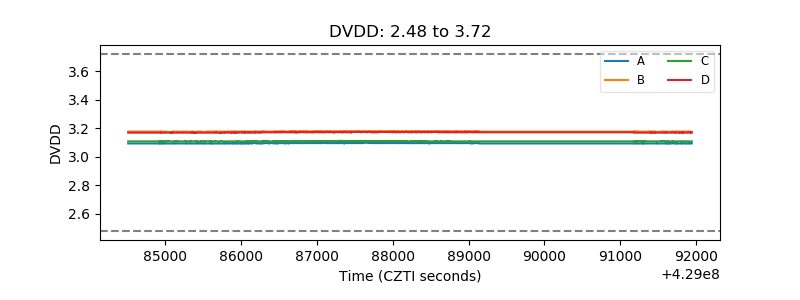 |
| Temperature 1 | 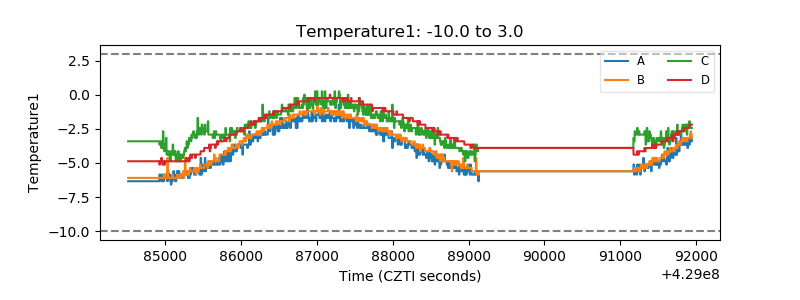 |
| Veto HV Monitor | 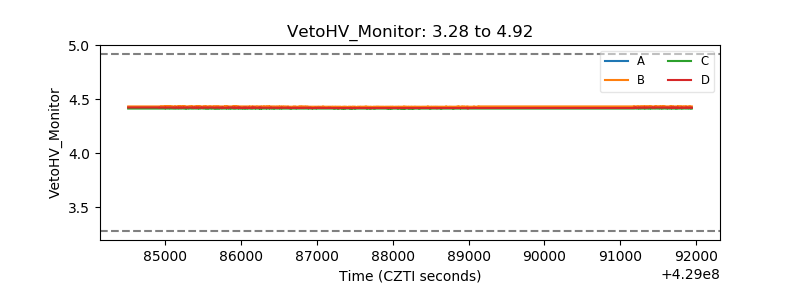 |
| Veto LLD | 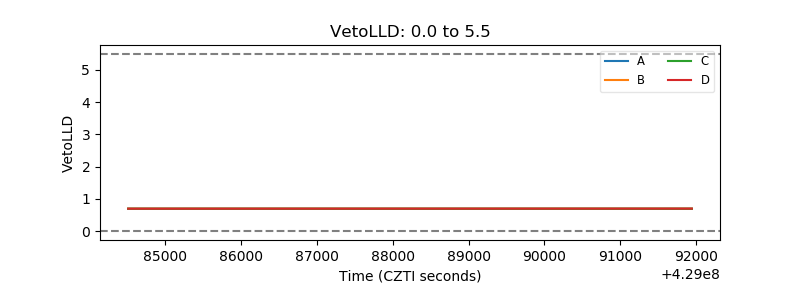 |
| Alpha Counter | 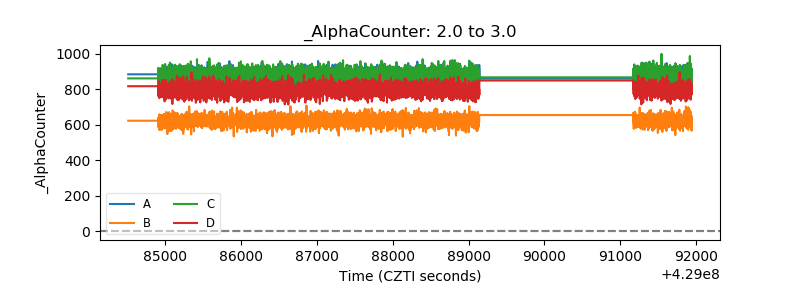 |
| _CPM_Rate | 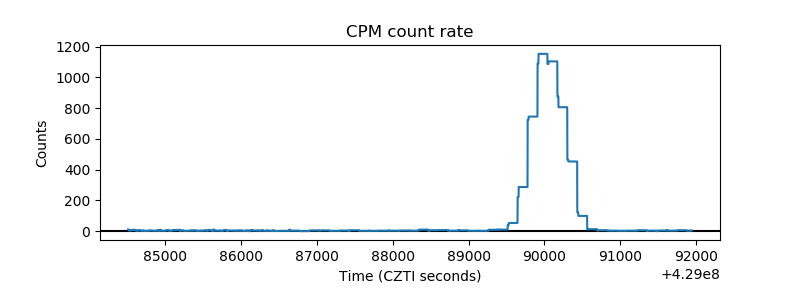 |
| CZT Counter | 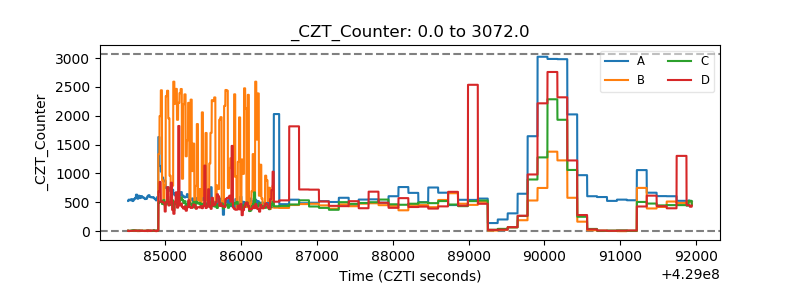 |
| +2.5 Volts monitor | 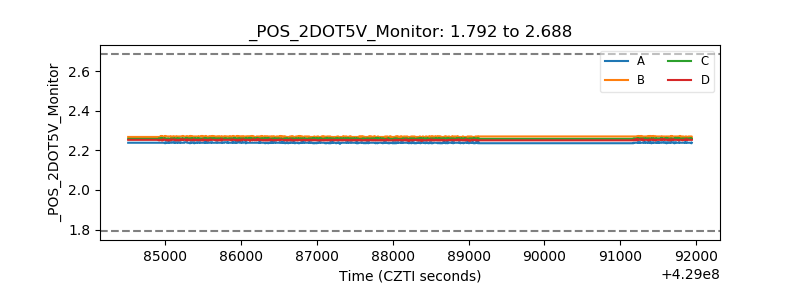 |
| +5 Volts monitor | 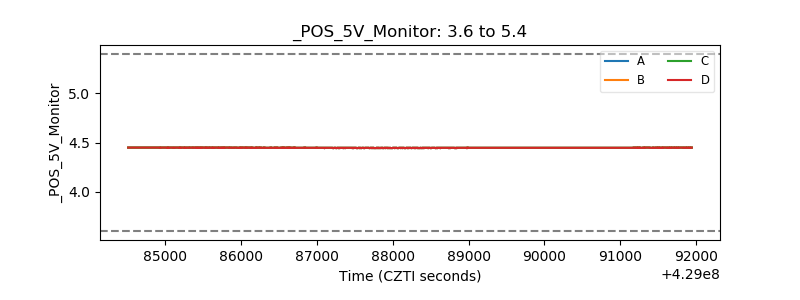 |
| _ROLL_ROT | 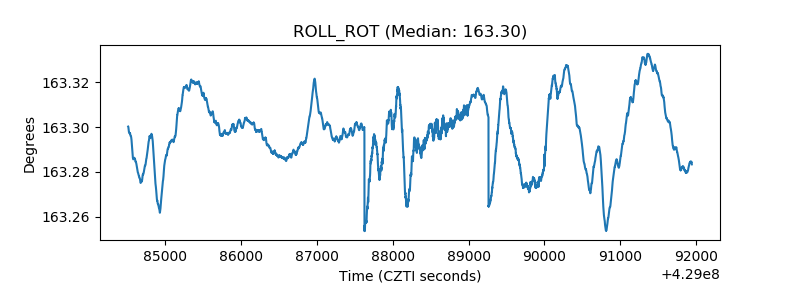 |
| _Roll_DEC | 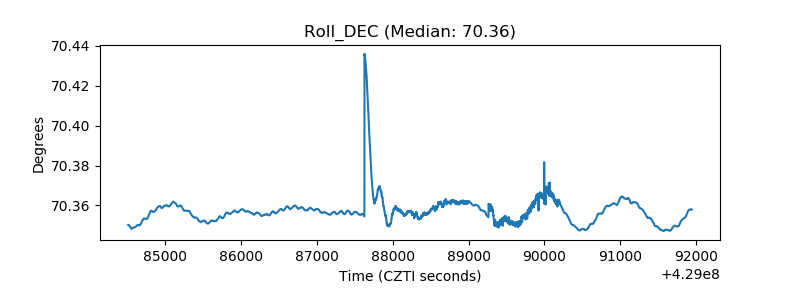 |
| _Roll_RA | 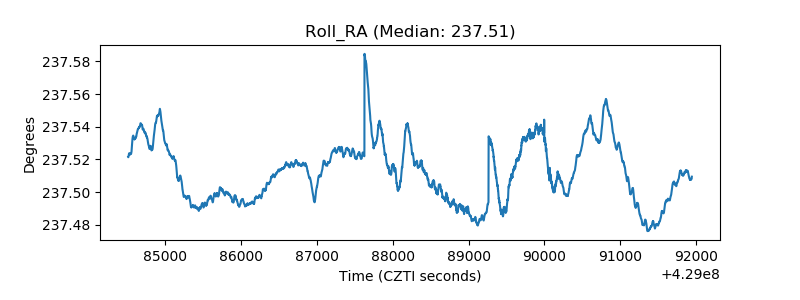 |
| Veto Counter | 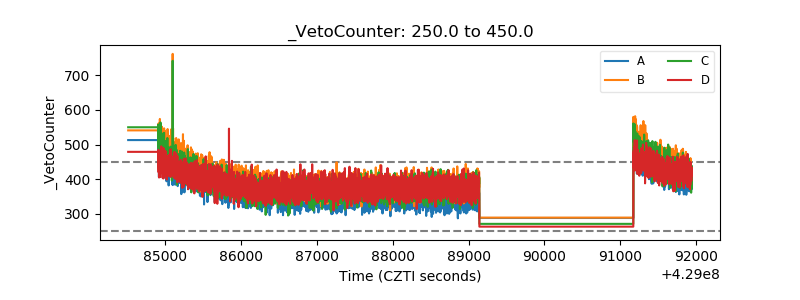 |