| Param | Original file | Final file |
|---|---|---|
| Filename | modeM0/AS1C07_001T10_9000005806_42489cztM0_level2.fits | modeM0/AS1C07_001T10_9000005806_42489cztM0_level2_quad_clean.evt |
| Size (bytes) | 315,000,000 | 85,052,160 |
| Size | 300.4 MB | 81.1 MB |
| Events in quadrant A | 2,811,017 | 593,000 |
| Events in quadrant B | 3,458,109 | 554,280 |
| Events in quadrant C | 2,356,319 | 561,430 |
| Events in quadrant D | 2,652,936 | 523,113 |
| Mode M9 | |||
|---|---|---|---|
| Quadrant | BADHDUFLAG | Total packets | Discarded packets |
| A | 0 | 28 | 0 |
| B | 0 | 29 | 0 |
| C | 0 | 29 | 0 |
| D | 0 | 29 | 0 |
| Mode SS | |||
|---|---|---|---|
| Quadrant | BADHDUFLAG | Total packets | Discarded packets |
| A | 0 | 100 | 0 |
| B | 0 | 100 | 0 |
| C | 0 | 100 | 0 |
| D | 0 | 100 | 0 |
| Mode M0 | |||
|---|---|---|---|
| Quadrant | BADHDUFLAG | Total packets | Discarded packets |
| A | 0 | 11184 | 2 |
| B | 0 | 13550 | 2 |
| C | 0 | 10034 | 2 |
| D | 0 | 11282 | 2 |
| Quadrant | Total seconds | Saturated seconds | Saturation percentage |
|---|---|---|---|
| A | 4897 | 8 | 0.163365% |
| B | 4897 | 404 | 8.249949% |
| C | 4897 | 6 | 0.122524% |
| D | 4897 | 99 | 2.021646% |
Noise dominated data is calculated using 1-second bins in cleaned event files. If a bin has >2000 counts, and if more than 50% of those come from <1% of pixels, then it is considered to be noise-dominated and hence unusable.
| Quadrant | # 1 sec bins | Bins with >0 counts | Bins with >2000 counts | High rate bins dominated by noise | Noise dominated (total time) | Noise dominated (detector-on time) | Marked lightcurve |
|---|---|---|---|---|---|---|---|
| A | 7018 | 4898 | 5 | 5 | 0.07% | 0.10% | 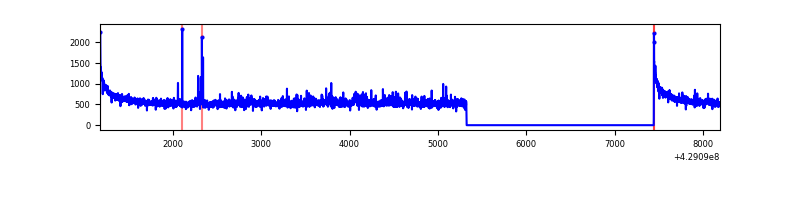 |
| B | 7018 | 4898 | 308 | 308 | 4.39% | 6.29% | 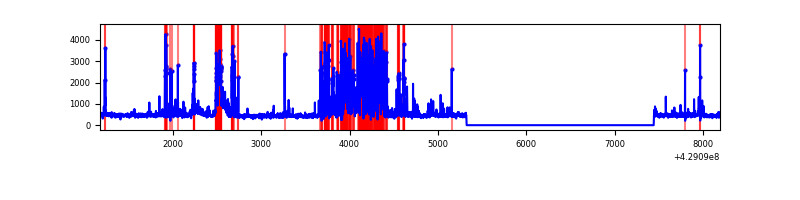 |
| C | 7018 | 4898 | 2 | 2 | 0.03% | 0.04% | 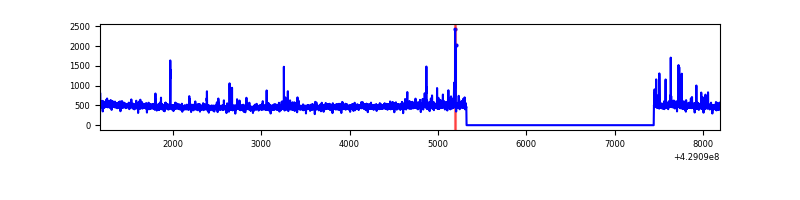 |
| D | 7018 | 4898 | 78 | 78 | 1.11% | 1.59% | 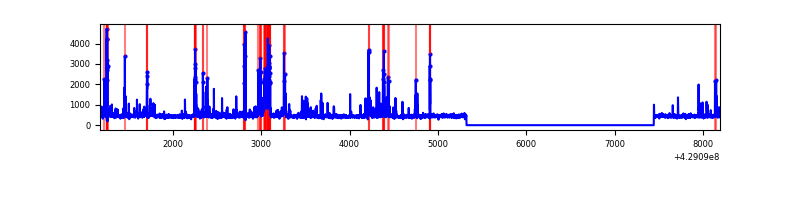 |
Top three noisy pixels from each quadrant. If the there are fewer than three noisy pixels in the level2.evt file, extra rows are filled as -1
| Pixel properties | Quadrant properties | ||||||
|---|---|---|---|---|---|---|---|
| Quadrant | DetID | PixID | Counts | Sigma | Mean | Median | Sigma |
| A | 10 | 83 | 553897 | 4924.73 | 551 | 539 | 112.4 |
| A | 12 | 189 | 79775 | 705.18 | 551 | 539 | 112.4 |
| A | 7 | 3 | 19511 | 168.85 | 551 | 539 | 112.4 |
| B | 5 | 255 | 1239746 | 12488.39 | 523 | 510 | 99.2 |
| B | 5 | 172 | 53229 | 531.28 | 523 | 510 | 99.2 |
| B | 15 | 33 | 34580 | 343.34 | 523 | 510 | 99.2 |
| C | 15 | 214 | 209143 | 1738.53 | 525 | 528 | 120.0 |
| C | 14 | 254 | 52700 | 434.78 | 525 | 528 | 120.0 |
| C | 4 | 254 | 24120 | 196.61 | 525 | 528 | 120.0 |
| D | 12 | 233 | 189104 | 1457.97 | 534 | 520 | 129.3 |
| D | 10 | 199 | 88377 | 679.24 | 534 | 520 | 129.3 |
| D | 5 | 171 | 65276 | 500.64 | 534 | 520 | 129.3 |
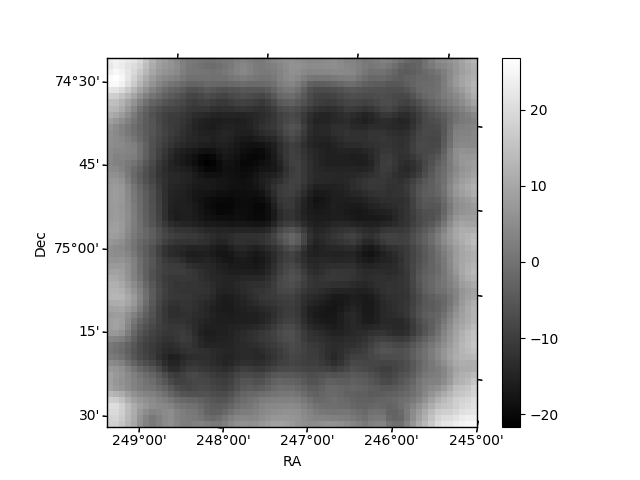
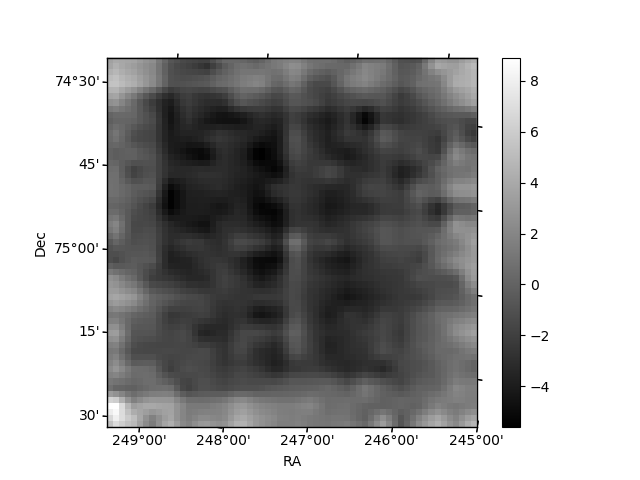
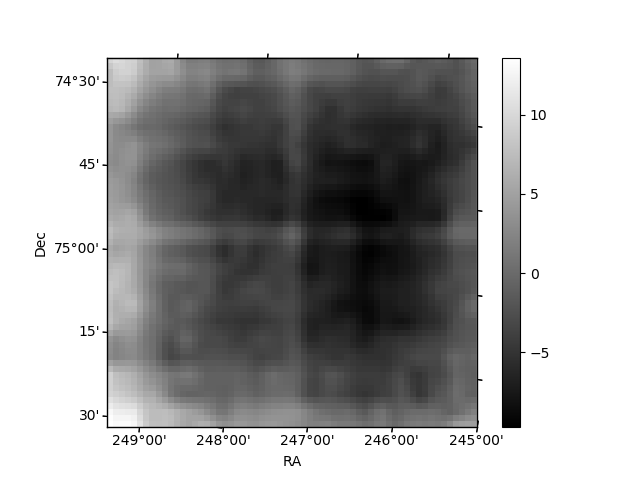
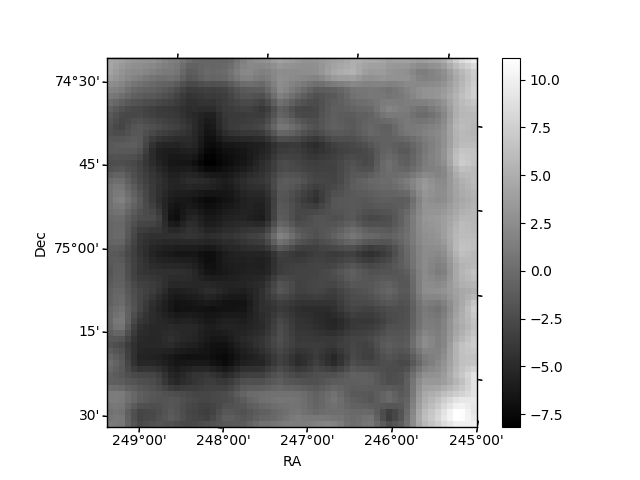
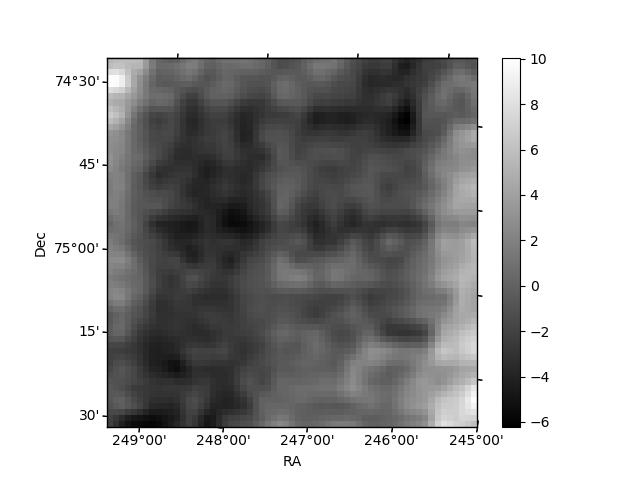
Histogram calculated using DETX and DETY for each event in the final _common_clean file
| Quadrant A | 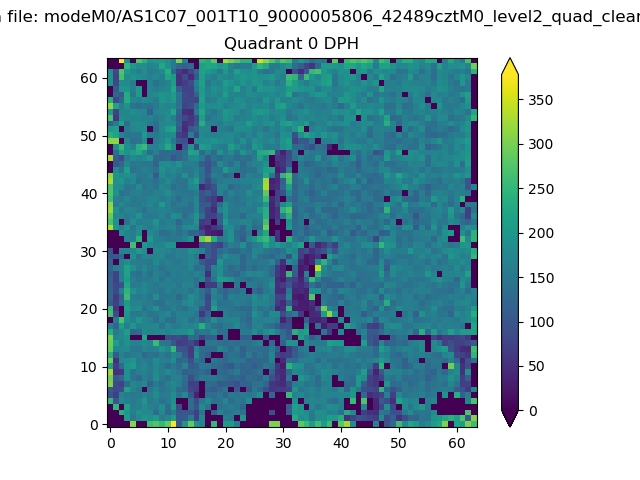 |
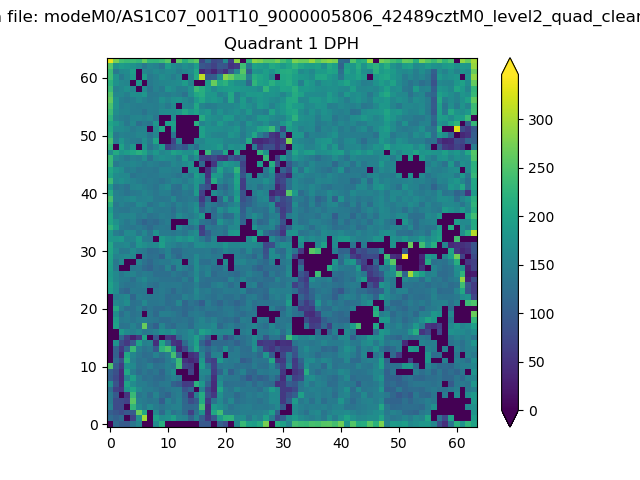 |
Quadrant B |
|---|---|---|---|
| Quadrant D | 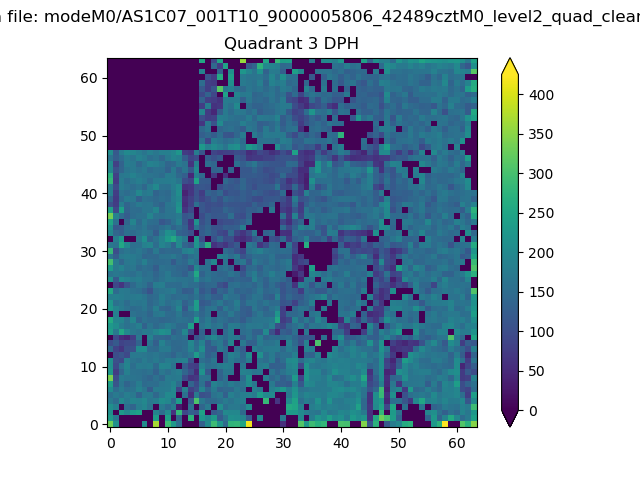 |
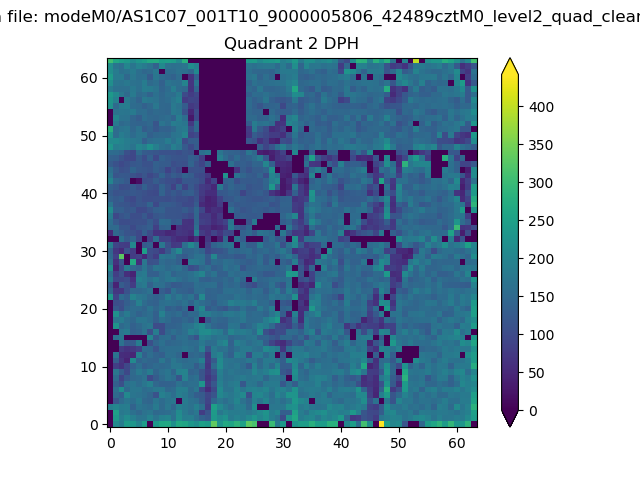 |
Quadrant C |
| Plot type | Count rate plots | Images |
|---|---|---|
| Comparison with Poisson distribution Blue bars denote a histogram of data divided into 1 sec bins. Red curve is a Poisson curve with rate = median count rate of data. |
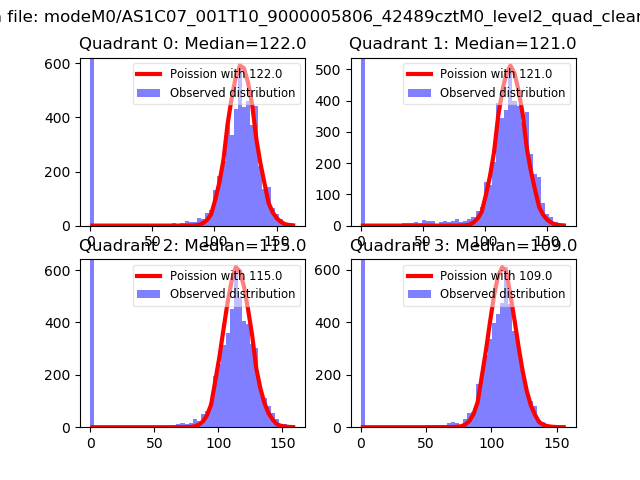 |
 |
| Quadrant-wise count rates Data is divided into 100 sec bins |
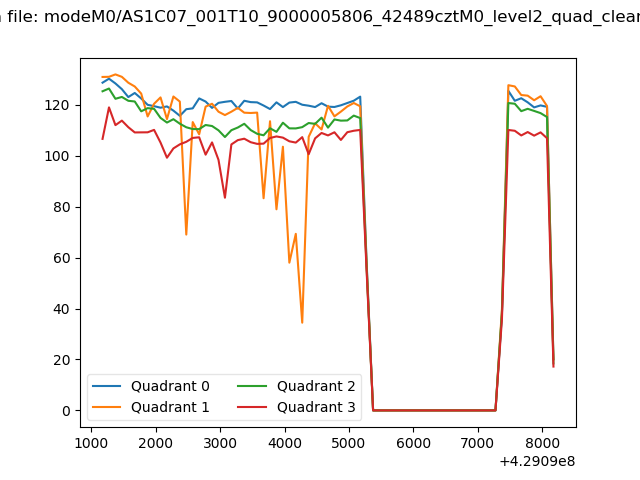 |
|
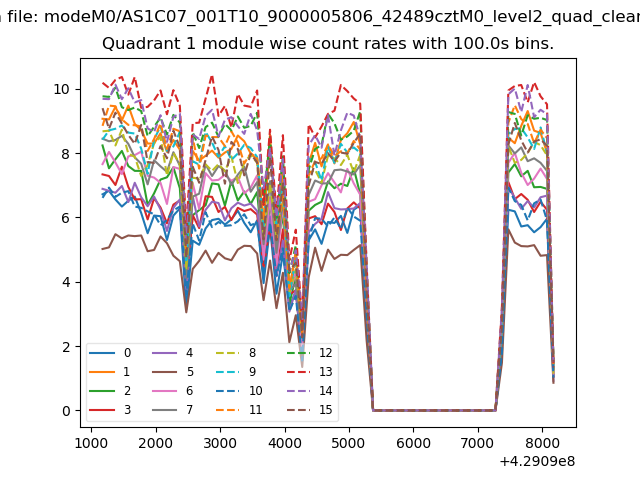
| Module-wise count rates for Quadrant A Data is divided into 100 sec bins |
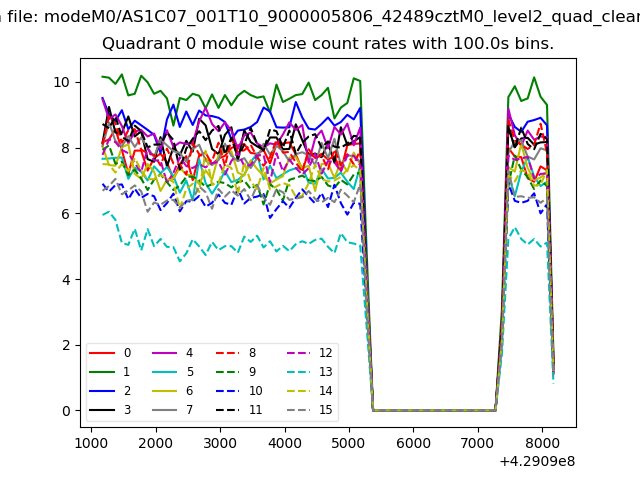 |
 |
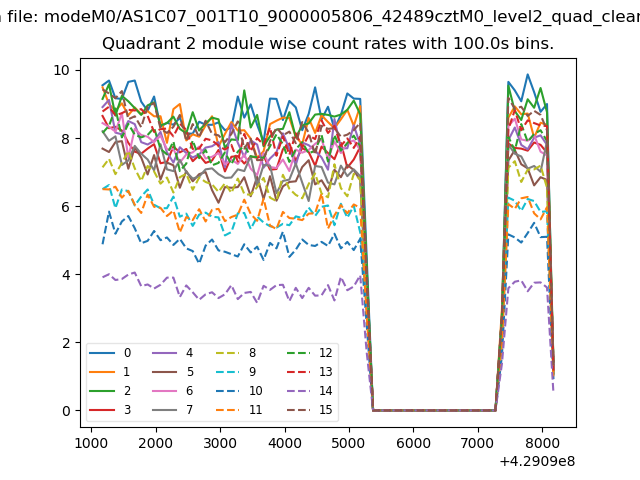
| Module-wise count rates for Quadrant B Data is divided into 100 sec bins |
 |
 |
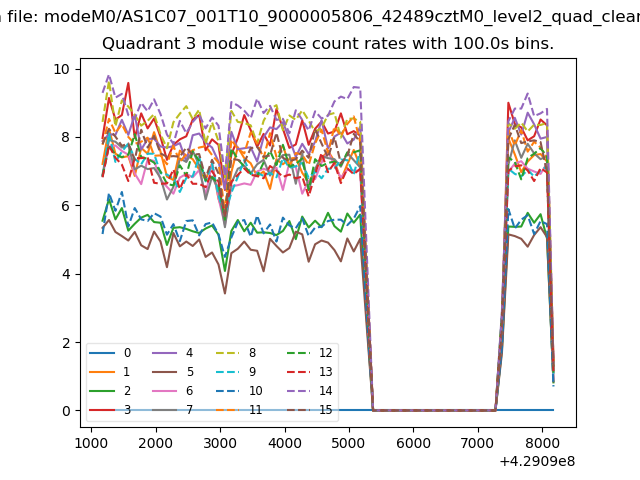
| Module-wise count rates for Quadrant C Data is divided into 100 sec bins |
 |
 |
| Module-wise count rates for Quadrant D Data is divided into 100 sec bins |
 |
 |
| Parameter | Plot |
|---|---|
| CZT HV Monitor | 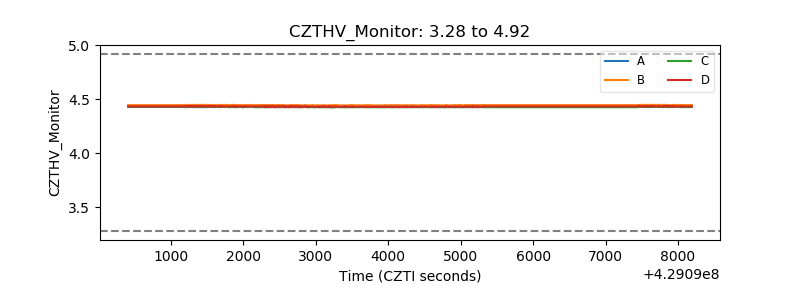 |
| D_VDD | 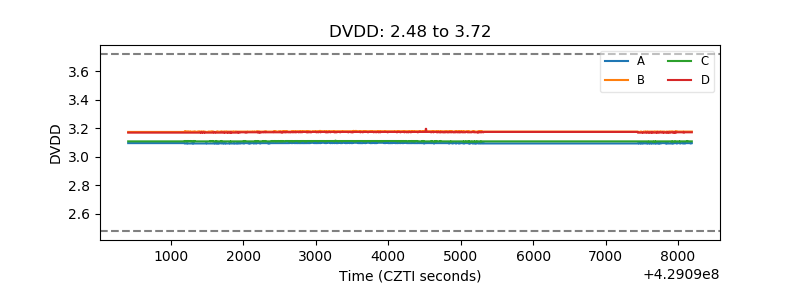 |
| Temperature 1 | 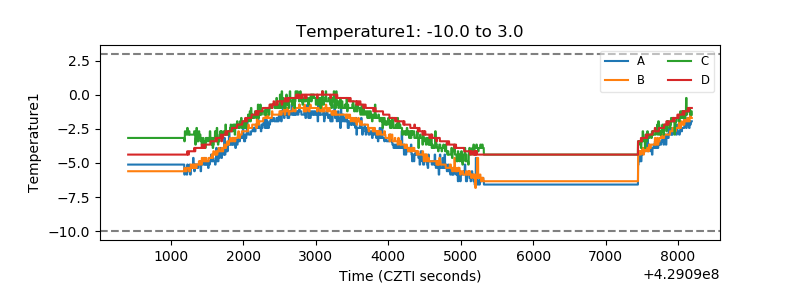 |
| Veto HV Monitor |  |
| Veto LLD | 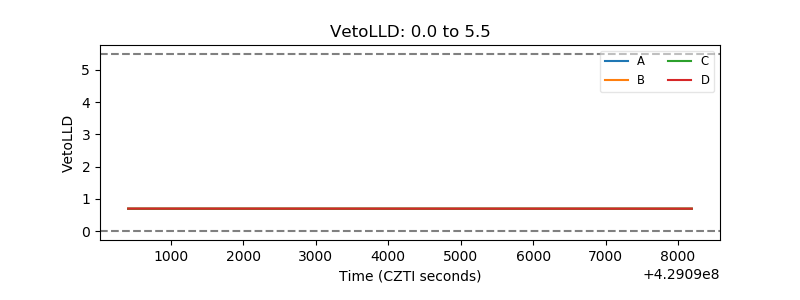 |
| Alpha Counter | 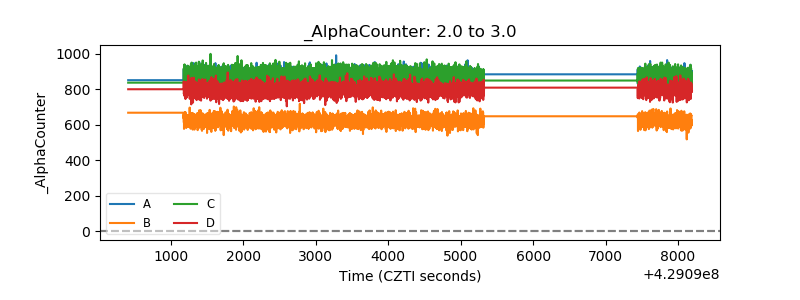 |
| _CPM_Rate | 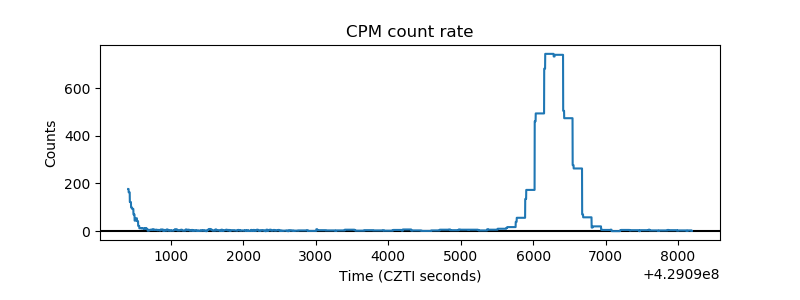 |
| CZT Counter | 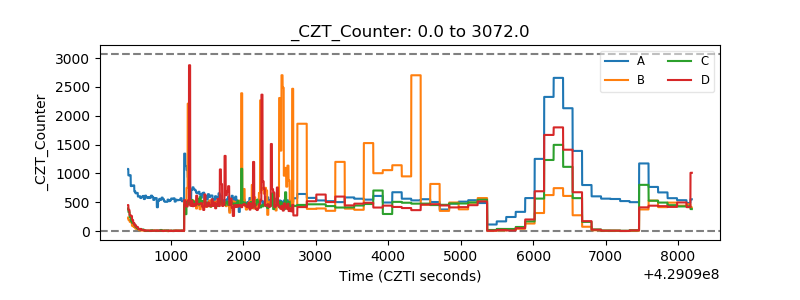 |
| +2.5 Volts monitor | 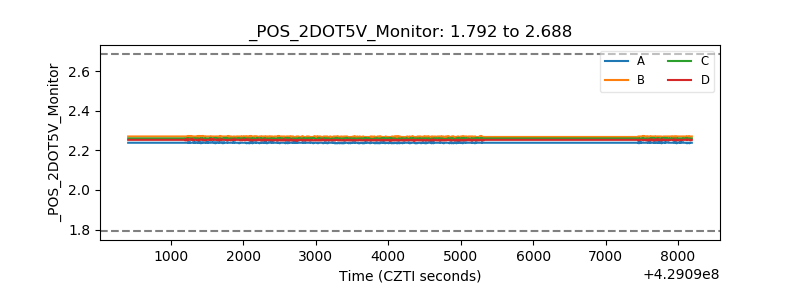 |
| +5 Volts monitor | 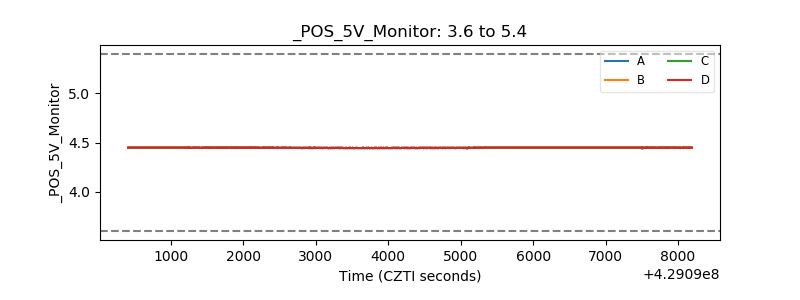 |
| _ROLL_ROT | 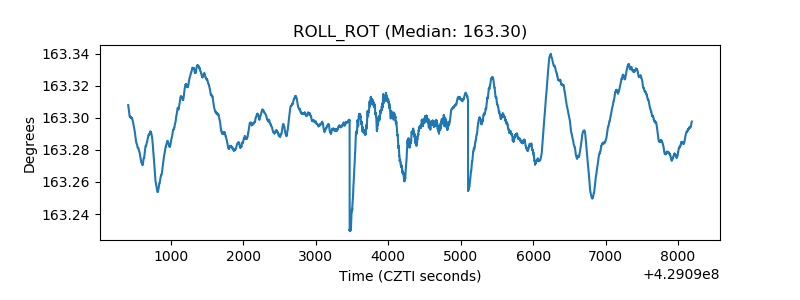 |
| _Roll_DEC | 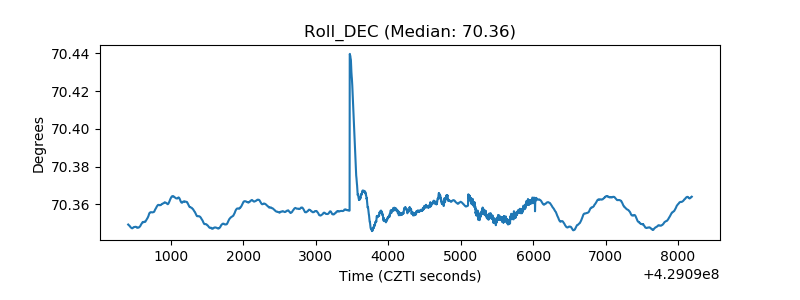 |
| _Roll_RA | 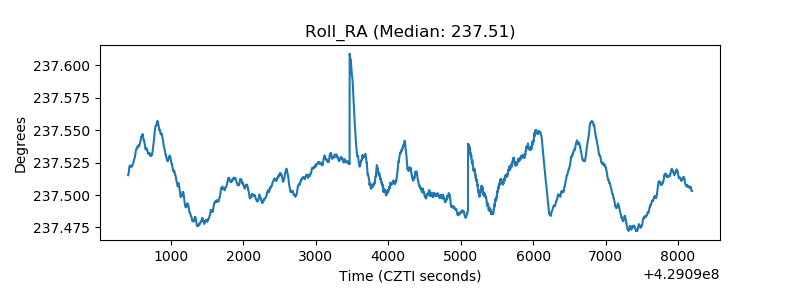 |
| Veto Counter | 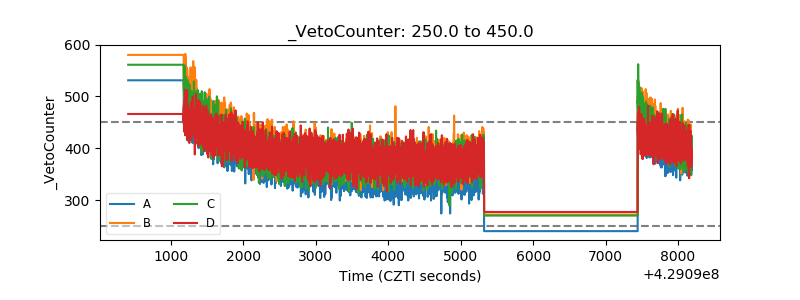 |