| Param | Original file | Final file |
|---|---|---|
| Filename | modeM0/AS1C07_001T10_9000005806_42490cztM0_level2.fits | modeM0/AS1C07_001T10_9000005806_42490cztM0_level2_quad_clean.evt |
| Size (bytes) | 291,493,440 | 84,193,920 |
| Size | 278.0 MB | 80.3 MB |
| Events in quadrant A | 2,910,508 | 579,352 |
| Events in quadrant B | 2,583,514 | 570,645 |
| Events in quadrant C | 2,304,620 | 548,703 |
| Events in quadrant D | 2,608,118 | 506,128 |
| Mode M9 | |||
|---|---|---|---|
| Quadrant | BADHDUFLAG | Total packets | Discarded packets |
| A | 0 | 30 | 0 |
| B | 0 | 31 | 0 |
| C | 0 | 31 | 0 |
| D | 0 | 31 | 0 |
| Mode SS | |||
|---|---|---|---|
| Quadrant | BADHDUFLAG | Total packets | Discarded packets |
| A | 0 | 100 | 0 |
| B | 0 | 100 | 0 |
| C | 0 | 100 | 0 |
| D | 0 | 100 | 0 |
| Mode M0 | |||
|---|---|---|---|
| Quadrant | BADHDUFLAG | Total packets | Discarded packets |
| A | 0 | 11562 | 3 |
| B | 0 | 11105 | 2 |
| C | 0 | 9979 | 2 |
| D | 0 | 11217 | 2 |
| Quadrant | Total seconds | Saturated seconds | Saturation percentage |
|---|---|---|---|
| A | 4913 | 22 | 0.447792% |
| B | 4913 | 87 | 1.770812% |
| C | 4913 | 3 | 0.061062% |
| D | 4913 | 156 | 3.175249% |
Noise dominated data is calculated using 1-second bins in cleaned event files. If a bin has >2000 counts, and if more than 50% of those come from <1% of pixels, then it is considered to be noise-dominated and hence unusable.
| Quadrant | # 1 sec bins | Bins with >0 counts | Bins with >2000 counts | High rate bins dominated by noise | Noise dominated (total time) | Noise dominated (detector-on time) | Marked lightcurve |
|---|---|---|---|---|---|---|---|
| A | 7066 | 4914 | 21 | 21 | 0.30% | 0.43% | 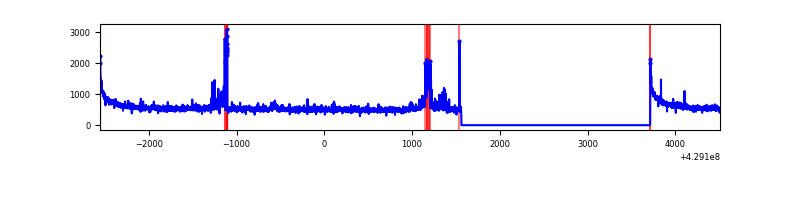 |
| B | 7066 | 4914 | 66 | 66 | 0.93% | 1.34% | 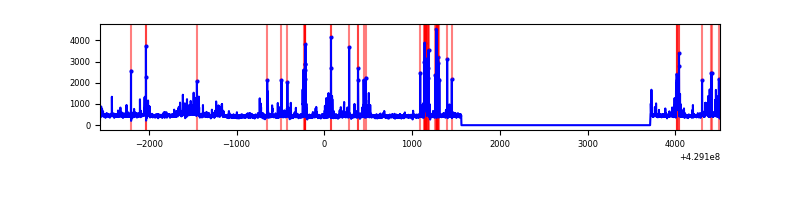 |
| C | 7066 | 4914 | 0 | 0 | 0.00% | 0.00% | 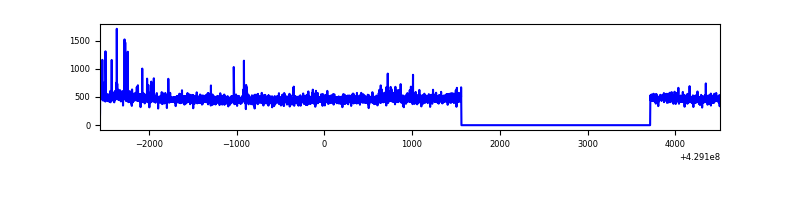 |
| D | 7066 | 4914 | 99 | 99 | 1.40% | 2.01% | 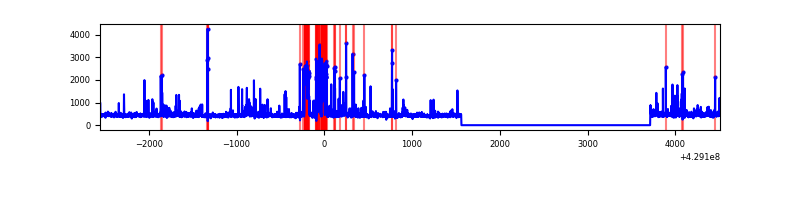 |
Top three noisy pixels from each quadrant. If the there are fewer than three noisy pixels in the level2.evt file, extra rows are filled as -1
| Pixel properties | Quadrant properties | ||||||
|---|---|---|---|---|---|---|---|
| Quadrant | DetID | PixID | Counts | Sigma | Mean | Median | Sigma |
| A | 10 | 83 | 567597 | 5165.14 | 540 | 530 | 109.8 |
| A | 15 | 223 | 175914 | 1597.49 | 540 | 530 | 109.8 |
| A | 12 | 189 | 54985 | 496.0 | 540 | 530 | 109.8 |
| B | 5 | 255 | 386700 | 3870.72 | 525 | 511 | 99.8 |
| B | 15 | 35 | 36682 | 362.54 | 525 | 511 | 99.8 |
| B | 5 | 207 | 31202 | 307.61 | 525 | 511 | 99.8 |
| C | 15 | 214 | 207543 | 1738.82 | 519 | 521 | 119.1 |
| C | 14 | 254 | 39539 | 327.72 | 519 | 521 | 119.1 |
| C | 0 | 239 | 15891 | 129.1 | 519 | 521 | 119.1 |
| D | 10 | 118 | 317329 | 2472.68 | 524 | 508 | 128.1 |
| D | 10 | 199 | 75761 | 587.33 | 524 | 508 | 128.1 |
| D | 5 | 171 | 44027 | 339.65 | 524 | 508 | 128.1 |
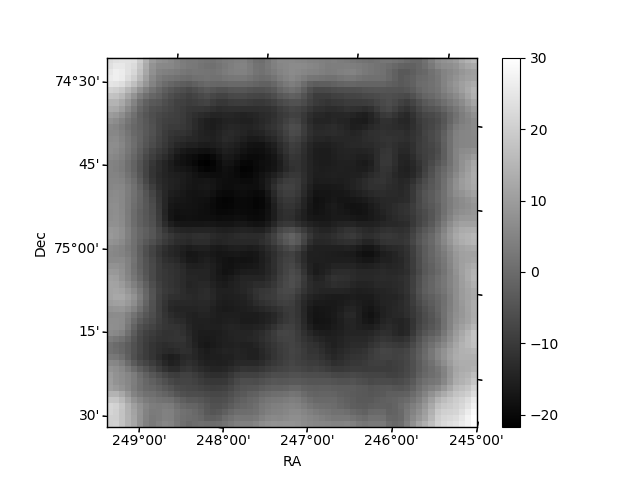
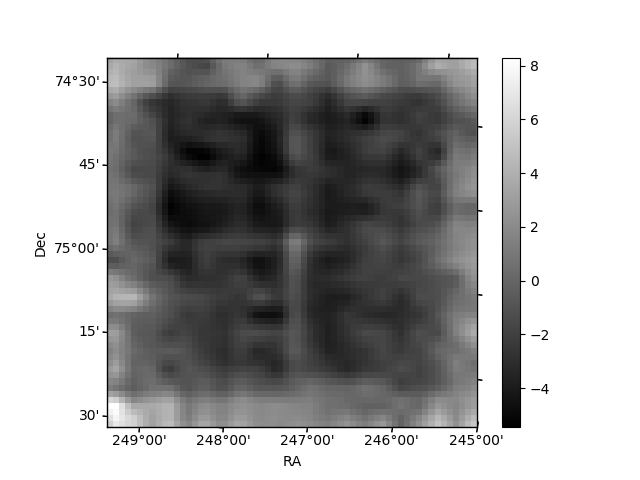
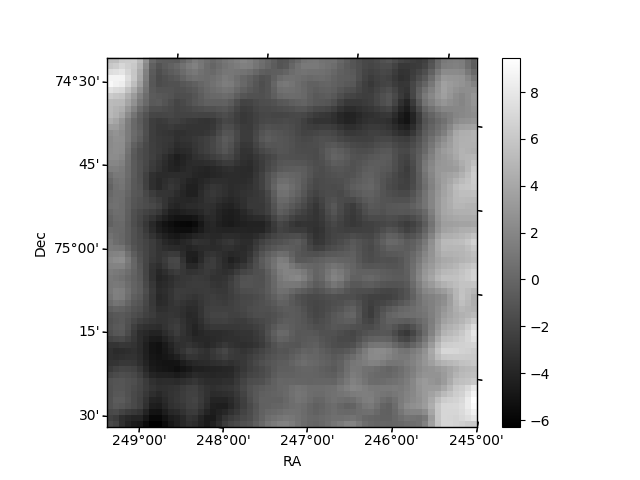
Histogram calculated using DETX and DETY for each event in the final _common_clean file
| Quadrant A | 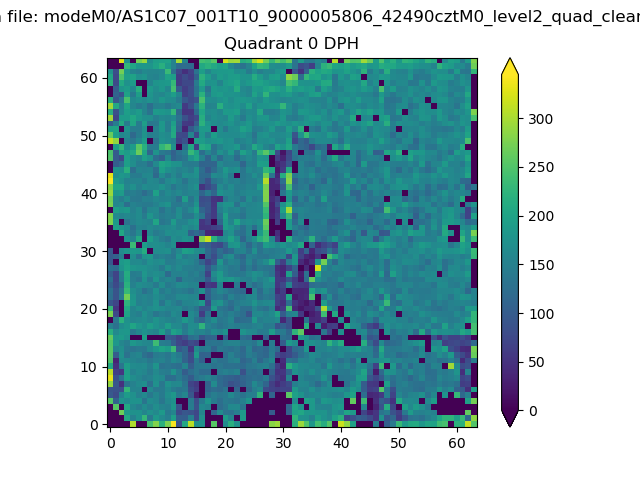 |
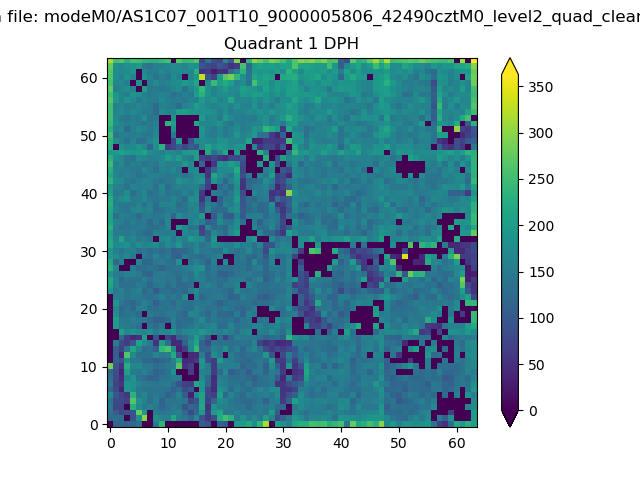 |
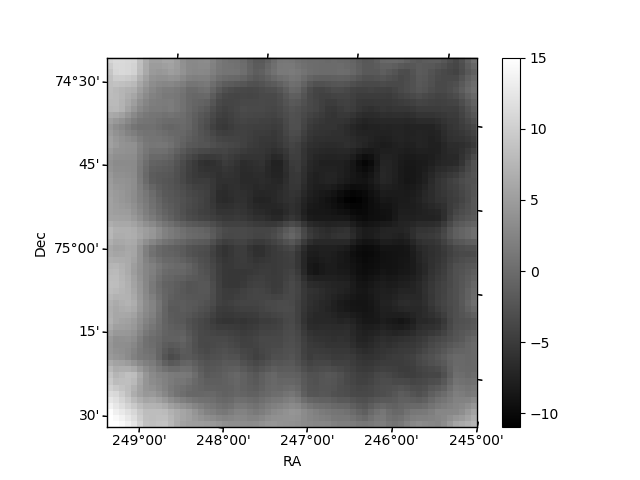
Quadrant B |
|---|---|---|---|
| Quadrant D | 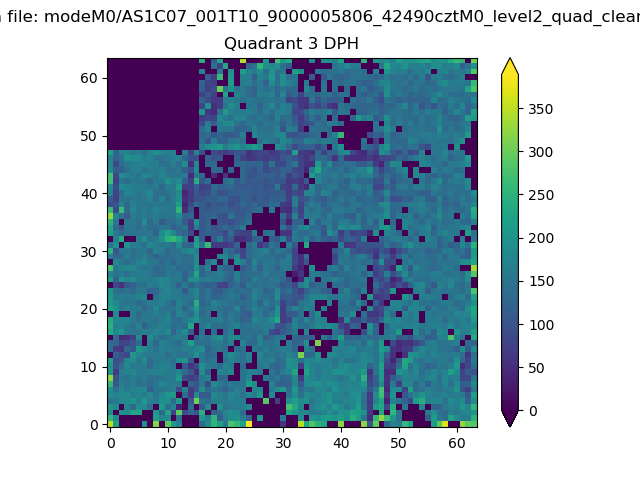 |
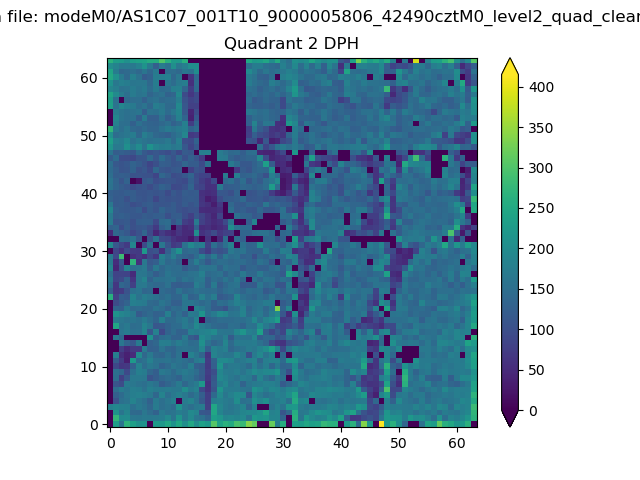 |
Quadrant C |
| Plot type | Count rate plots | Images |
|---|---|---|
| Comparison with Poisson distribution Blue bars denote a histogram of data divided into 1 sec bins. Red curve is a Poisson curve with rate = median count rate of data. |
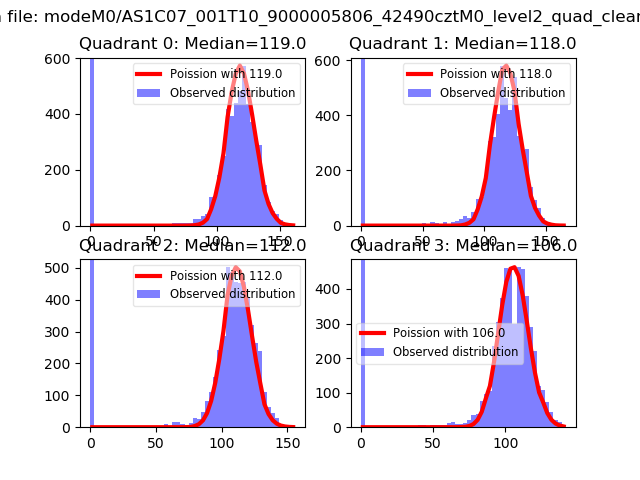 |
 |
| Quadrant-wise count rates Data is divided into 100 sec bins |
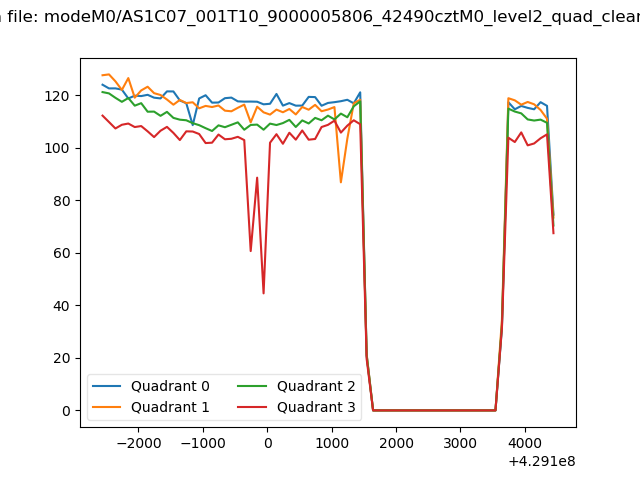 |
|
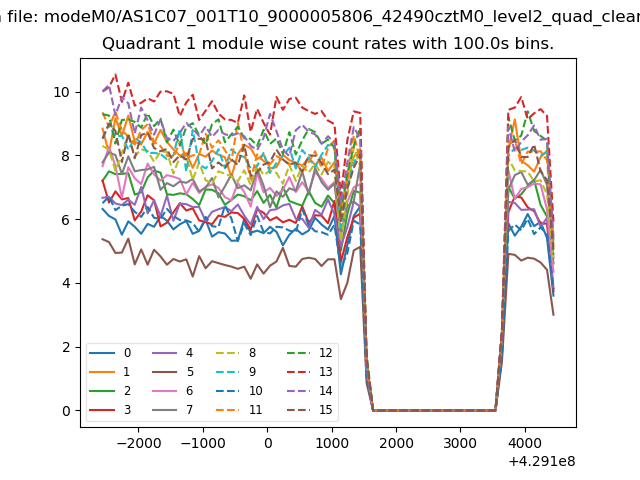
| Module-wise count rates for Quadrant A Data is divided into 100 sec bins |
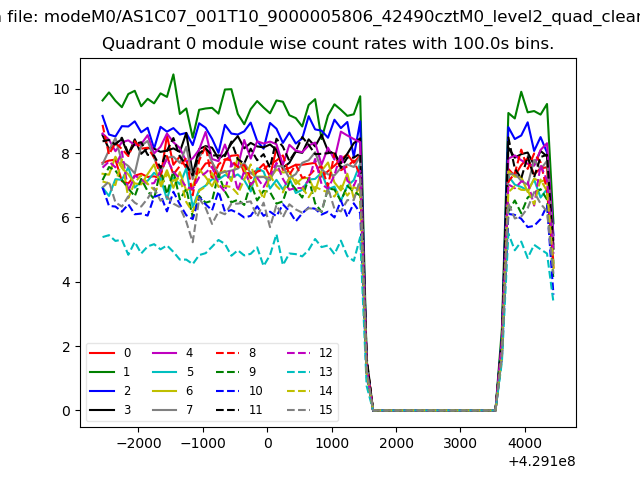 |
 |
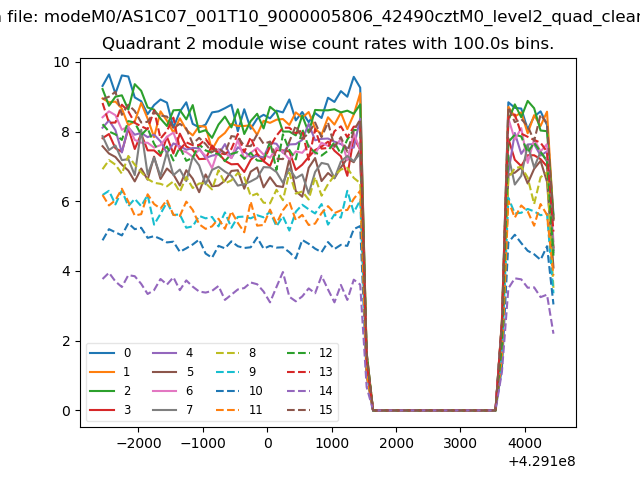
| Module-wise count rates for Quadrant B Data is divided into 100 sec bins |
 |
 |
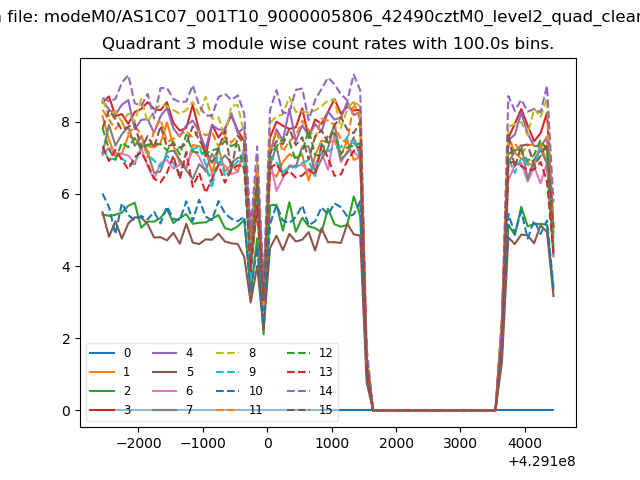
| Module-wise count rates for Quadrant C Data is divided into 100 sec bins |
 |
 |
| Module-wise count rates for Quadrant D Data is divided into 100 sec bins |
 |
 |
| Parameter | Plot |
|---|---|
| CZT HV Monitor | 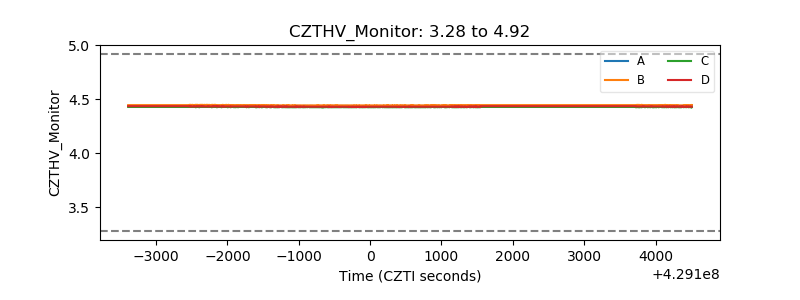 |
| D_VDD | 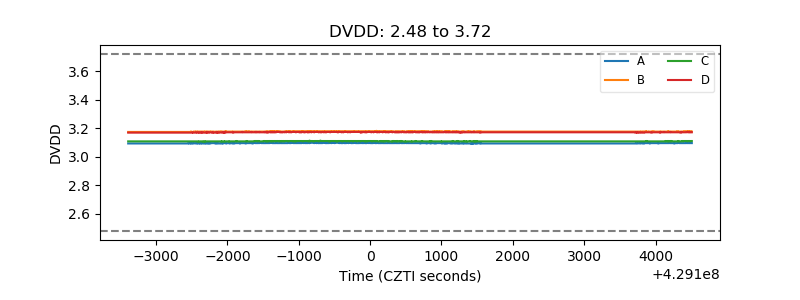 |
| Temperature 1 | 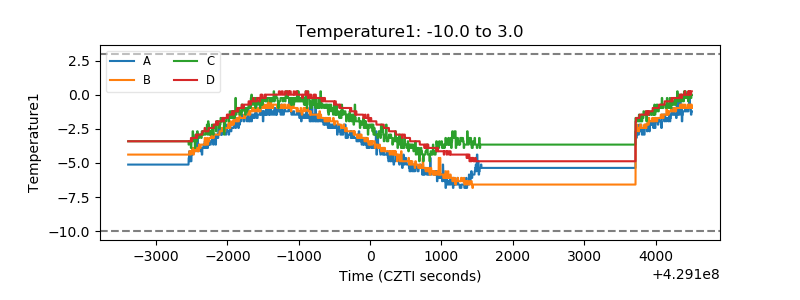 |
| Veto HV Monitor | 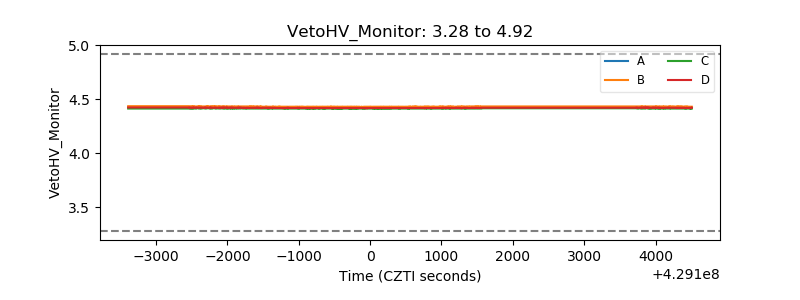 |
| Veto LLD | 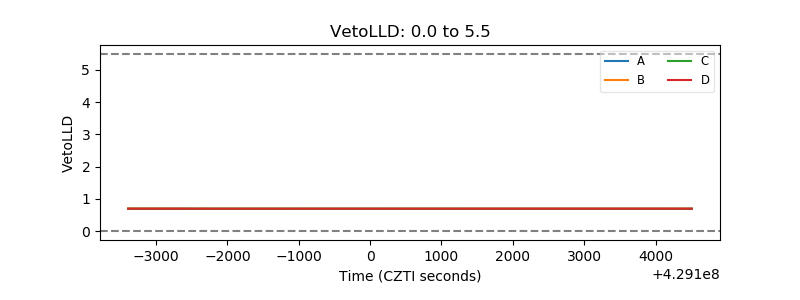 |
| Alpha Counter | 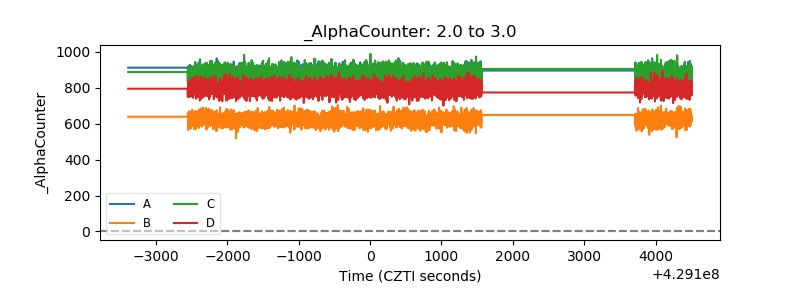 |
| _CPM_Rate | 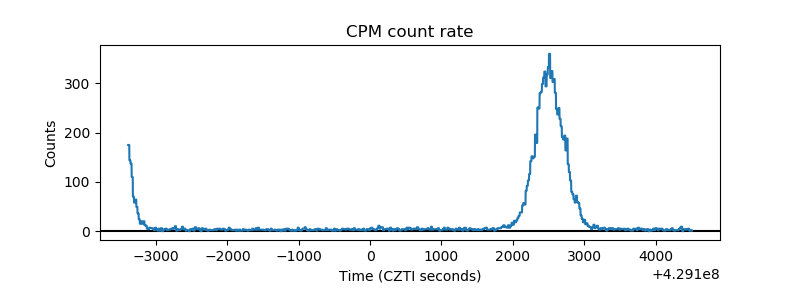 |
| CZT Counter | 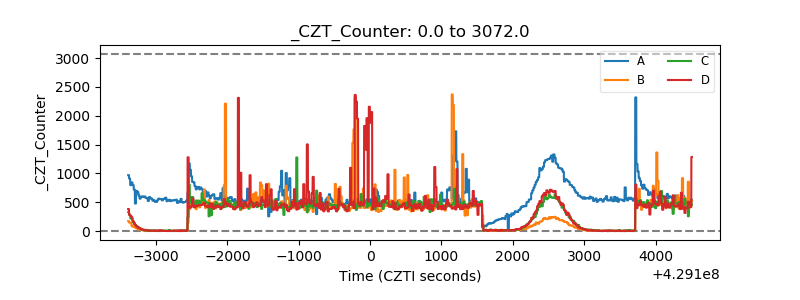 |
| +2.5 Volts monitor | 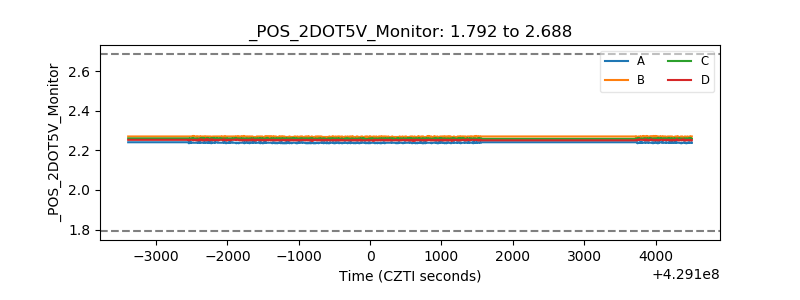 |
| +5 Volts monitor | 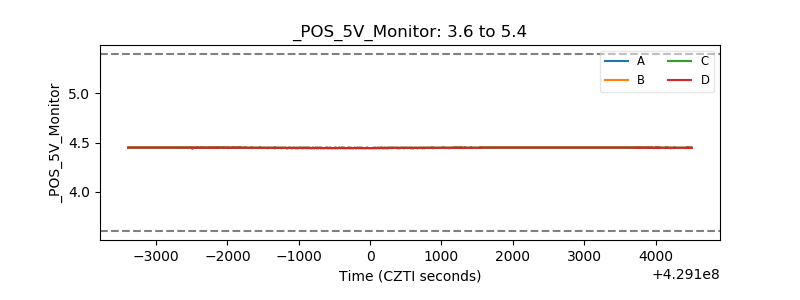 |
| _ROLL_ROT | 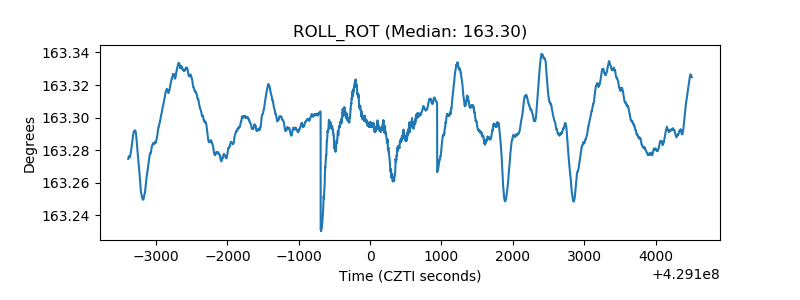 |
| _Roll_DEC | 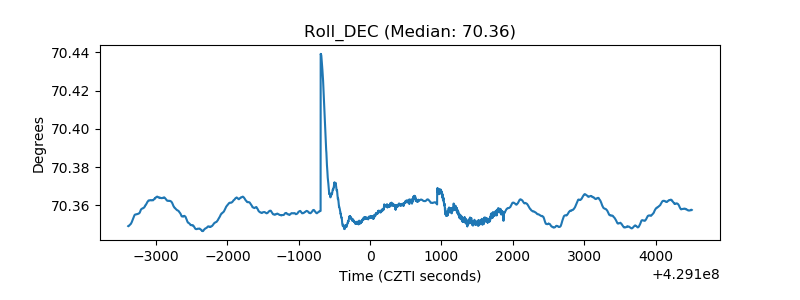 |
| _Roll_RA | 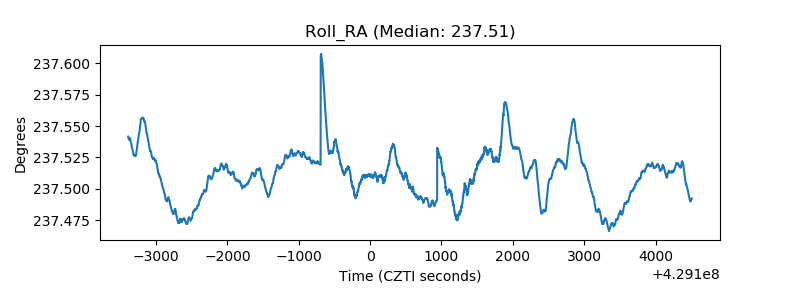 |
| Veto Counter | 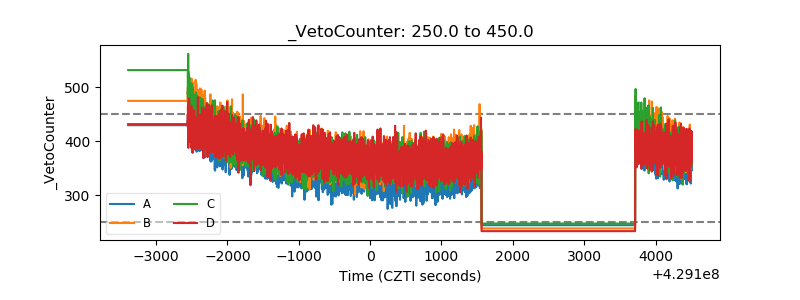 |