| Param | Original file | Final file |
|---|---|---|
| Filename | modeM0/AS1C07_001T10_9000005806_42491cztM0_level2.fits | modeM0/AS1C07_001T10_9000005806_42491cztM0_level2_quad_clean.evt |
| Size (bytes) | 337,527,360 | 86,137,920 |
| Size | 321.9 MB | 82.1 MB |
| Events in quadrant A | 2,804,745 | 594,043 |
| Events in quadrant B | 3,383,840 | 573,023 |
| Events in quadrant C | 2,587,689 | 556,727 |
| Events in quadrant D | 3,310,786 | 517,899 |
| Mode M9 | |||
|---|---|---|---|
| Quadrant | BADHDUFLAG | Total packets | Discarded packets |
| A | 0 | 20 | 0 |
| B | 0 | 20 | 0 |
| C | 0 | 20 | 0 |
| D | 0 | 20 | 0 |
| Mode SS | |||
|---|---|---|---|
| Quadrant | BADHDUFLAG | Total packets | Discarded packets |
| A | 0 | 108 | 0 |
| B | 0 | 108 | 0 |
| C | 0 | 108 | 0 |
| D | 0 | 108 | 0 |
| Mode M0 | |||
|---|---|---|---|
| Quadrant | BADHDUFLAG | Total packets | Discarded packets |
| A | 0 | 11465 | 2 |
| B | 0 | 13648 | 2 |
| C | 0 | 11166 | 2 |
| D | 0 | 13573 | 7 |
| Quadrant | Total seconds | Saturated seconds | Saturation percentage |
|---|---|---|---|
| A | 5225 | 9 | 0.172249% |
| B | 5226 | 211 | 4.037505% |
| C | 5226 | 52 | 0.995025% |
| D | 5225 | 230 | 4.401914% |
Noise dominated data is calculated using 1-second bins in cleaned event files. If a bin has >2000 counts, and if more than 50% of those come from <1% of pixels, then it is considered to be noise-dominated and hence unusable.
| Quadrant | # 1 sec bins | Bins with >0 counts | Bins with >2000 counts | High rate bins dominated by noise | Noise dominated (total time) | Noise dominated (detector-on time) | Marked lightcurve |
|---|---|---|---|---|---|---|---|
| A | 7289 | 5226 | 2 | 2 | 0.03% | 0.04% | 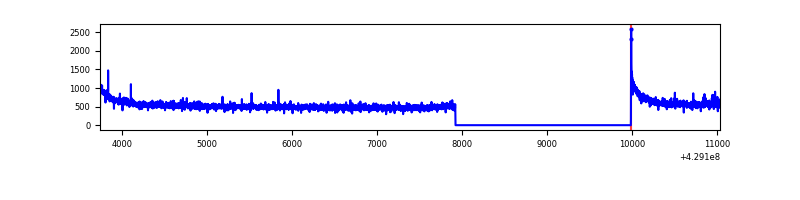 |
| B | 7290 | 5227 | 154 | 154 | 2.11% | 2.95% | 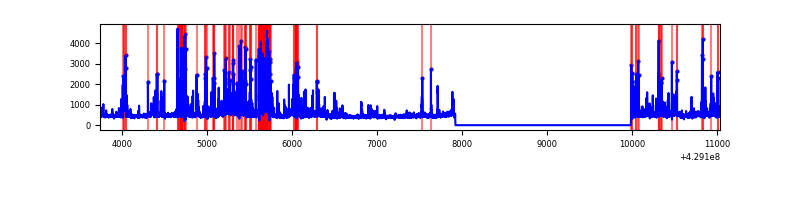 |
| C | 7290 | 5227 | 39 | 39 | 0.53% | 0.75% | 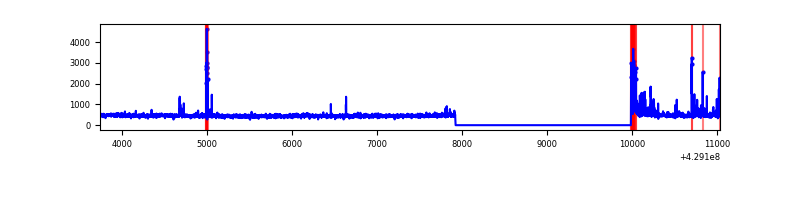 |
| D | 7288 | 5225 | 188 | 188 | 2.58% | 3.60% | 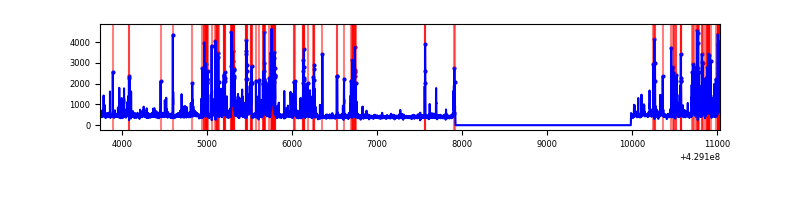 |
Top three noisy pixels from each quadrant. If the there are fewer than three noisy pixels in the level2.evt file, extra rows are filled as -1
| Pixel properties | Quadrant properties | ||||||
|---|---|---|---|---|---|---|---|
| Quadrant | DetID | PixID | Counts | Sigma | Mean | Median | Sigma |
| A | 10 | 83 | 595284 | 5210.25 | 558 | 547 | 114.1 |
| A | 12 | 189 | 29221 | 251.2 | 558 | 547 | 114.1 |
| A | 13 | 6 | 15257 | 128.86 | 558 | 547 | 114.1 |
| B | 5 | 255 | 864230 | 8363.02 | 540 | 525 | 103.3 |
| B | 0 | 229 | 185217 | 1788.32 | 540 | 525 | 103.3 |
| B | 0 | 245 | 70490 | 677.45 | 540 | 525 | 103.3 |
| C | 15 | 214 | 221538 | 1773.35 | 538 | 542 | 124.6 |
| C | 9 | 54 | 168484 | 1347.63 | 538 | 542 | 124.6 |
| C | 14 | 32 | 45715 | 362.48 | 538 | 542 | 124.6 |
| D | 10 | 118 | 523529 | 4012.42 | 539 | 525 | 130.3 |
| D | 12 | 233 | 161933 | 1238.3 | 539 | 525 | 130.3 |
| D | 5 | 32 | 95858 | 731.38 | 539 | 525 | 130.3 |
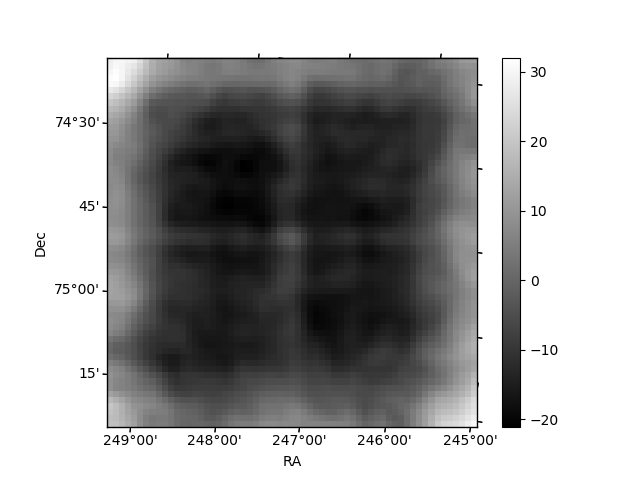
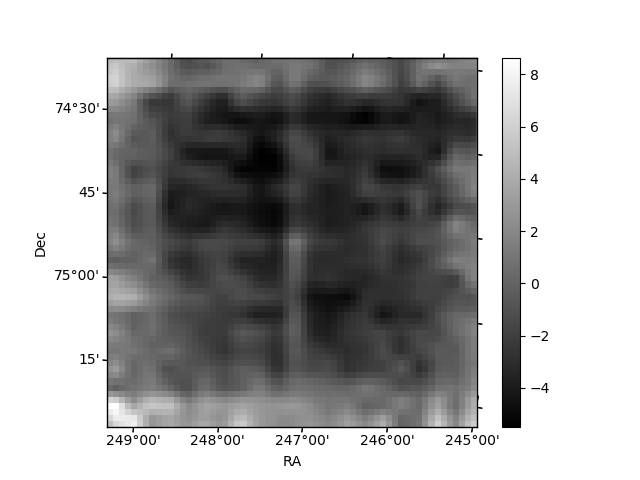
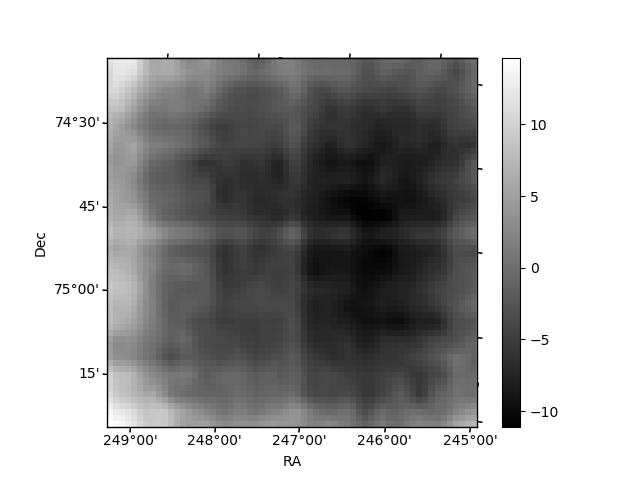
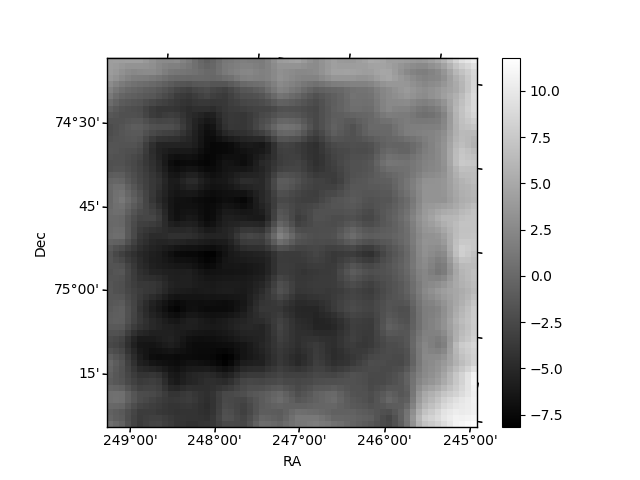
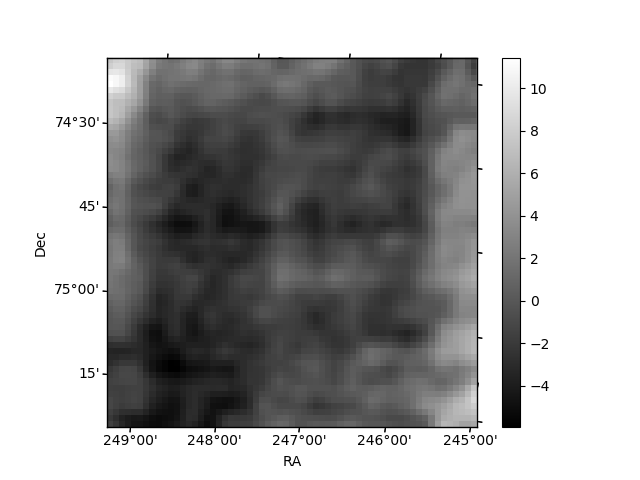
Histogram calculated using DETX and DETY for each event in the final _common_clean file
| Quadrant A | 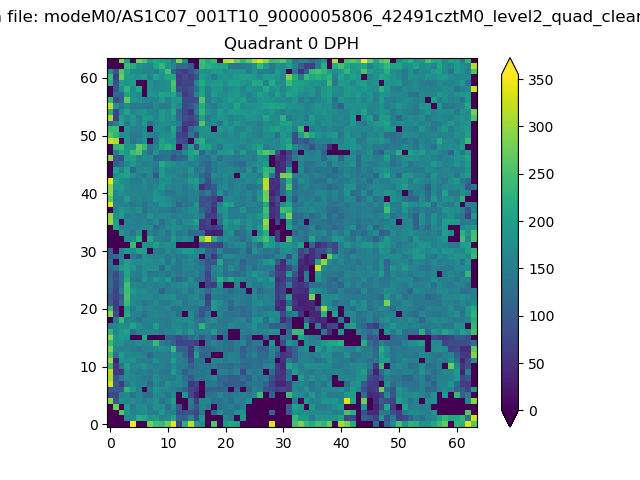 |
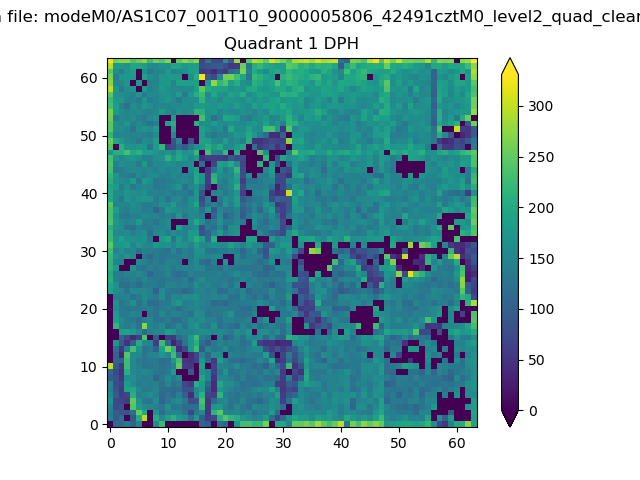 |
Quadrant B |
|---|---|---|---|
| Quadrant D | 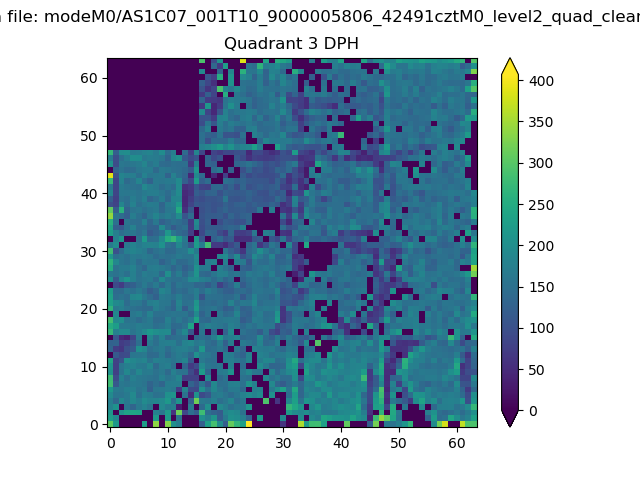 |
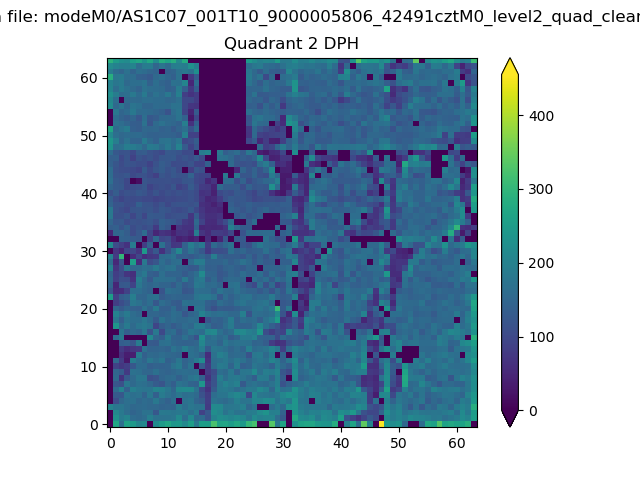 |
Quadrant C |
| Plot type | Count rate plots | Images |
|---|---|---|
| Comparison with Poisson distribution Blue bars denote a histogram of data divided into 1 sec bins. Red curve is a Poisson curve with rate = median count rate of data. |
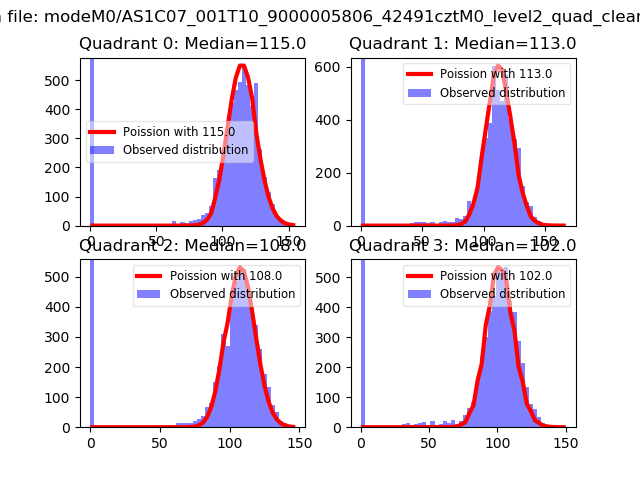 |
 |
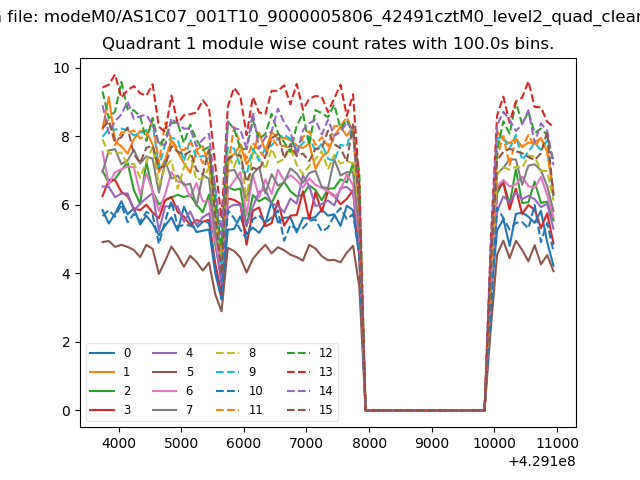
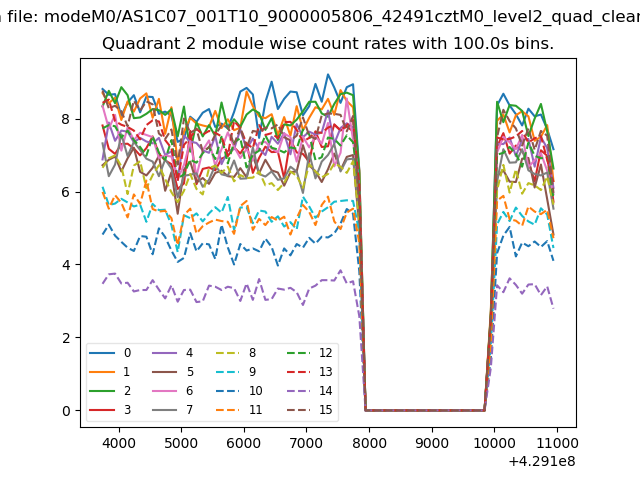
| Quadrant-wise count rates Data is divided into 100 sec bins |
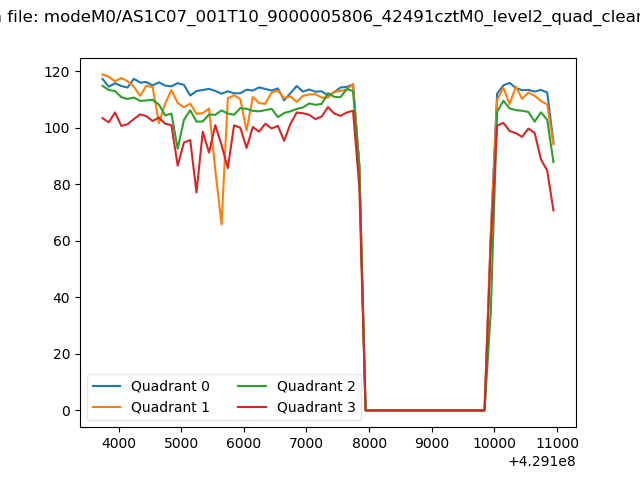 |
|
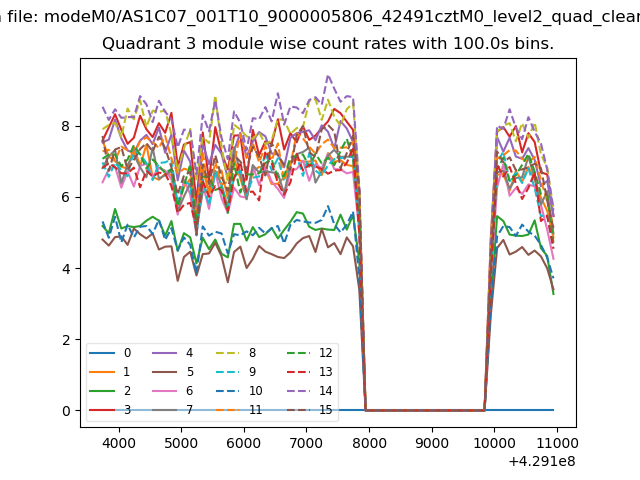
| Module-wise count rates for Quadrant A Data is divided into 100 sec bins |
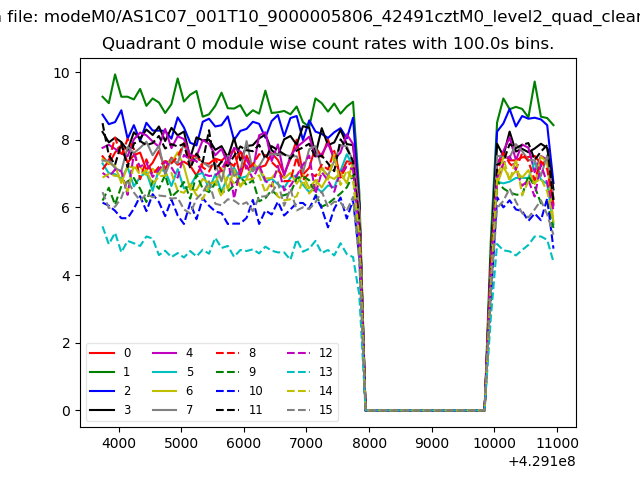 |
 |
| Module-wise count rates for Quadrant B Data is divided into 100 sec bins |
 |
 |
| Module-wise count rates for Quadrant C Data is divided into 100 sec bins |
 |
 |
| Module-wise count rates for Quadrant D Data is divided into 100 sec bins |
 |
 |
| Parameter | Plot |
|---|---|
| CZT HV Monitor | 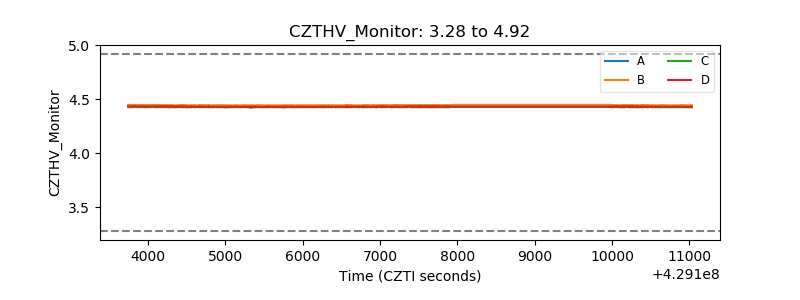 |
| D_VDD | 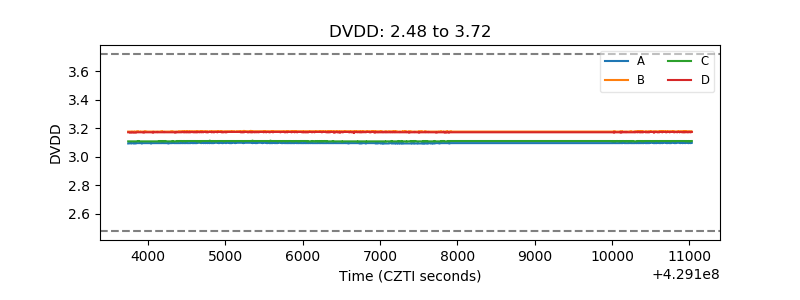 |
| Temperature 1 | 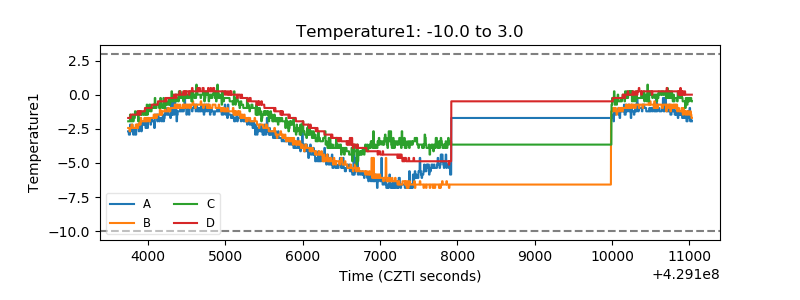 |
| Veto HV Monitor | 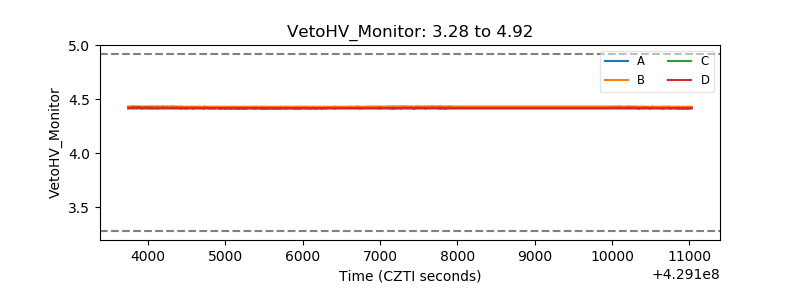 |
| Veto LLD | 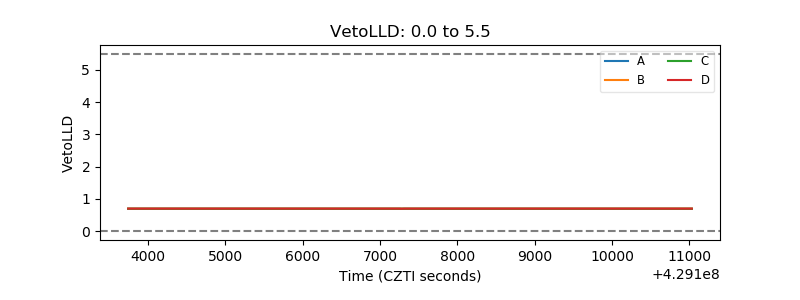 |
| Alpha Counter | 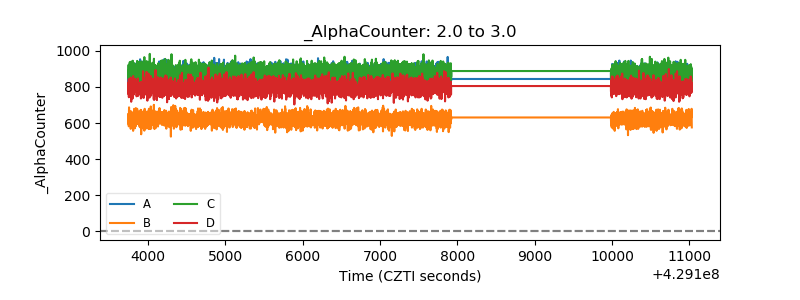 |
| _CPM_Rate | 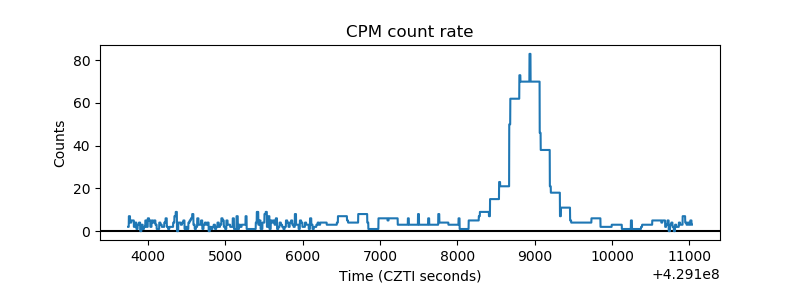 |
| CZT Counter | 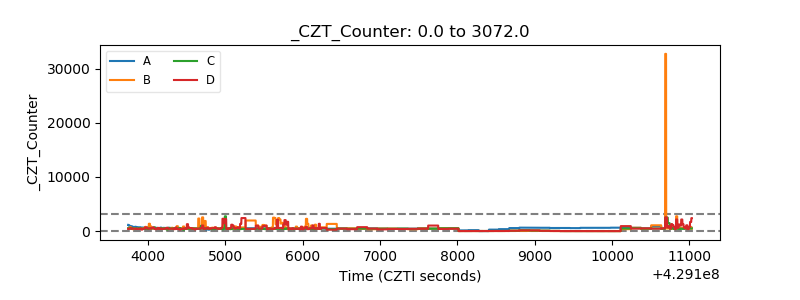 |
| +2.5 Volts monitor |  |
| +5 Volts monitor | 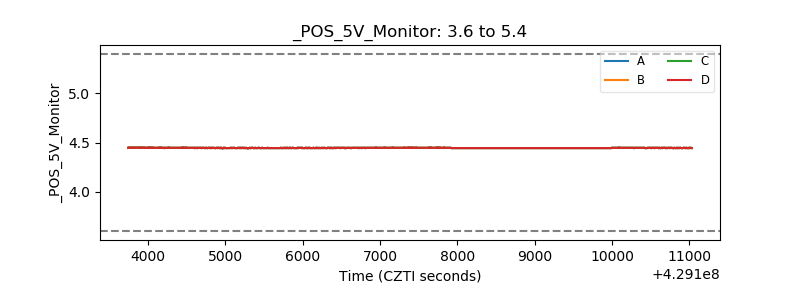 |
| _ROLL_ROT | 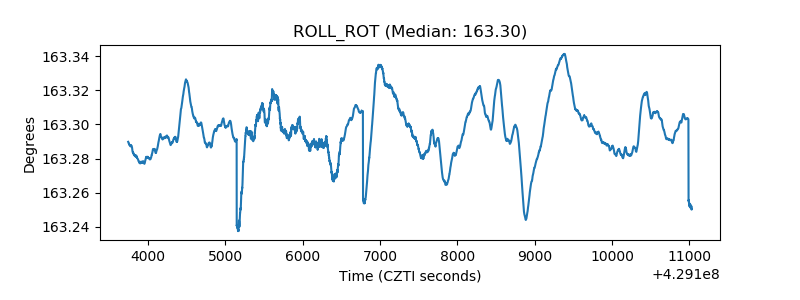 |
| _Roll_DEC | 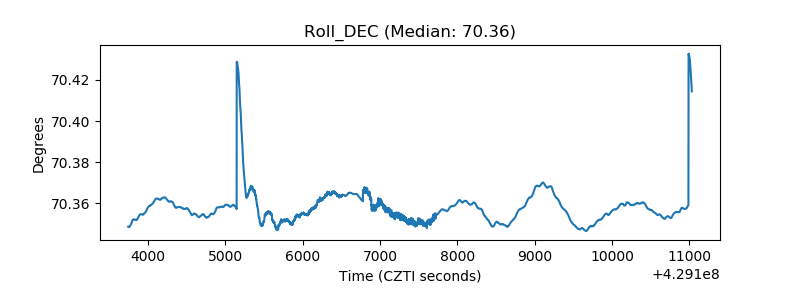 |
| _Roll_RA | 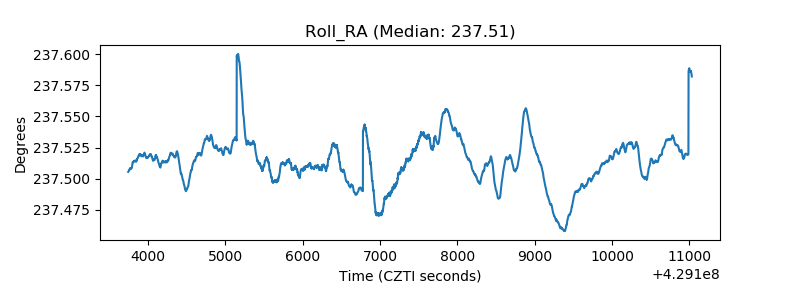 |
| Veto Counter | 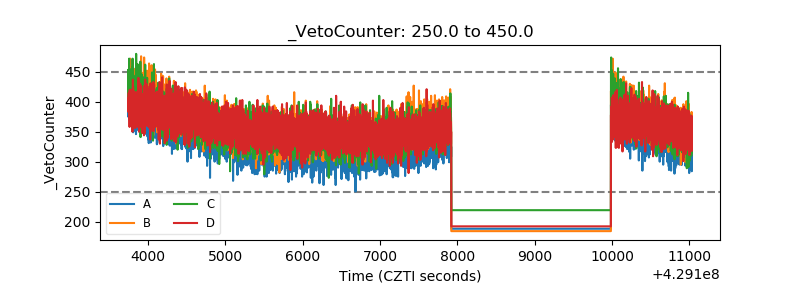 |