| Param | Original file | Final file |
|---|---|---|
| Filename | modeM0/AS1C07_001T10_9000005806_42492cztM0_level2.fits | modeM0/AS1C07_001T10_9000005806_42492cztM0_level2_quad_clean.evt |
| Size (bytes) | 366,865,920 | 87,272,640 |
| Size | 349.9 MB | 83.2 MB |
| Events in quadrant A | 2,993,776 | 603,225 |
| Events in quadrant B | 2,938,571 | 589,367 |
| Events in quadrant C | 2,949,870 | 568,425 |
| Events in quadrant D | 4,274,299 | 500,726 |
| Mode M9 | |||
|---|---|---|---|
| Quadrant | BADHDUFLAG | Total packets | Discarded packets |
| A | 0 | 18 | 0 |
| B | 0 | 19 | 0 |
| C | 0 | 19 | 0 |
| D | 0 | 19 | 0 |
| Mode SS | |||
|---|---|---|---|
| Quadrant | BADHDUFLAG | Total packets | Discarded packets |
| A | 0 | 110 | 0 |
| B | 0 | 110 | 0 |
| C | 0 | 110 | 0 |
| D | 0 | 110 | 0 |
| Mode M0 | |||
|---|---|---|---|
| Quadrant | BADHDUFLAG | Total packets | Discarded packets |
| A | 0 | 12168 | 3 |
| B | 0 | 12644 | 2 |
| C | 0 | 12358 | 2 |
| D | 0 | 16613 | 2 |
| Quadrant | Total seconds | Saturated seconds | Saturation percentage |
|---|---|---|---|
| A | 5440 | 13 | 0.238971% |
| B | 5440 | 94 | 1.727941% |
| C | 5440 | 63 | 1.158088% |
| D | 5440 | 549 | 10.091912% |
Noise dominated data is calculated using 1-second bins in cleaned event files. If a bin has >2000 counts, and if more than 50% of those come from <1% of pixels, then it is considered to be noise-dominated and hence unusable.
| Quadrant | # 1 sec bins | Bins with >0 counts | Bins with >2000 counts | High rate bins dominated by noise | Noise dominated (total time) | Noise dominated (detector-on time) | Marked lightcurve |
|---|---|---|---|---|---|---|---|
| A | 7173 | 5441 | 3 | 3 | 0.04% | 0.06% | 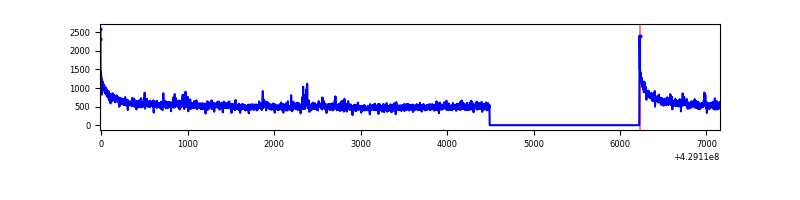 |
| B | 7173 | 5441 | 71 | 71 | 0.99% | 1.30% | 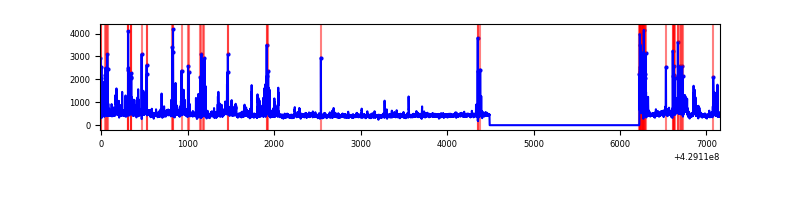 |
| C | 7173 | 5441 | 48 | 48 | 0.67% | 0.88% | 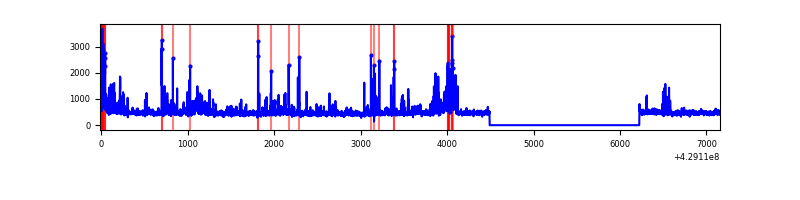 |
| D | 7173 | 5441 | 455 | 455 | 6.34% | 8.36% | 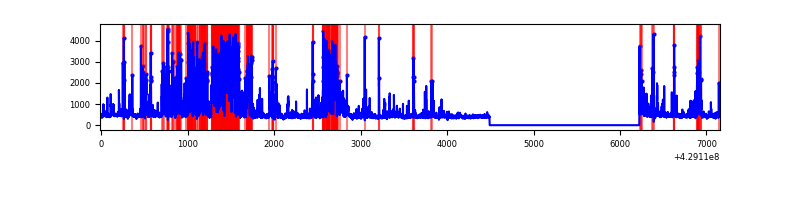 |
Top three noisy pixels from each quadrant. If the there are fewer than three noisy pixels in the level2.evt file, extra rows are filled as -1
| Pixel properties | Quadrant properties | ||||||
|---|---|---|---|---|---|---|---|
| Quadrant | DetID | PixID | Counts | Sigma | Mean | Median | Sigma |
| A | 10 | 83 | 637264 | 5447.65 | 573 | 560 | 116.9 |
| A | 12 | 189 | 108173 | 920.74 | 573 | 560 | 116.9 |
| A | 13 | 6 | 17005 | 140.7 | 573 | 560 | 116.9 |
| B | 5 | 255 | 460383 | 4249.47 | 560 | 545 | 108.2 |
| B | 0 | 229 | 85390 | 784.07 | 560 | 545 | 108.2 |
| B | 5 | 172 | 68124 | 624.51 | 560 | 545 | 108.2 |
| C | 14 | 254 | 258016 | 1989.14 | 553 | 556 | 129.4 |
| C | 9 | 54 | 243532 | 1877.23 | 553 | 556 | 129.4 |
| C | 15 | 214 | 229487 | 1768.72 | 553 | 556 | 129.4 |
| D | 12 | 233 | 1109435 | 8477.42 | 538 | 523 | 130.8 |
| D | 10 | 118 | 634203 | 4844.36 | 538 | 523 | 130.8 |
| D | 13 | 171 | 77147 | 585.78 | 538 | 523 | 130.8 |
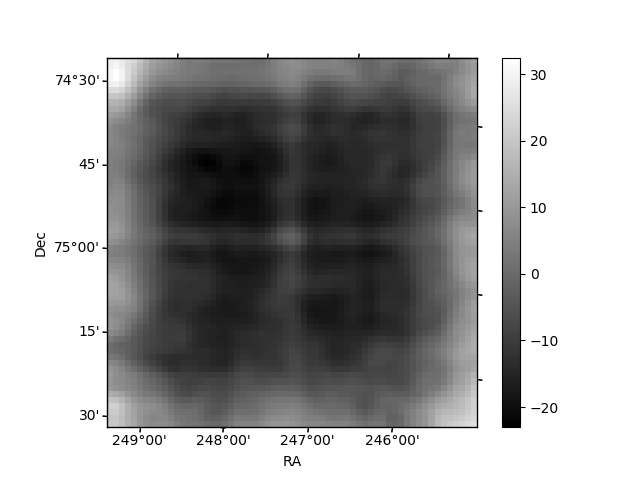
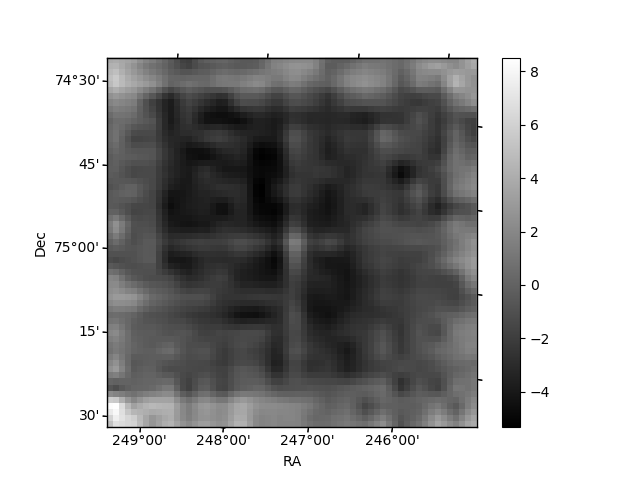
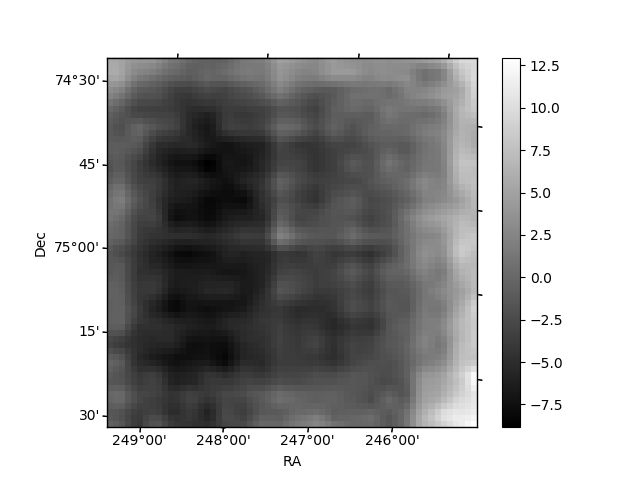
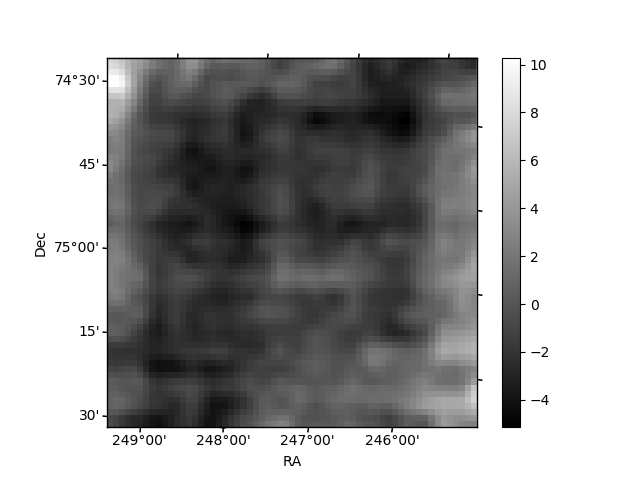
Histogram calculated using DETX and DETY for each event in the final _common_clean file
| Quadrant A | 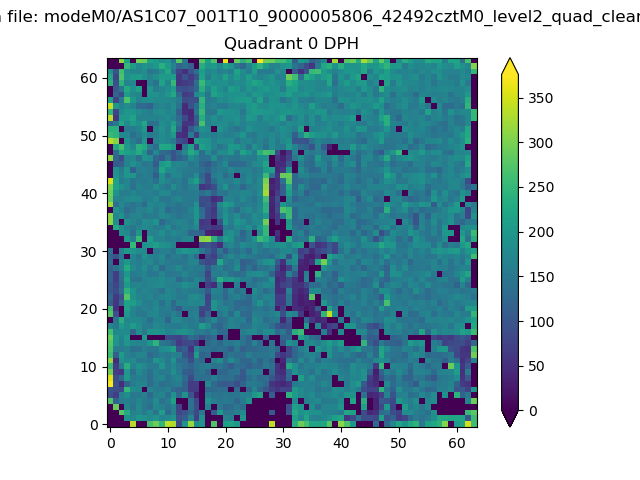 |
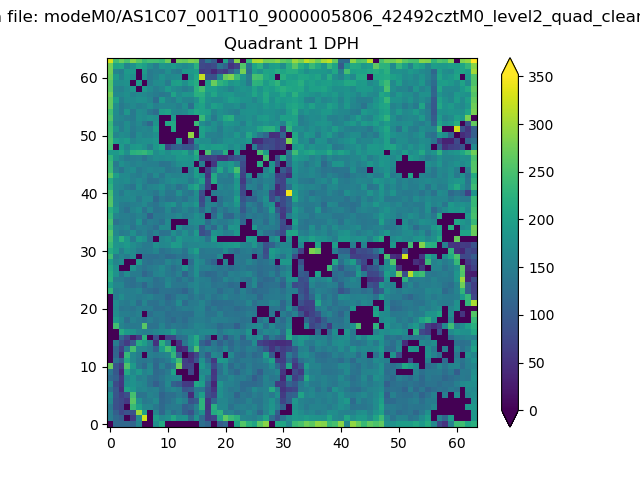 |
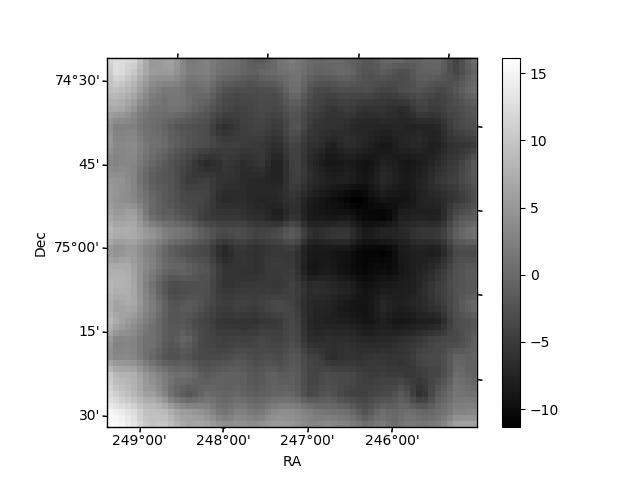
Quadrant B |
|---|---|---|---|
| Quadrant D | 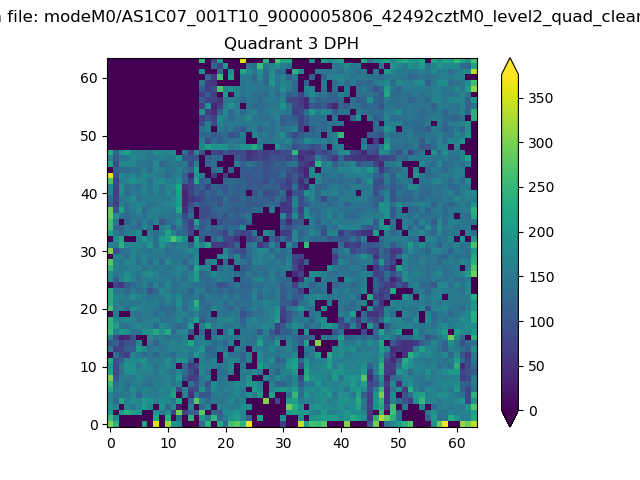 |
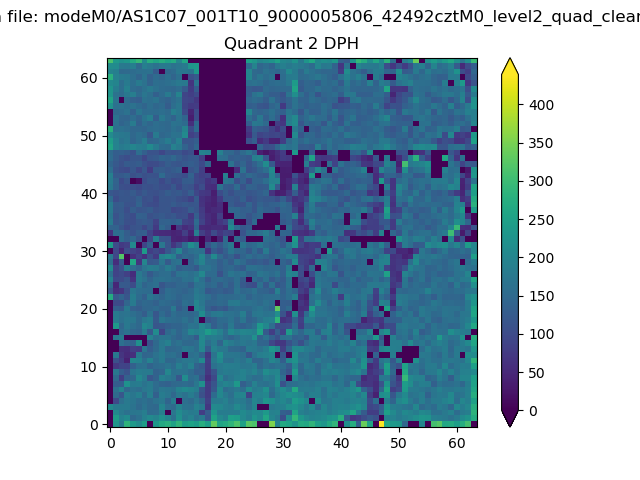 |
Quadrant C |
| Plot type | Count rate plots | Images |
|---|---|---|
| Comparison with Poisson distribution Blue bars denote a histogram of data divided into 1 sec bins. Red curve is a Poisson curve with rate = median count rate of data. |
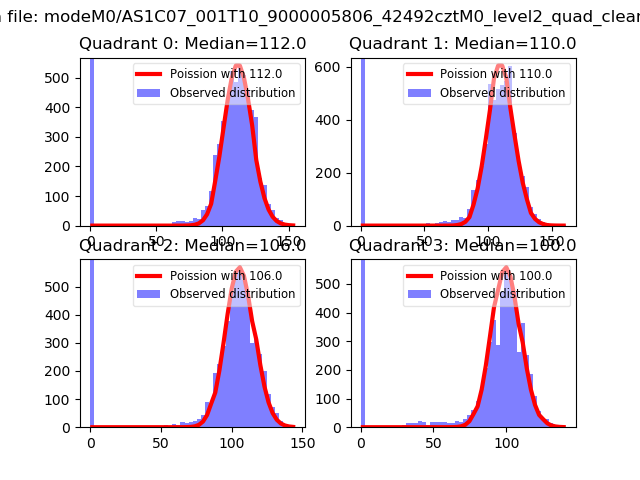 |
 |
| Quadrant-wise count rates Data is divided into 100 sec bins |
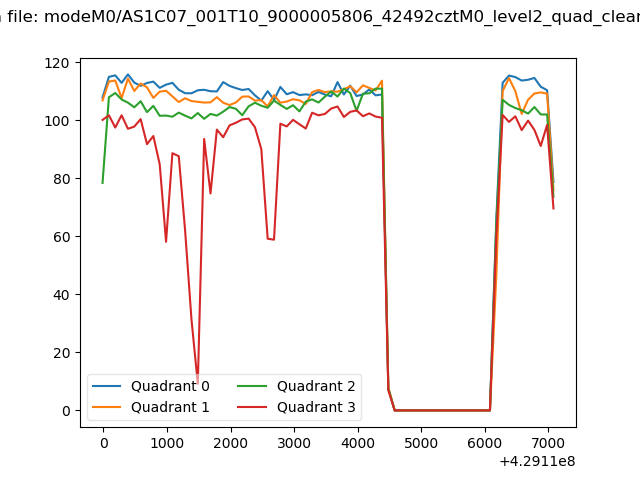 |
|
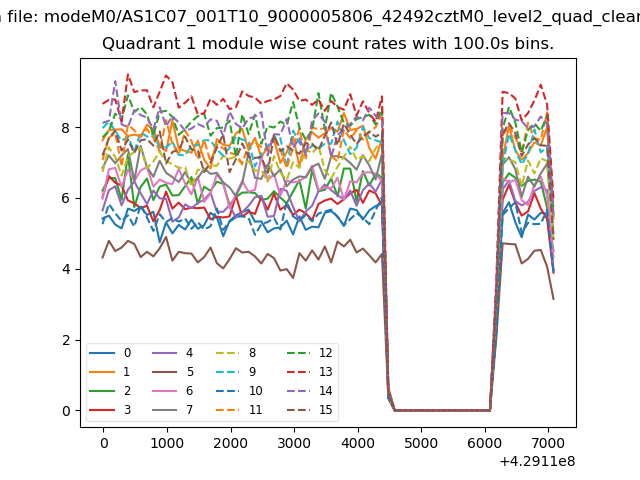
| Module-wise count rates for Quadrant A Data is divided into 100 sec bins |
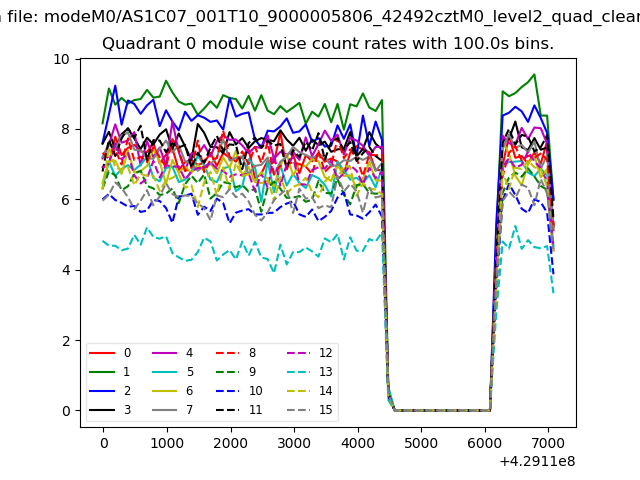 |
 |
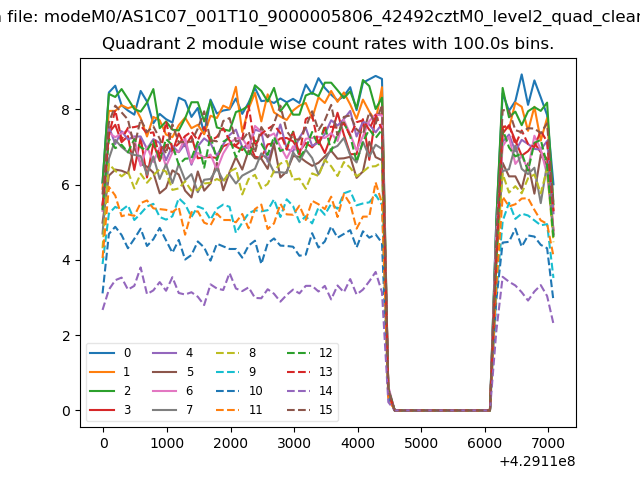
| Module-wise count rates for Quadrant B Data is divided into 100 sec bins |
 |
 |
| Module-wise count rates for Quadrant C Data is divided into 100 sec bins |
 |
 |
| Module-wise count rates for Quadrant D Data is divided into 100 sec bins |
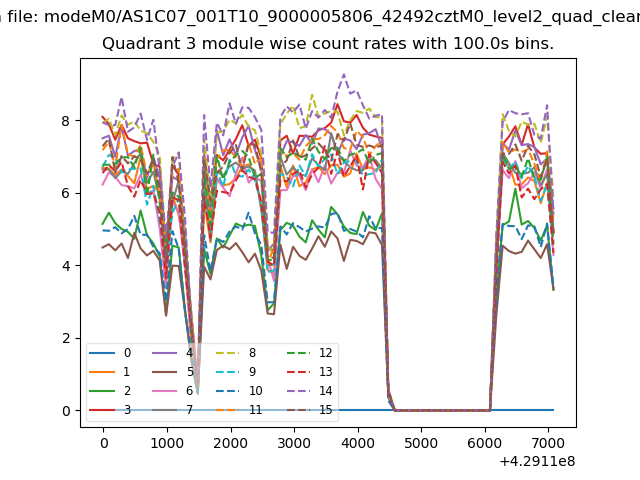 |
 |
| Parameter | Plot |
|---|---|
| CZT HV Monitor | 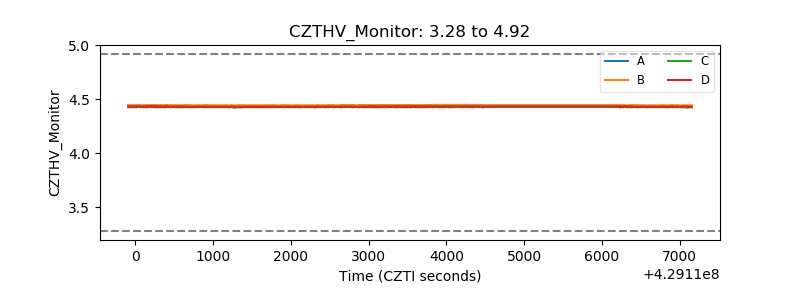 |
| D_VDD | 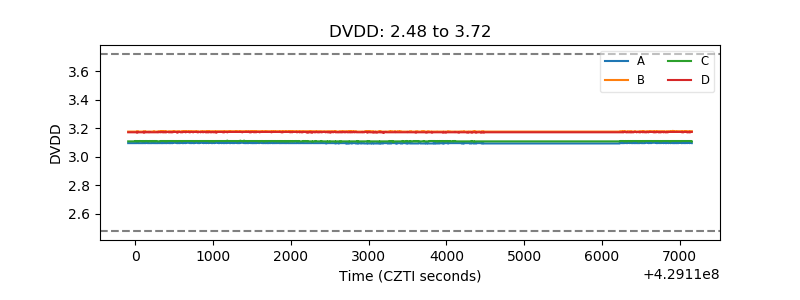 |
| Temperature 1 | 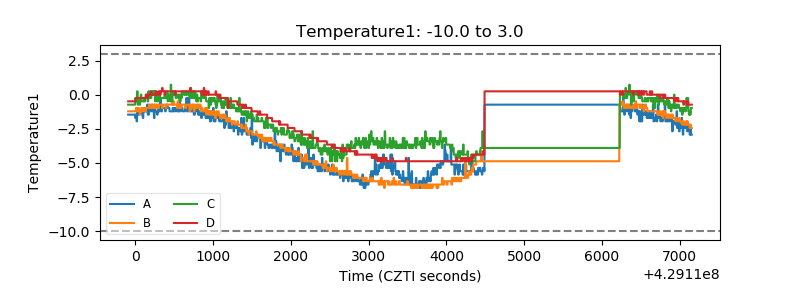 |
| Veto HV Monitor | 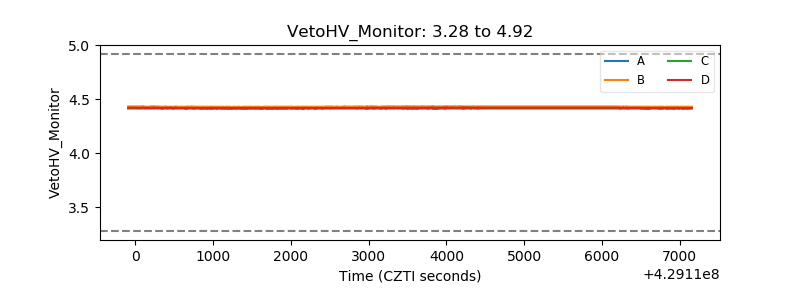 |
| Veto LLD | 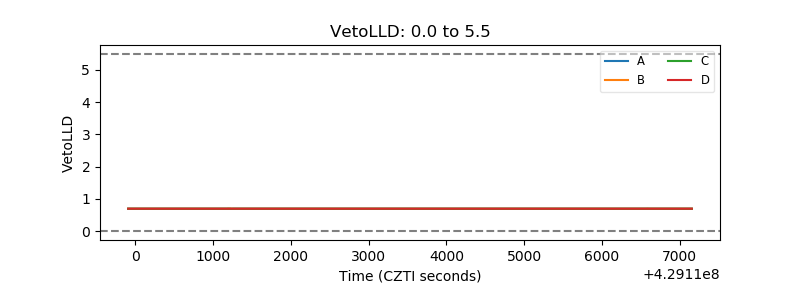 |
| Alpha Counter |  |
| _CPM_Rate | 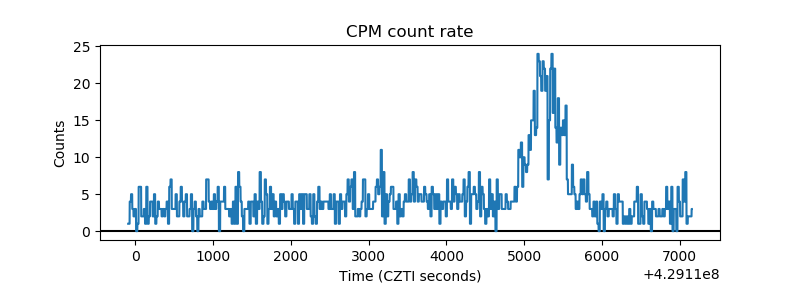 |
| CZT Counter | 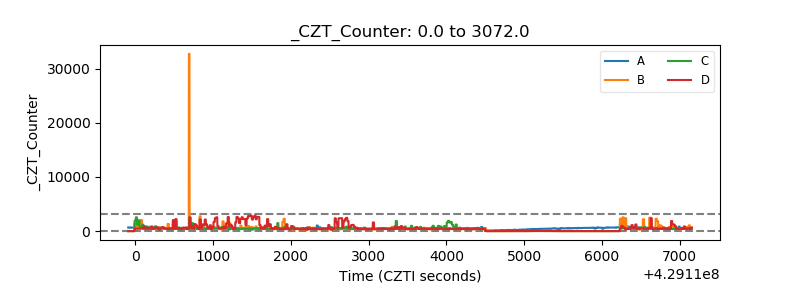 |
| +2.5 Volts monitor | 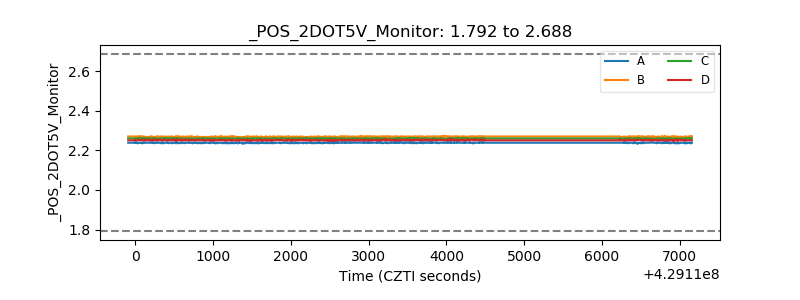 |
| +5 Volts monitor | 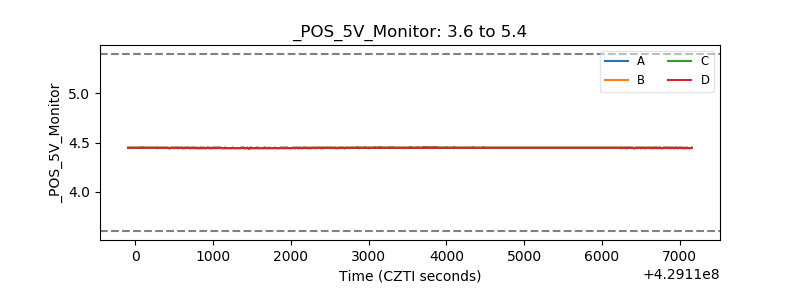 |
| _ROLL_ROT | 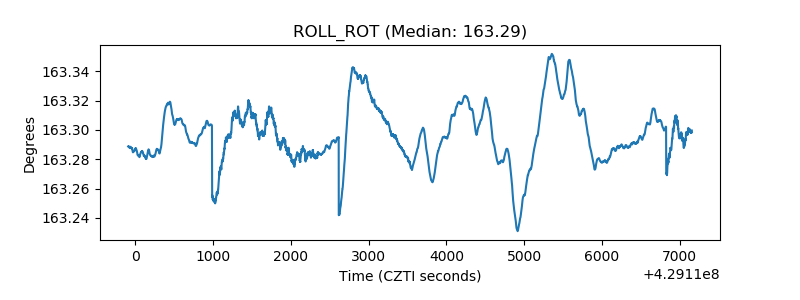 |
| _Roll_DEC |  |
| _Roll_RA | 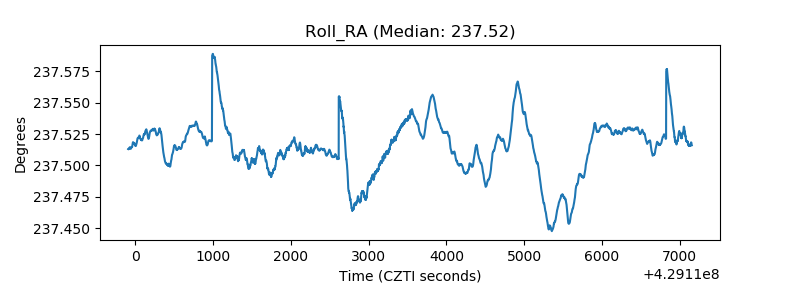 |
| Veto Counter | 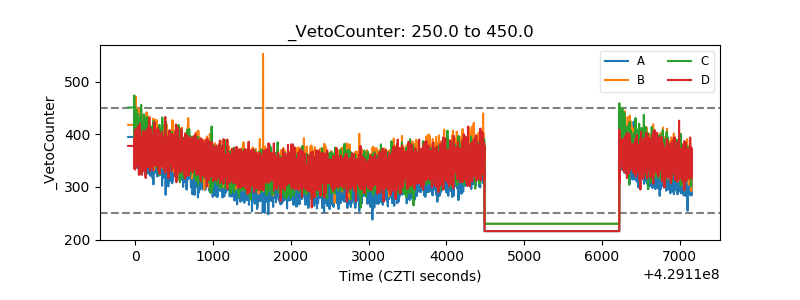 |