| Param | Original file | Final file |
|---|---|---|
| Filename | modeM0/AS1C07_001T10_9000005806_42494cztM0_level2.fits | modeM0/AS1C07_001T10_9000005806_42494cztM0_level2_quad_clean.evt |
| Size (bytes) | 374,892,480 | 90,236,160 |
| Size | 357.5 MB | 86.1 MB |
| Events in quadrant A | 3,068,554 | 617,171 |
| Events in quadrant B | 3,393,672 | 607,281 |
| Events in quadrant C | 2,720,527 | 599,785 |
| Events in quadrant D | 4,246,083 | 505,141 |
| Mode M9 | |||
|---|---|---|---|
| Quadrant | BADHDUFLAG | Total packets | Discarded packets |
| A | 0 | 19 | 0 |
| B | 0 | 20 | 0 |
| C | 0 | 20 | 0 |
| D | 0 | 20 | 0 |
| Mode SS | |||
|---|---|---|---|
| Quadrant | BADHDUFLAG | Total packets | Discarded packets |
| A | 0 | 118 | 0 |
| B | 0 | 118 | 0 |
| C | 0 | 118 | 0 |
| D | 0 | 118 | 0 |
| Mode M0 | |||
|---|---|---|---|
| Quadrant | BADHDUFLAG | Total packets | Discarded packets |
| A | 0 | 12586 | 2 |
| B | 0 | 14251 | 2 |
| C | 0 | 11885 | 2 |
| D | 0 | 16909 | 2 |
| Quadrant | Total seconds | Saturated seconds | Saturation percentage |
|---|---|---|---|
| A | 5759 | 14 | 0.243098% |
| B | 5759 | 159 | 2.760896% |
| C | 5758 | 5 | 0.086836% |
| D | 5758 | 653 | 11.340743% |
Noise dominated data is calculated using 1-second bins in cleaned event files. If a bin has >2000 counts, and if more than 50% of those come from <1% of pixels, then it is considered to be noise-dominated and hence unusable.
| Quadrant | # 1 sec bins | Bins with >0 counts | Bins with >2000 counts | High rate bins dominated by noise | Noise dominated (total time) | Noise dominated (detector-on time) | Marked lightcurve |
|---|---|---|---|---|---|---|---|
| A | 7071 | 5760 | 7 | 7 | 0.10% | 0.12% | 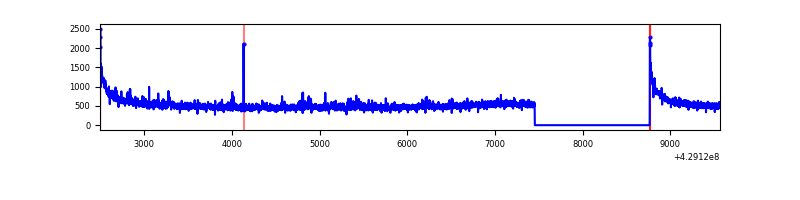 |
| B | 7071 | 5760 | 116 | 116 | 1.64% | 2.01% | 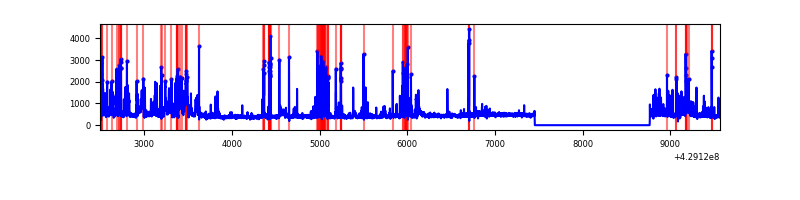 |
| C | 7070 | 5759 | 4 | 4 | 0.06% | 0.07% | 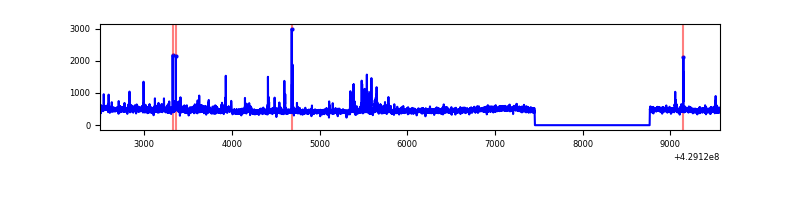 |
| D | 7070 | 5759 | 570 | 570 | 8.06% | 9.90% | 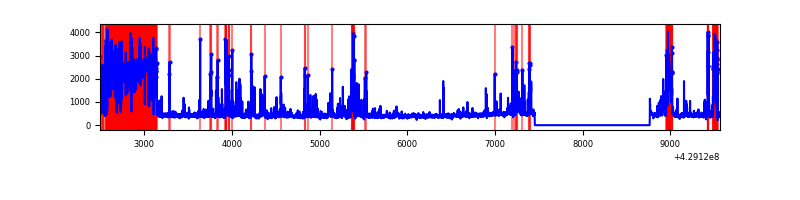 |
Top three noisy pixels from each quadrant. If the there are fewer than three noisy pixels in the level2.evt file, extra rows are filled as -1
| Pixel properties | Quadrant properties | ||||||
|---|---|---|---|---|---|---|---|
| Quadrant | DetID | PixID | Counts | Sigma | Mean | Median | Sigma |
| A | 10 | 83 | 622623 | 5028.53 | 603 | 591 | 123.7 |
| A | 12 | 189 | 82319 | 660.69 | 603 | 591 | 123.7 |
| A | 13 | 6 | 17039 | 132.97 | 603 | 591 | 123.7 |
| B | 5 | 255 | 693401 | 6161.91 | 591 | 574 | 112.4 |
| B | 10 | 246 | 130527 | 1155.78 | 591 | 574 | 112.4 |
| B | 5 | 172 | 86785 | 766.75 | 591 | 574 | 112.4 |
| C | 15 | 214 | 238096 | 1715.02 | 590 | 592 | 138.5 |
| C | 9 | 54 | 124021 | 891.28 | 590 | 592 | 138.5 |
| C | 14 | 254 | 32286 | 228.86 | 590 | 592 | 138.5 |
| D | 9 | 19 | 743843 | 5476.83 | 553 | 536 | 135.7 |
| D | 2 | 249 | 689582 | 5077.03 | 553 | 536 | 135.7 |
| D | 10 | 118 | 320716 | 2359.15 | 553 | 536 | 135.7 |
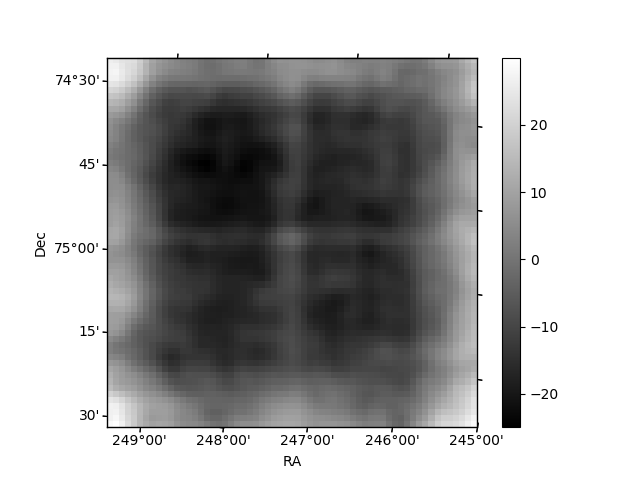
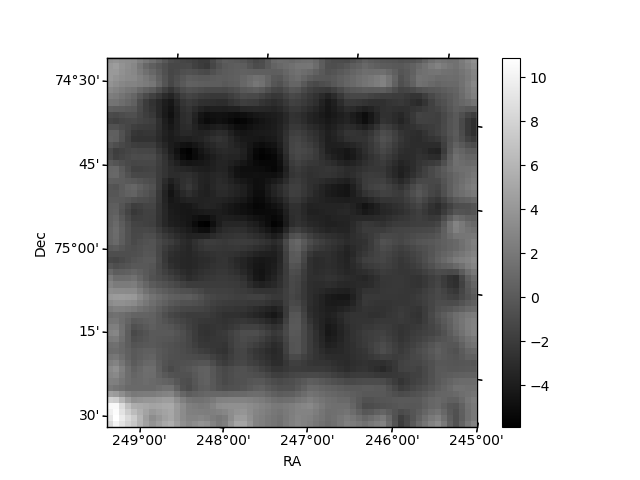
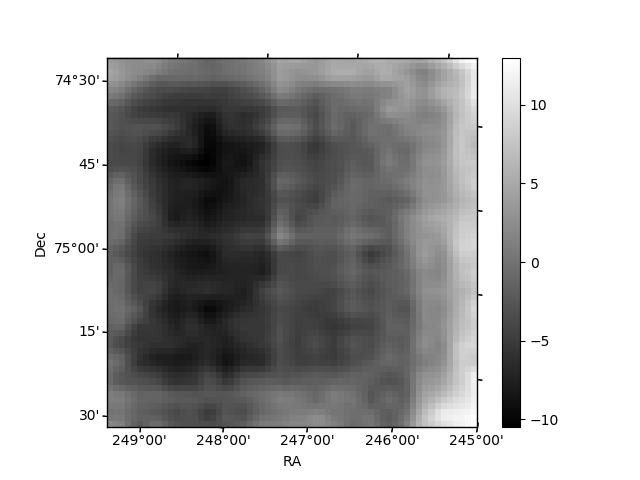
Histogram calculated using DETX and DETY for each event in the final _common_clean file
| Quadrant A | 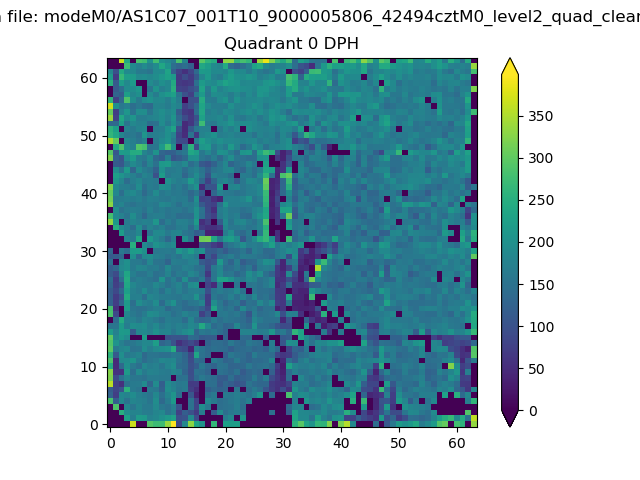 |
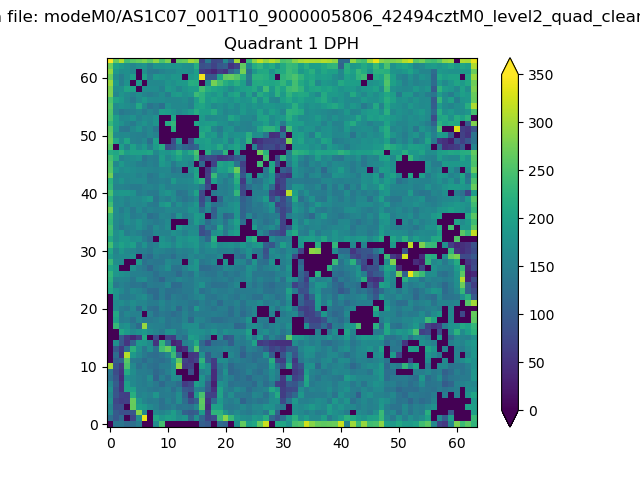 |
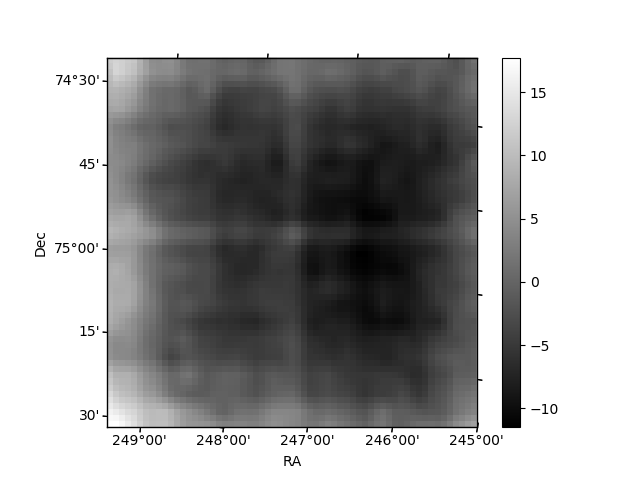
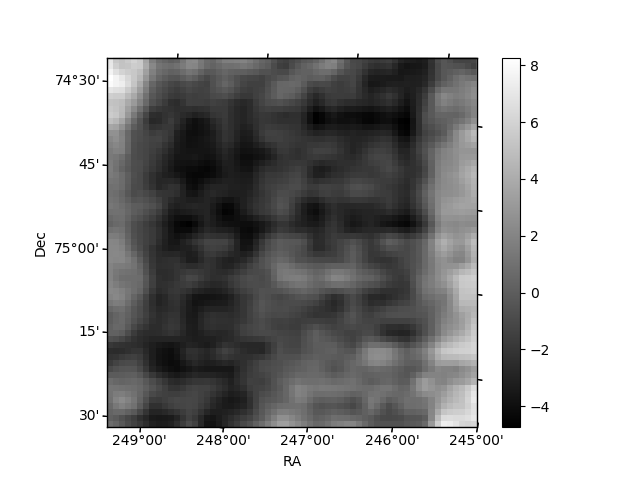
Quadrant B |
|---|---|---|---|
| Quadrant D | 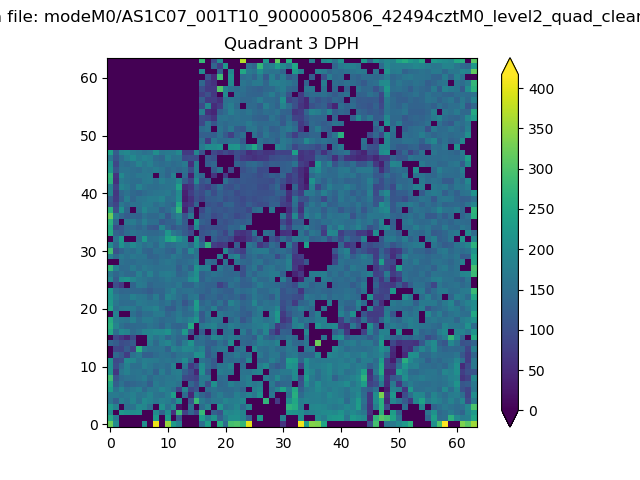 |
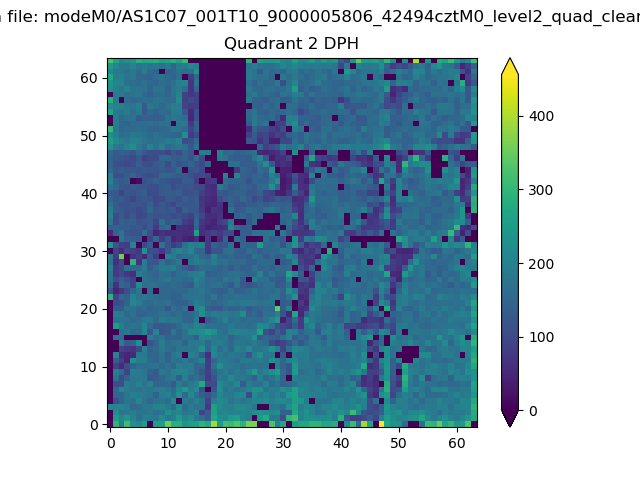 |
Quadrant C |
| Plot type | Count rate plots | Images |
|---|---|---|
| Comparison with Poisson distribution Blue bars denote a histogram of data divided into 1 sec bins. Red curve is a Poisson curve with rate = median count rate of data. |
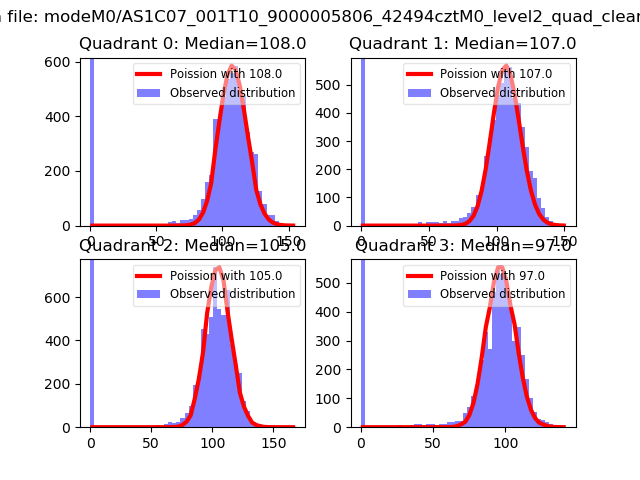 |
 |
| Quadrant-wise count rates Data is divided into 100 sec bins |
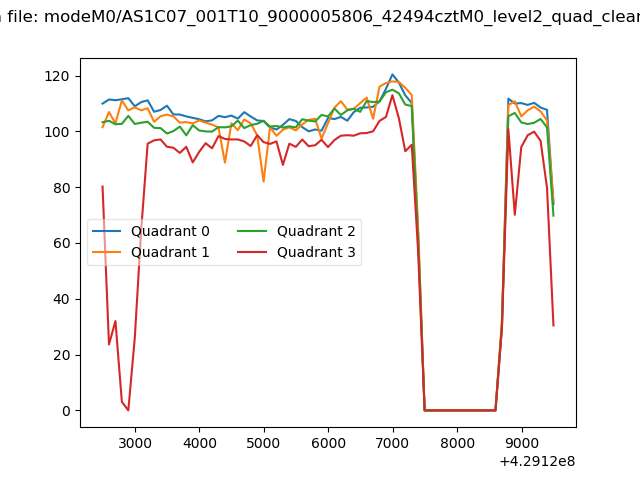 |
|
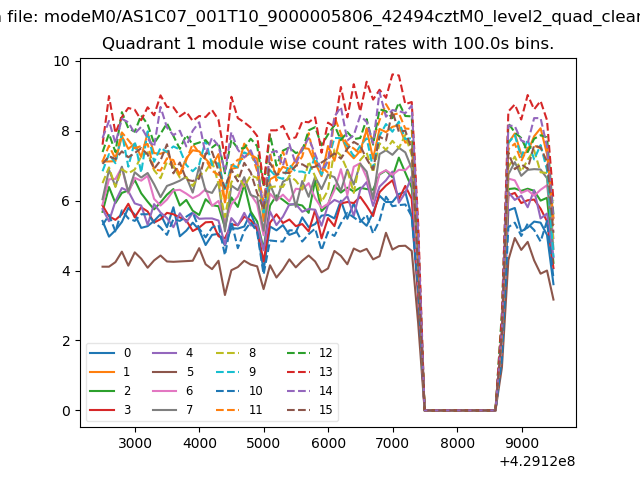
| Module-wise count rates for Quadrant A Data is divided into 100 sec bins |
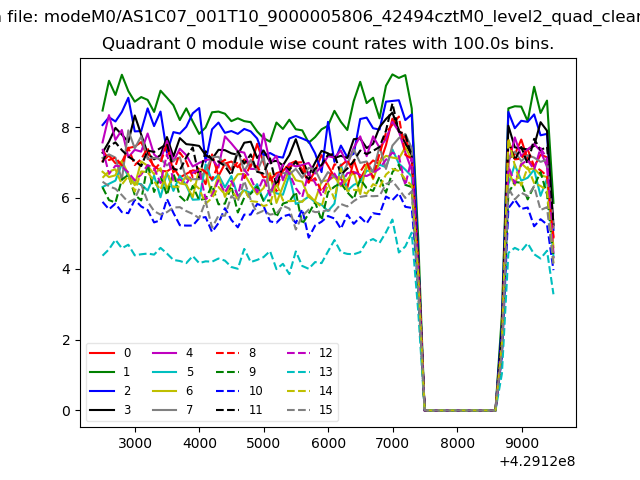 |
 |
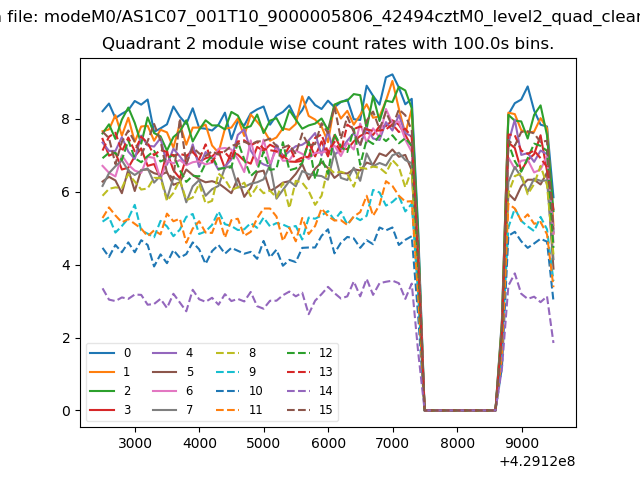
| Module-wise count rates for Quadrant B Data is divided into 100 sec bins |
 |
 |
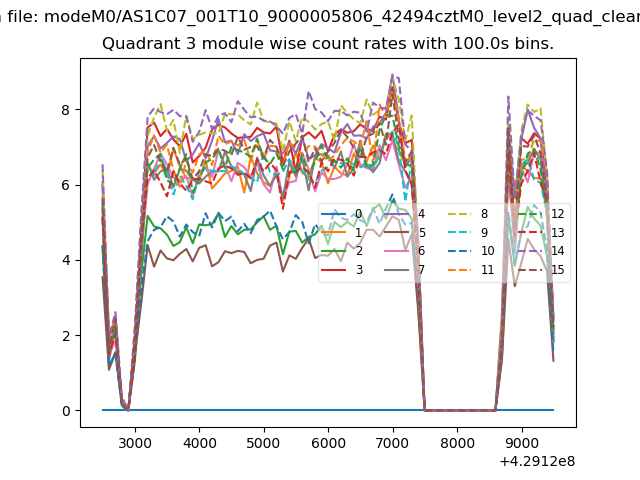
| Module-wise count rates for Quadrant C Data is divided into 100 sec bins |
 |
 |
| Module-wise count rates for Quadrant D Data is divided into 100 sec bins |
 |
 |
| Parameter | Plot |
|---|---|
| CZT HV Monitor |  |
| D_VDD | 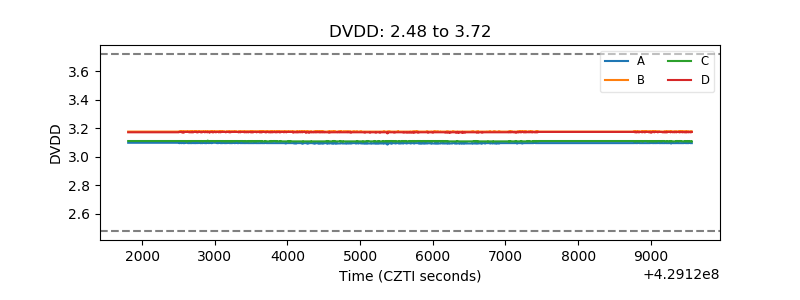 |
| Temperature 1 | 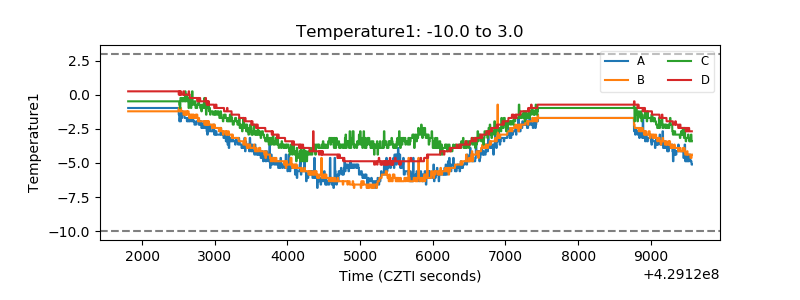 |
| Veto HV Monitor | 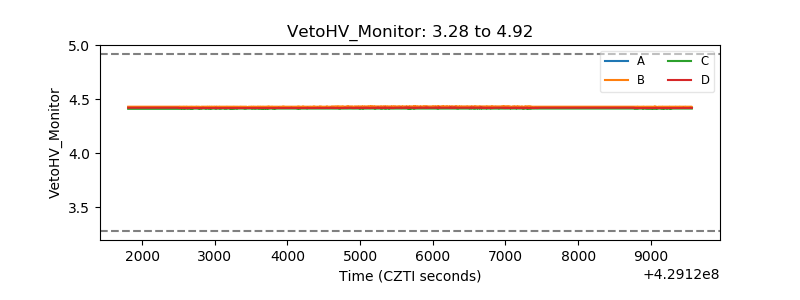 |
| Veto LLD | 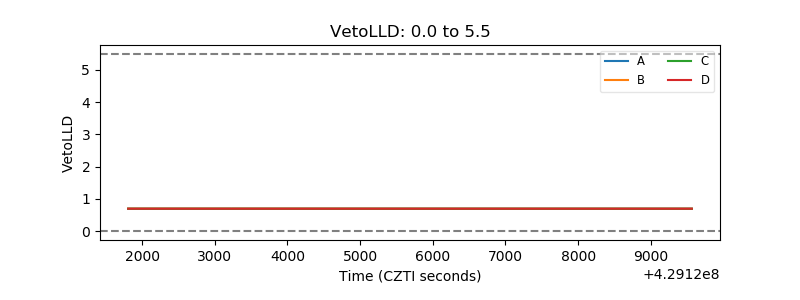 |
| Alpha Counter | 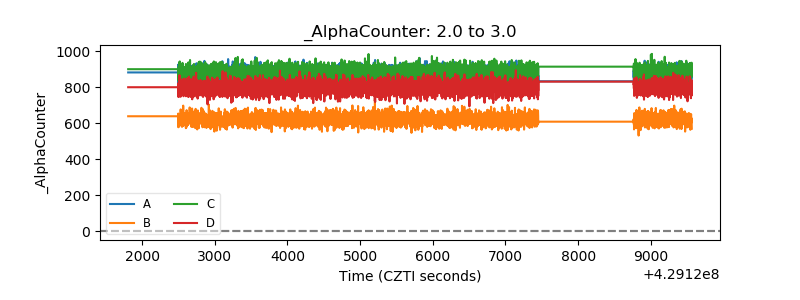 |
| _CPM_Rate | 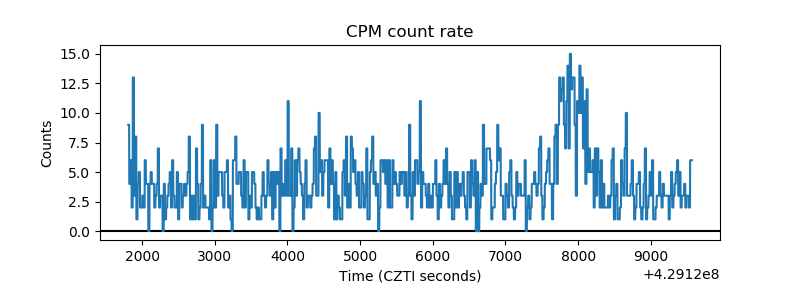 |
| CZT Counter | 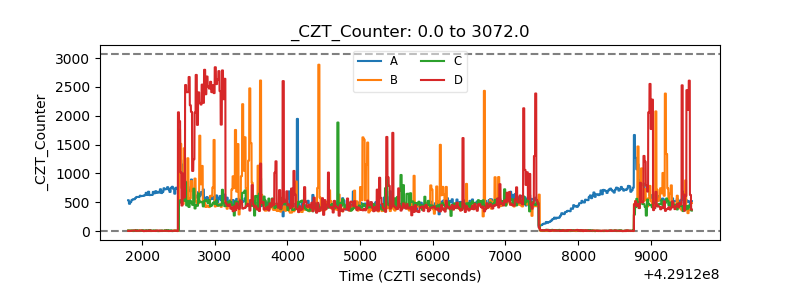 |
| +2.5 Volts monitor | 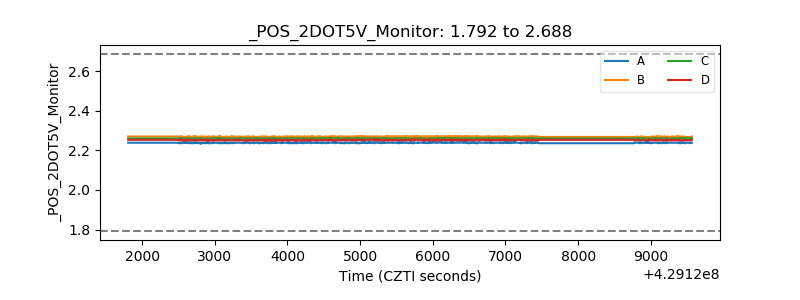 |
| +5 Volts monitor |  |
| _ROLL_ROT | 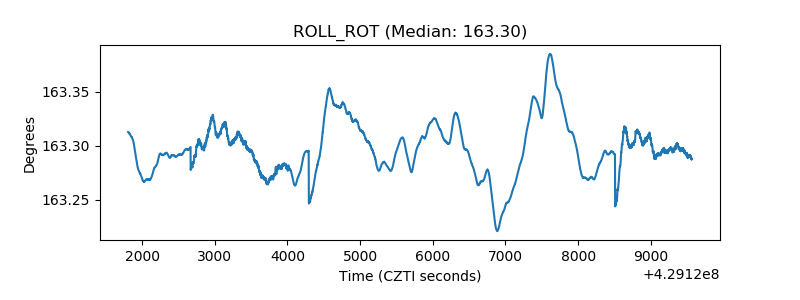 |
| _Roll_DEC | 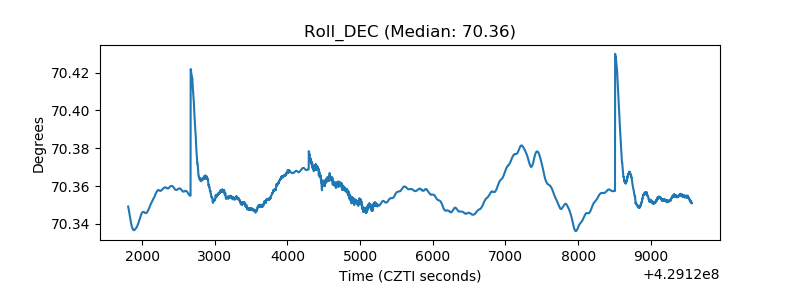 |
| _Roll_RA | 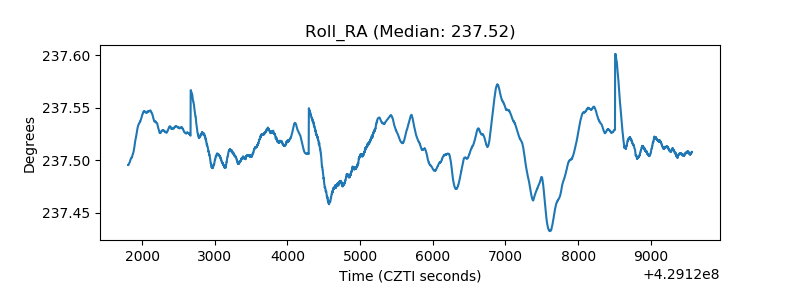 |
| Veto Counter | 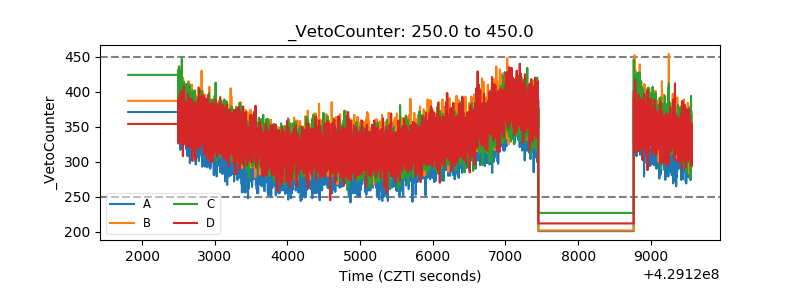 |