| Param | Original file | Final file |
|---|---|---|
| Filename | modeM0/AS1C07_001T10_9000005806_42497cztM0_level2.fits | modeM0/AS1C07_001T10_9000005806_42497cztM0_level2_quad_clean.evt |
| Size (bytes) | 886,403,520 | 246,012,480 |
| Size | 845.3 MB | 234.6 MB |
| Events in quadrant A | 8,334,700 | 1,629,706 |
| Events in quadrant B | 7,078,212 | 1,660,121 |
| Events in quadrant C | 7,149,692 | 1,611,948 |
| Events in quadrant D | 9,037,052 | 1,468,535 |
| Mode M9 | |||
|---|---|---|---|
| Quadrant | BADHDUFLAG | Total packets | Discarded packets |
| A | 0 | 53 | 0 |
| B | 0 | 54 | 0 |
| C | 0 | 54 | 0 |
| D | 0 | 54 | 0 |
| Mode SS | |||
|---|---|---|---|
| Quadrant | BADHDUFLAG | Total packets | Discarded packets |
| A | 0 | 318 | 0 |
| B | 0 | 318 | 0 |
| C | 0 | 318 | 0 |
| D | 0 | 318 | 0 |
| Mode M0 | |||
|---|---|---|---|
| Quadrant | BADHDUFLAG | Total packets | Discarded packets |
| A | 0 | 34808 | 4 |
| B | 0 | 32838 | 4 |
| C | 0 | 31829 | 4 |
| D | 0 | 38979 | 4 |
| Quadrant | Total seconds | Saturated seconds | Saturation percentage |
|---|---|---|---|
| A | 15631 | 26 | 0.166336% |
| B | 15631 | 79 | 0.505406% |
| C | 15631 | 19 | 0.121553% |
| D | 15631 | 601 | 3.844924% |
Noise dominated data is calculated using 1-second bins in cleaned event files. If a bin has >2000 counts, and if more than 50% of those come from <1% of pixels, then it is considered to be noise-dominated and hence unusable.
| Quadrant | # 1 sec bins | Bins with >0 counts | Bins with >2000 counts | High rate bins dominated by noise | Noise dominated (total time) | Noise dominated (detector-on time) | Marked lightcurve |
|---|---|---|---|---|---|---|---|
| A | 19810 | 15634 | 9 | 9 | 0.05% | 0.06% | 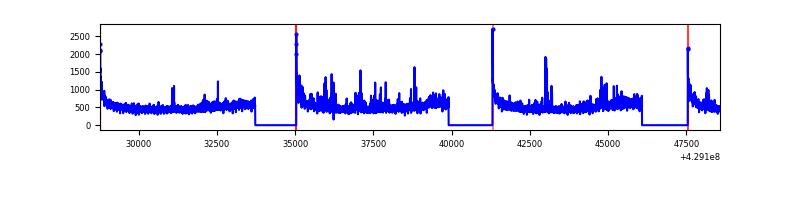 |
| B | 19810 | 15634 | 41 | 41 | 0.21% | 0.26% | 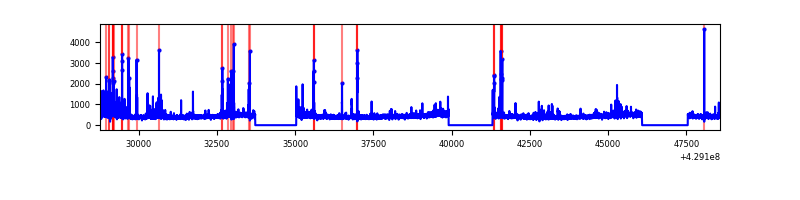 |
| C | 19810 | 15634 | 9 | 9 | 0.05% | 0.06% | 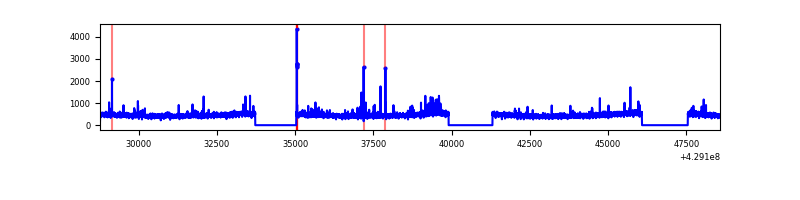 |
| D | 19810 | 15634 | 453 | 453 | 2.29% | 2.90% | 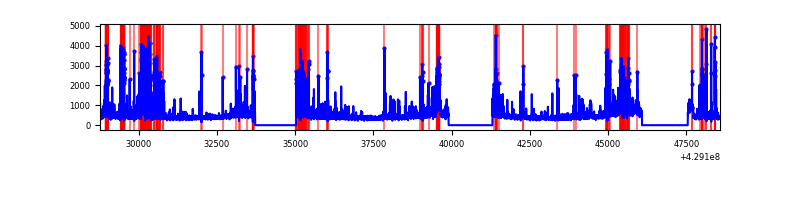 |
Top three noisy pixels from each quadrant. If the there are fewer than three noisy pixels in the level2.evt file, extra rows are filled as -1
| Pixel properties | Quadrant properties | ||||||
|---|---|---|---|---|---|---|---|
| Quadrant | DetID | PixID | Counts | Sigma | Mean | Median | Sigma |
| A | 10 | 83 | 1451446 | 4305.08 | 1649 | 1615 | 336.8 |
| A | 12 | 189 | 296459 | 875.5 | 1649 | 1615 | 336.8 |
| A | 13 | 248 | 70512 | 204.58 | 1649 | 1615 | 336.8 |
| B | 5 | 255 | 270844 | 861.86 | 1630 | 1583 | 312.4 |
| B | 0 | 245 | 140329 | 444.1 | 1630 | 1583 | 312.4 |
| B | 5 | 172 | 88123 | 277.0 | 1630 | 1583 | 312.4 |
| C | 15 | 214 | 637466 | 1715.45 | 1606 | 1615 | 370.7 |
| C | 9 | 54 | 114066 | 303.38 | 1606 | 1615 | 370.7 |
| C | 14 | 254 | 64716 | 170.24 | 1606 | 1615 | 370.7 |
| D | 2 | 249 | 1193458 | 3046.35 | 1594 | 1547 | 391.3 |
| D | 12 | 233 | 379963 | 967.18 | 1594 | 1547 | 391.3 |
| D | 10 | 118 | 347012 | 882.96 | 1594 | 1547 | 391.3 |
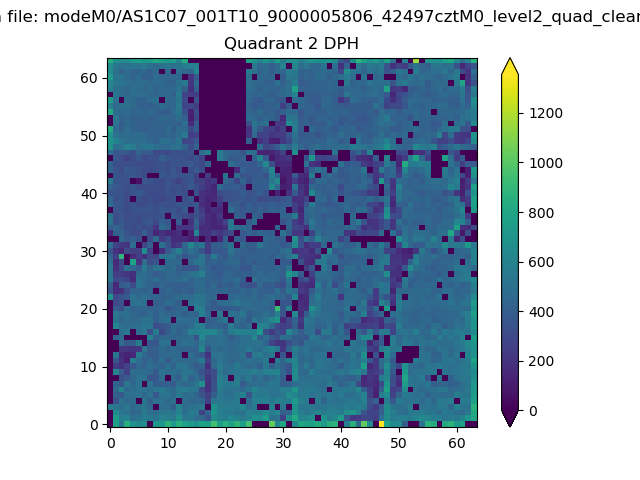
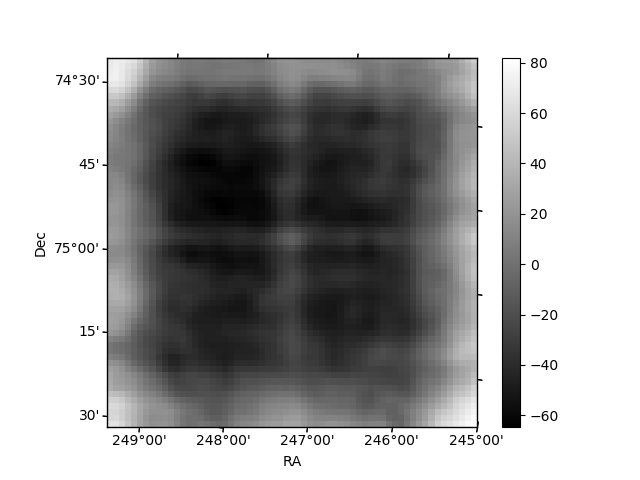
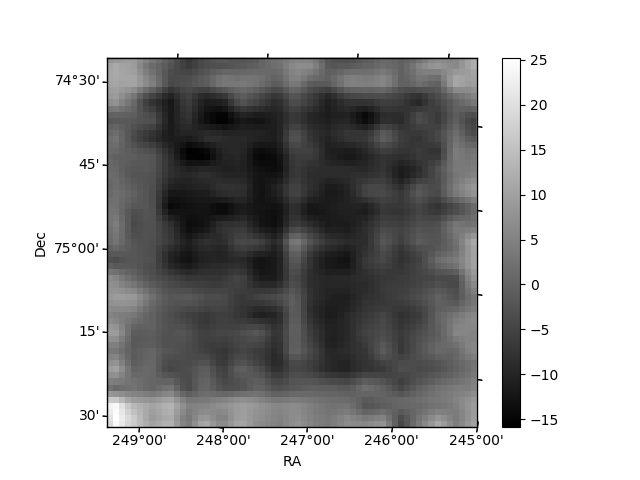
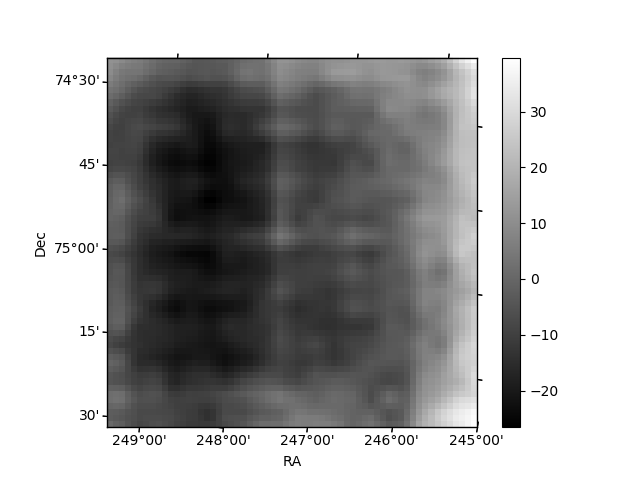
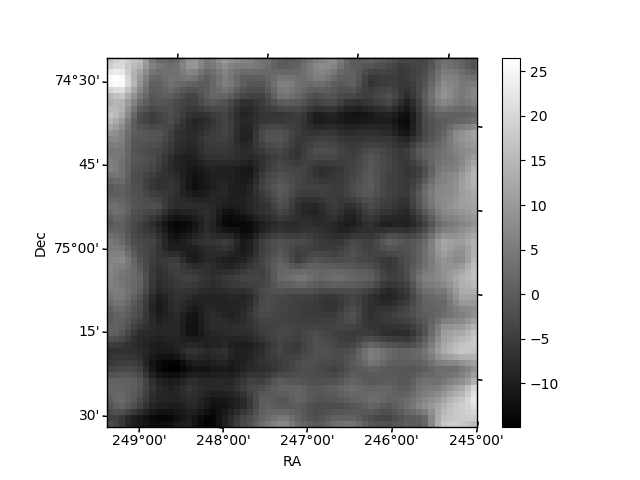
Histogram calculated using DETX and DETY for each event in the final _common_clean file
| Quadrant A | 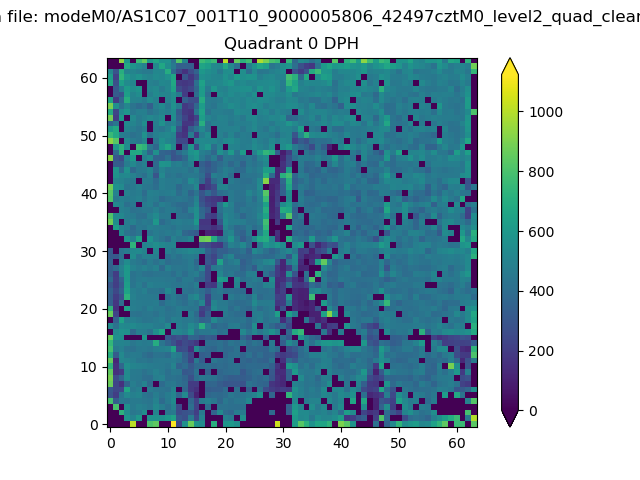 |
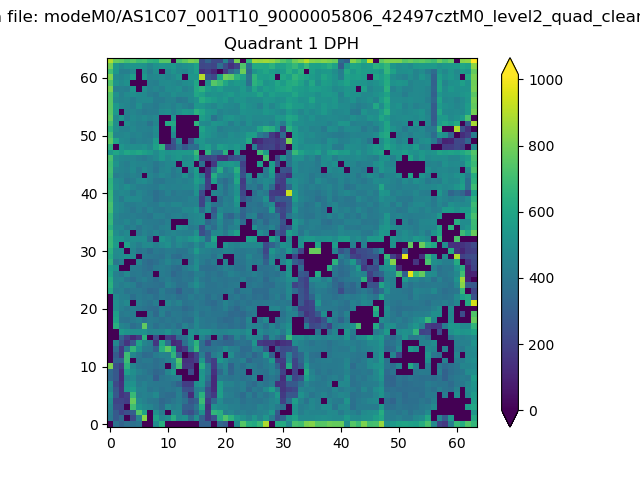 |
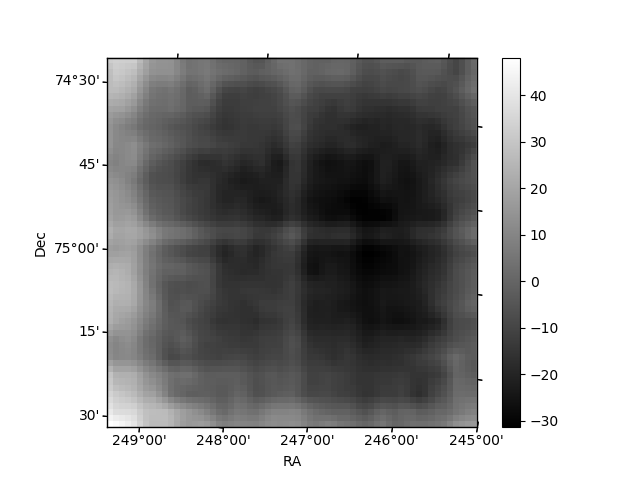
Quadrant B |
|---|---|---|---|
| Quadrant D | 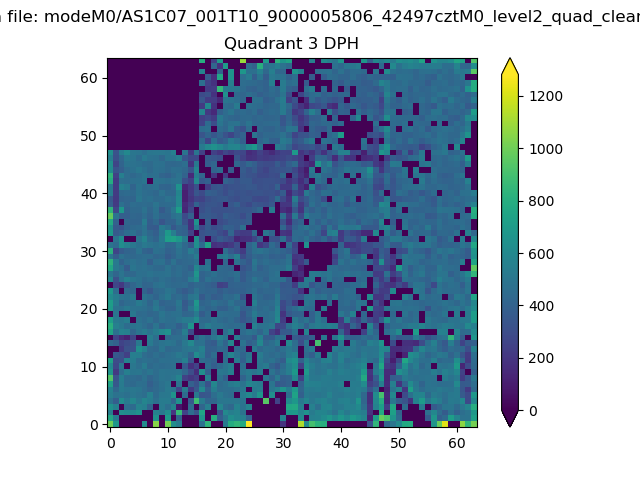 |
 |
Quadrant C |
| Plot type | Count rate plots | Images |
|---|---|---|
| Comparison with Poisson distribution Blue bars denote a histogram of data divided into 1 sec bins. Red curve is a Poisson curve with rate = median count rate of data. |
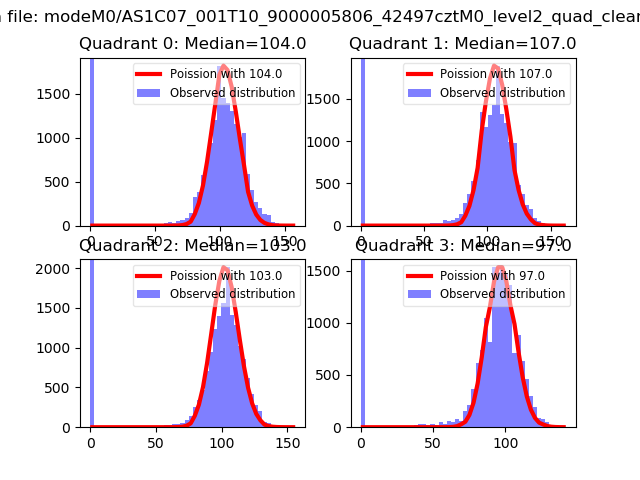 |
 |
| Quadrant-wise count rates Data is divided into 100 sec bins |
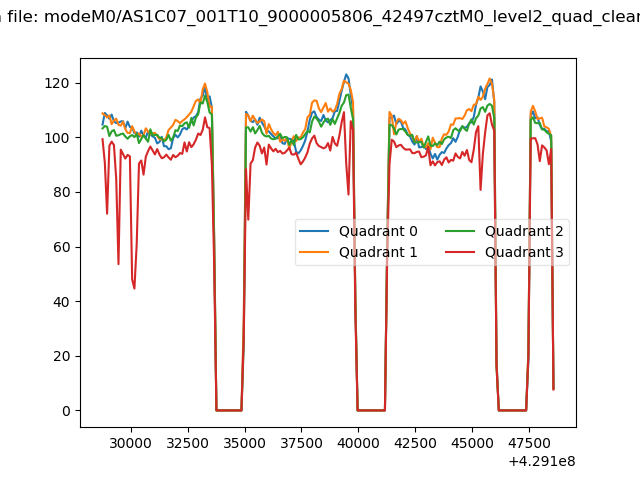 |
|
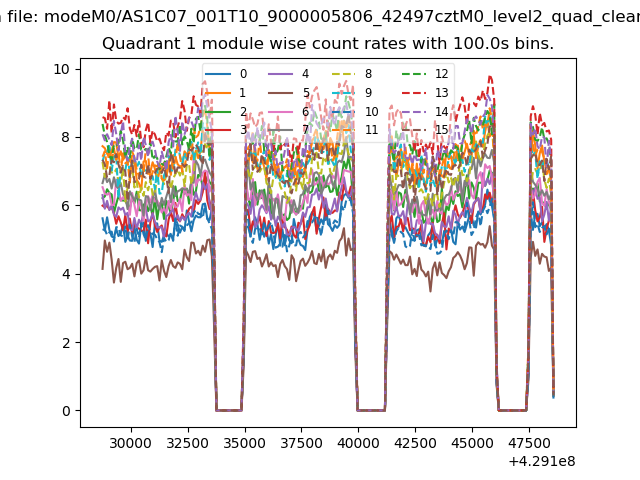
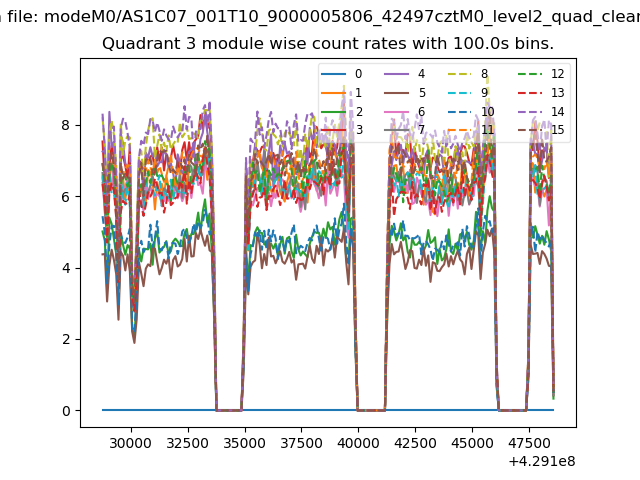
| Module-wise count rates for Quadrant A Data is divided into 100 sec bins |
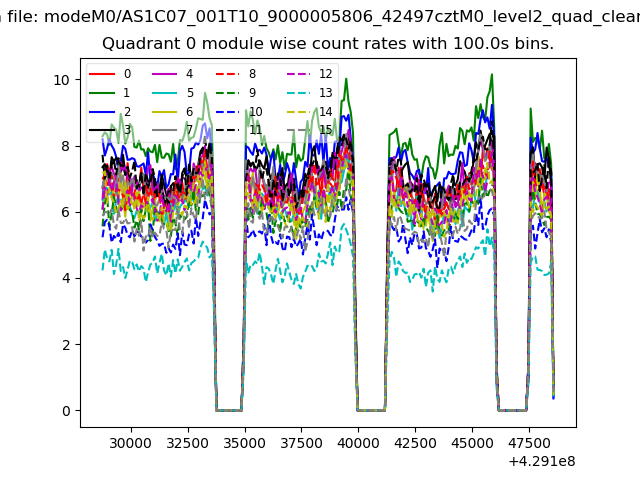 |
 |
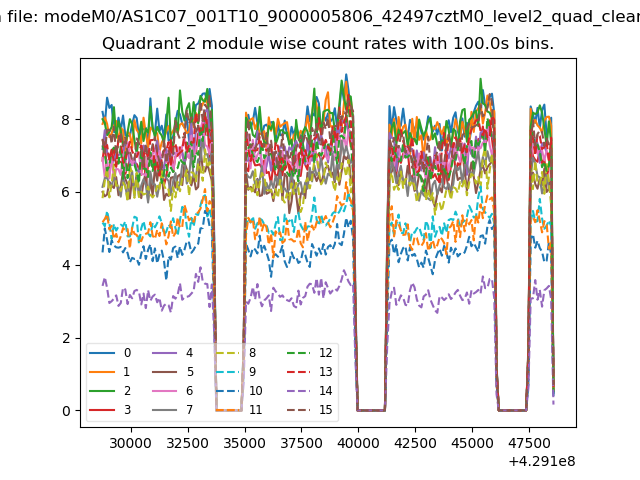
| Module-wise count rates for Quadrant B Data is divided into 100 sec bins |
 |
 |
| Module-wise count rates for Quadrant C Data is divided into 100 sec bins |
 |
 |
| Module-wise count rates for Quadrant D Data is divided into 100 sec bins |
 |
 |
| Parameter | Plot |
|---|---|
| CZT HV Monitor | 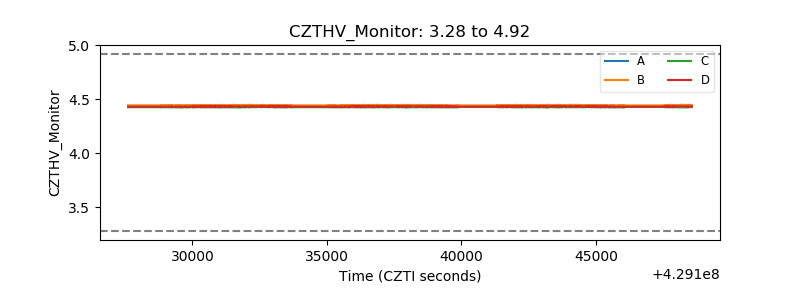 |
| D_VDD | 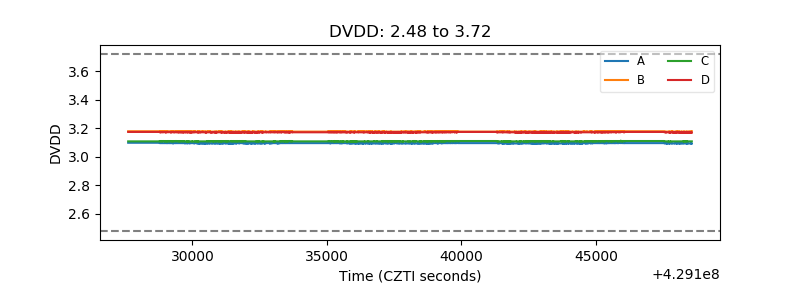 |
| Temperature 1 | 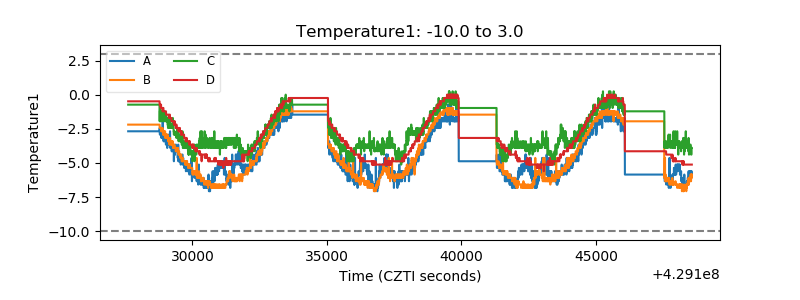 |
| Veto HV Monitor | 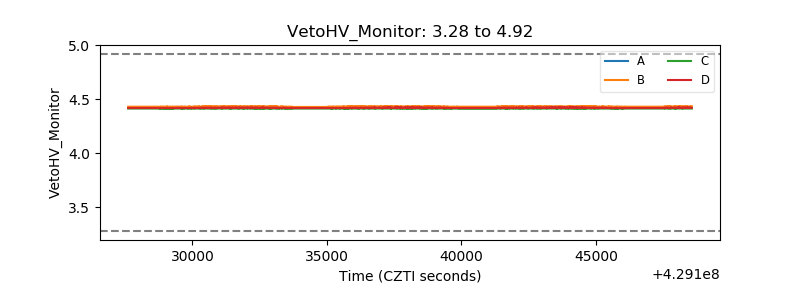 |
| Veto LLD | 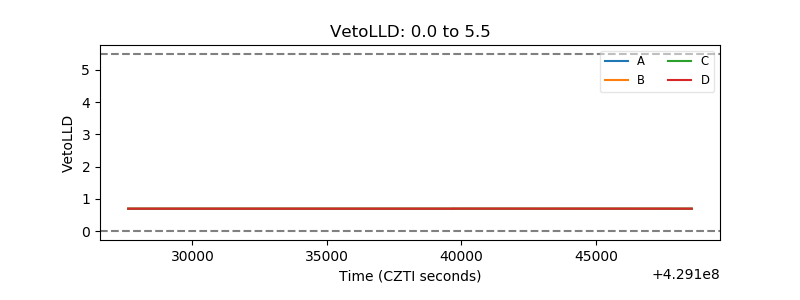 |
| Alpha Counter | 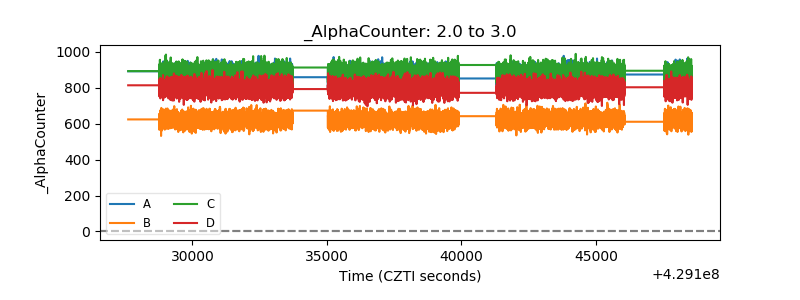 |
| _CPM_Rate | 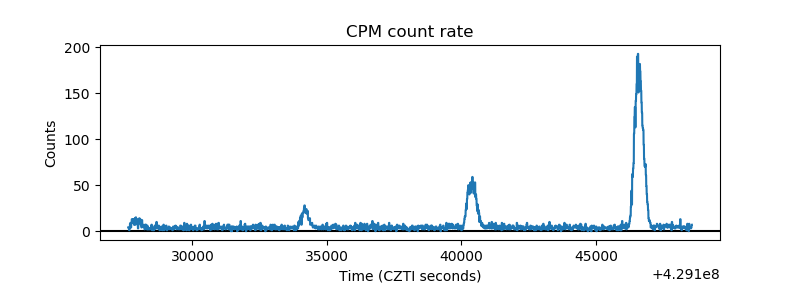 |
| CZT Counter | 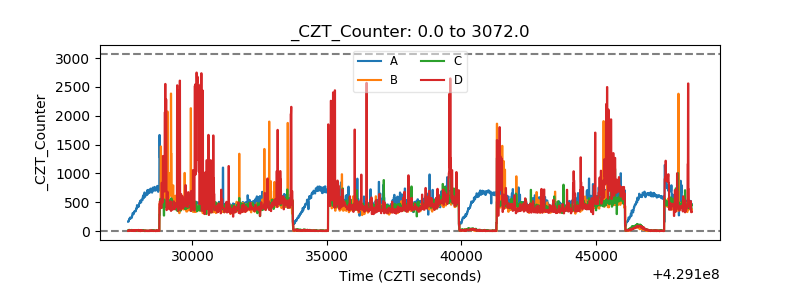 |
| +2.5 Volts monitor | 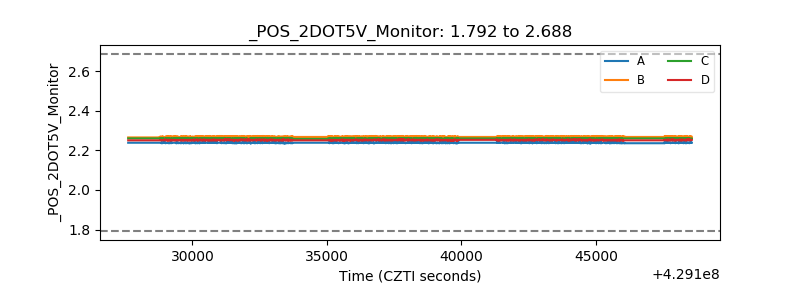 |
| +5 Volts monitor | 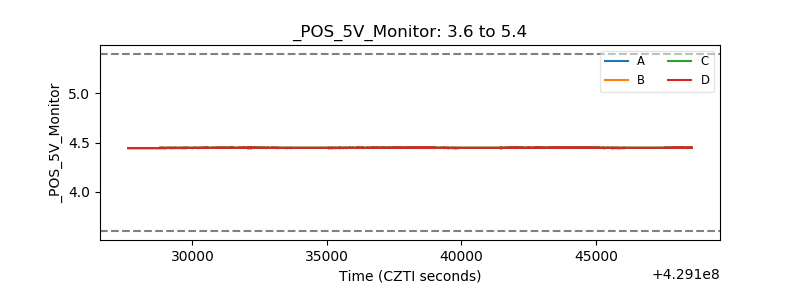 |
| _ROLL_ROT | 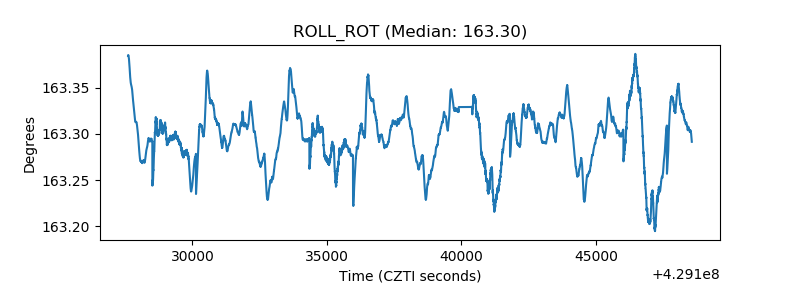 |
| _Roll_DEC | 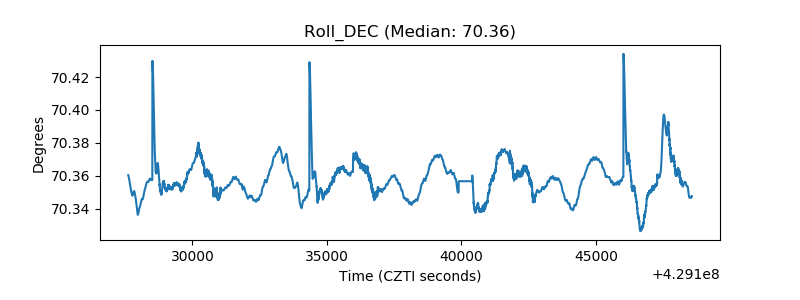 |
| _Roll_RA | 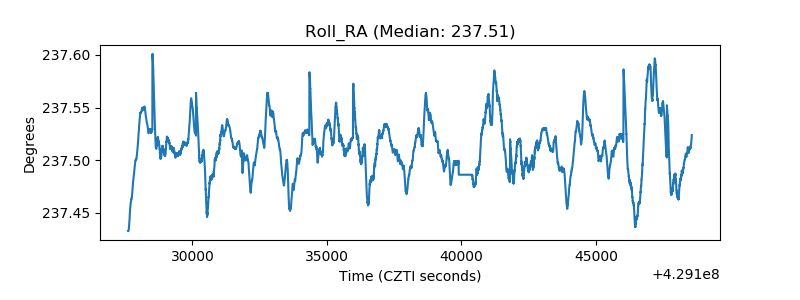 |
| Veto Counter | 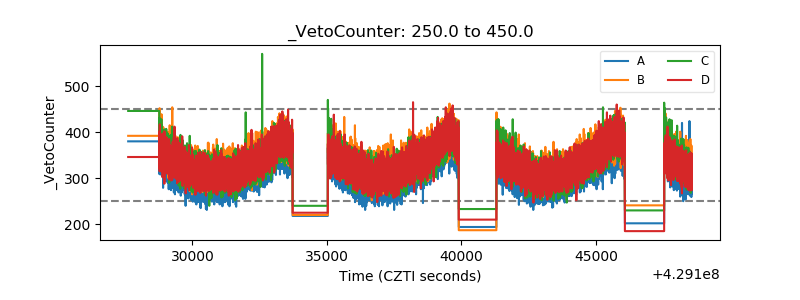 |