| Param | Original file | Final file |
|---|---|---|
| Filename | modeM0/AS1C07_001T10_9000005806_42498cztM0_level2.fits | modeM0/AS1C07_001T10_9000005806_42498cztM0_level2_quad_clean.evt |
| Size (bytes) | 323,003,520 | 94,193,280 |
| Size | 308.0 MB | 89.8 MB |
| Events in quadrant A | 3,227,283 | 625,029 |
| Events in quadrant B | 2,544,519 | 630,604 |
| Events in quadrant C | 2,658,293 | 616,077 |
| Events in quadrant D | 3,068,522 | 570,476 |
| Mode M9 | |||
|---|---|---|---|
| Quadrant | BADHDUFLAG | Total packets | Discarded packets |
| A | 0 | 32 | 0 |
| B | 0 | 32 | 0 |
| C | 0 | 32 | 0 |
| D | 0 | 32 | 0 |
| Mode SS | |||
|---|---|---|---|
| Quadrant | BADHDUFLAG | Total packets | Discarded packets |
| A | 0 | 118 | 0 |
| B | 0 | 118 | 0 |
| C | 0 | 118 | 0 |
| D | 0 | 118 | 0 |
| Mode M0 | |||
|---|---|---|---|
| Quadrant | BADHDUFLAG | Total packets | Discarded packets |
| A | 0 | 13334 | 2 |
| B | 0 | 11980 | 2 |
| C | 0 | 11862 | 2 |
| D | 0 | 13698 | 2 |
| Quadrant | Total seconds | Saturated seconds | Saturation percentage |
|---|---|---|---|
| A | 5876 | 13 | 0.221239% |
| B | 5877 | 6 | 0.102093% |
| C | 5877 | 2 | 0.034031% |
| D | 5877 | 100 | 1.701548% |
Noise dominated data is calculated using 1-second bins in cleaned event files. If a bin has >2000 counts, and if more than 50% of those come from <1% of pixels, then it is considered to be noise-dominated and hence unusable.
| Quadrant | # 1 sec bins | Bins with >0 counts | Bins with >2000 counts | High rate bins dominated by noise | Noise dominated (total time) | Noise dominated (detector-on time) | Marked lightcurve |
|---|---|---|---|---|---|---|---|
| A | 8952 | 5878 | 3 | 3 | 0.03% | 0.05% | 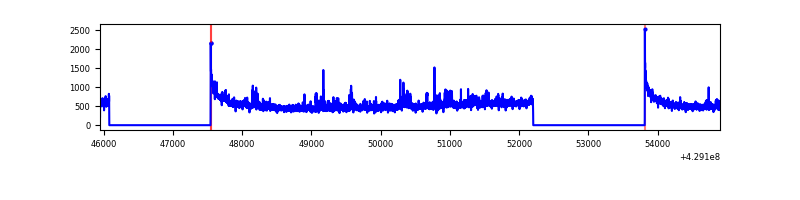 |
| B | 8953 | 5879 | 2 | 2 | 0.02% | 0.03% | 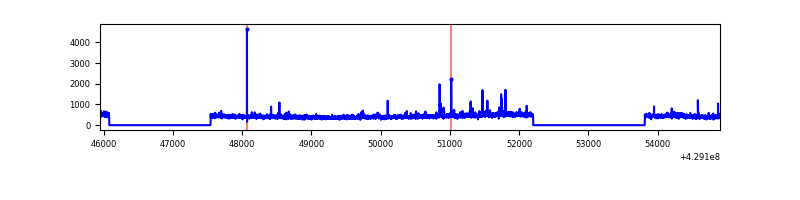 |
| C | 8953 | 5879 | 0 | 0 | 0.00% | 0.00% | 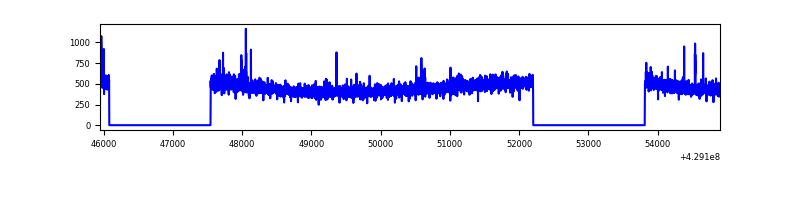 |
| D | 8953 | 5879 | 73 | 73 | 0.82% | 1.24% | 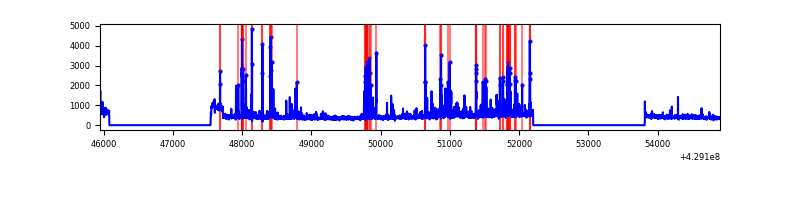 |
Top three noisy pixels from each quadrant. If the there are fewer than three noisy pixels in the level2.evt file, extra rows are filled as -1
| Pixel properties | Quadrant properties | ||||||
|---|---|---|---|---|---|---|---|
| Quadrant | DetID | PixID | Counts | Sigma | Mean | Median | Sigma |
| A | 10 | 83 | 603943 | 4708.53 | 621 | 609 | 128.1 |
| A | 12 | 189 | 140674 | 1093.09 | 621 | 609 | 128.1 |
| A | 2 | 79 | 25348 | 193.07 | 621 | 609 | 128.1 |
| B | 0 | 245 | 41673 | 343.68 | 615 | 597 | 119.5 |
| B | 0 | 229 | 21923 | 178.43 | 615 | 597 | 119.5 |
| B | 15 | 35 | 20048 | 162.74 | 615 | 597 | 119.5 |
| C | 15 | 214 | 244063 | 1711.37 | 605 | 609 | 142.3 |
| C | 9 | 54 | 36520 | 252.44 | 605 | 609 | 142.3 |
| C | 0 | 239 | 16123 | 109.06 | 605 | 609 | 142.3 |
| D | 12 | 233 | 177979 | 1198.15 | 604 | 587 | 148.1 |
| D | 12 | 6 | 127482 | 857.08 | 604 | 587 | 148.1 |
| D | 1 | 52 | 100759 | 676.59 | 604 | 587 | 148.1 |
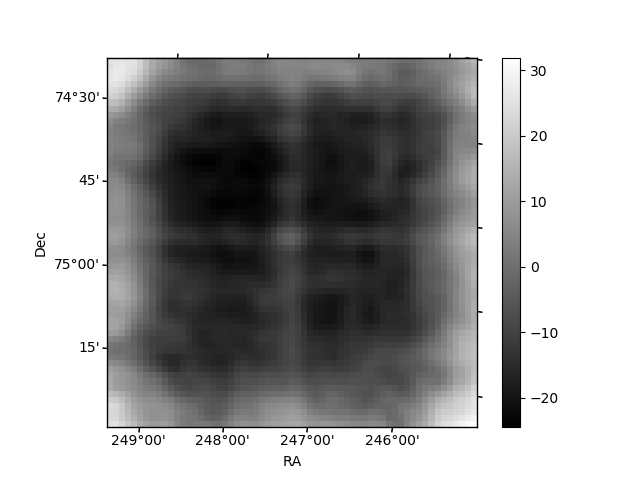
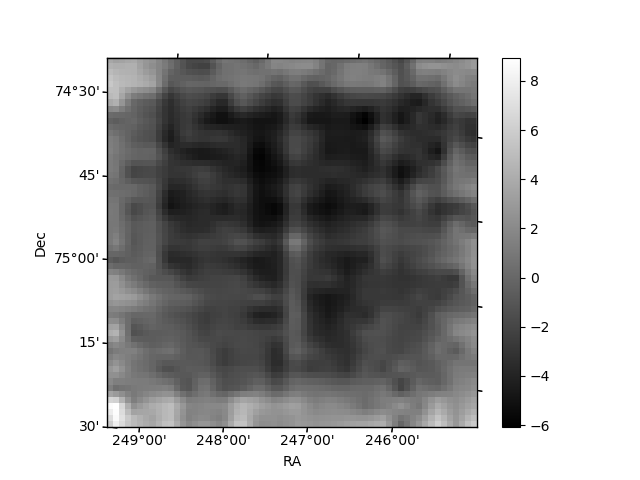
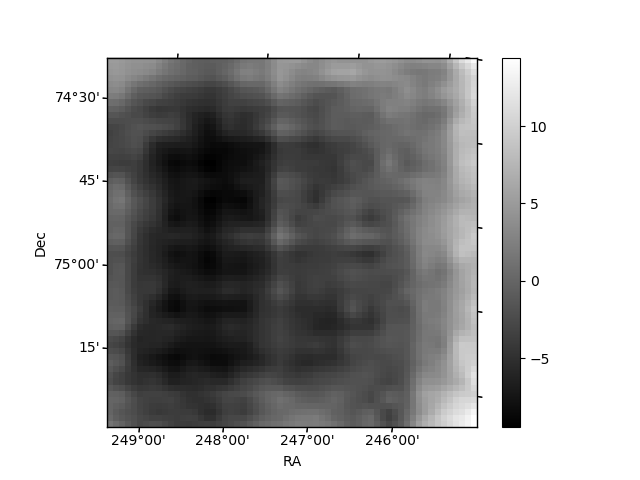
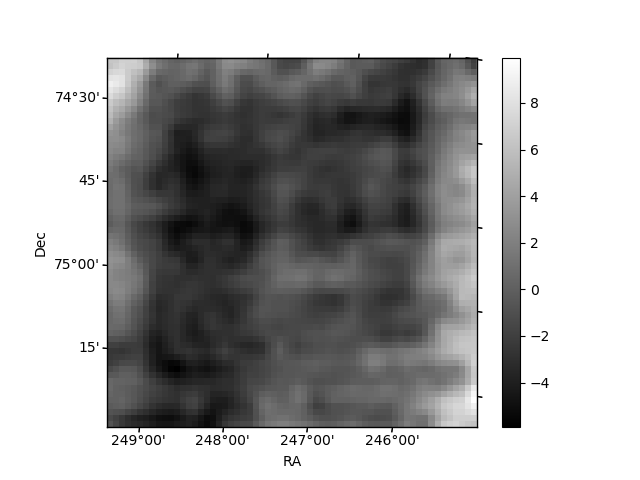
Histogram calculated using DETX and DETY for each event in the final _common_clean file
| Quadrant A | 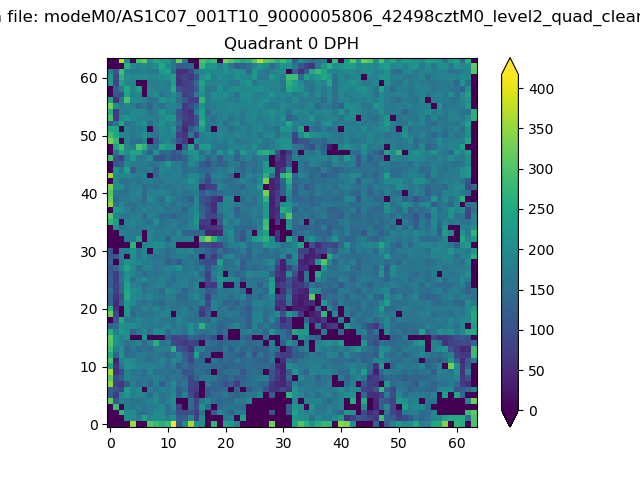 |
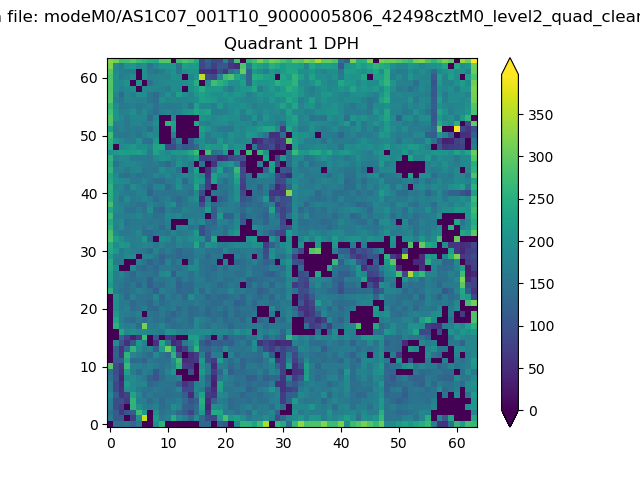 |
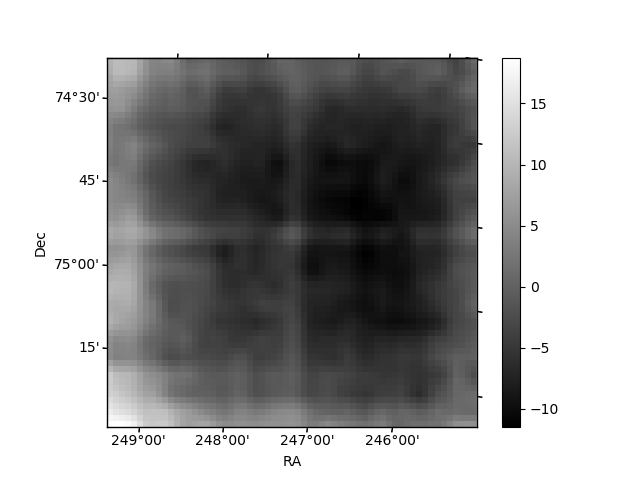
Quadrant B |
|---|---|---|---|
| Quadrant D | 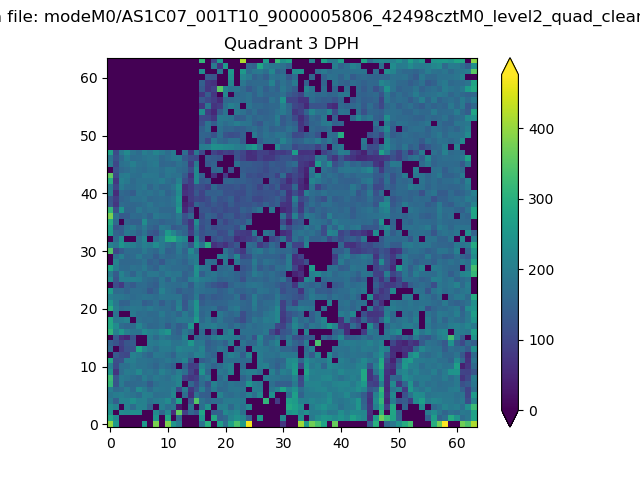 |
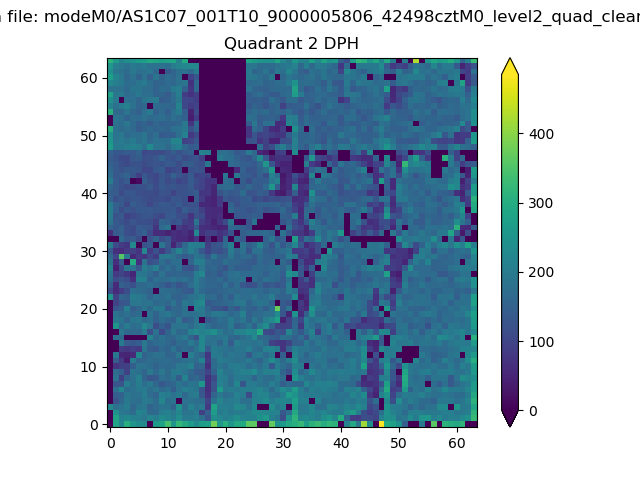 |
Quadrant C |
| Plot type | Count rate plots | Images |
|---|---|---|
| Comparison with Poisson distribution Blue bars denote a histogram of data divided into 1 sec bins. Red curve is a Poisson curve with rate = median count rate of data. |
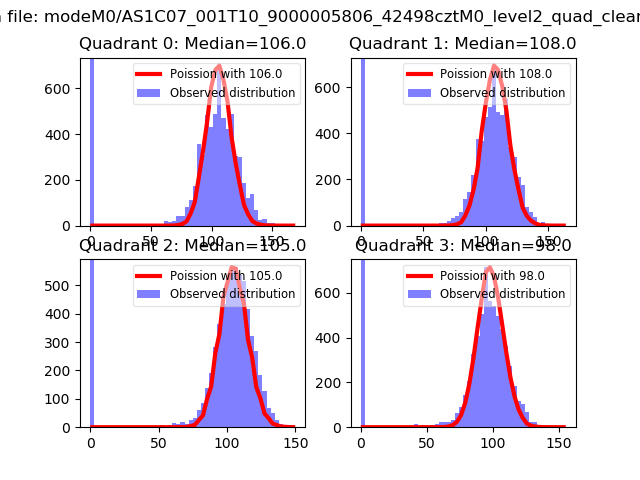 |
 |
| Quadrant-wise count rates Data is divided into 100 sec bins |
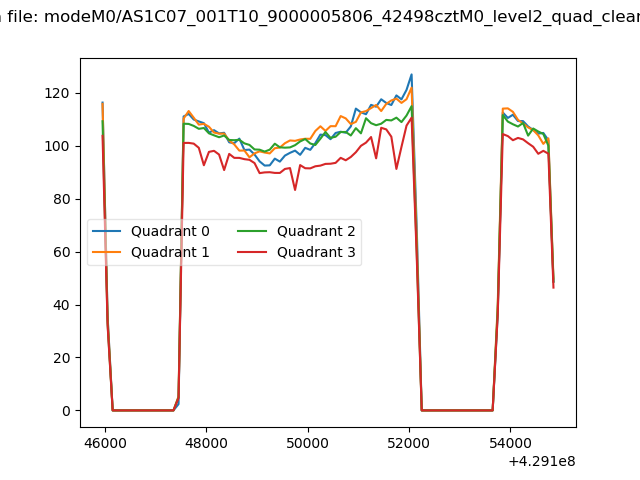 |
|
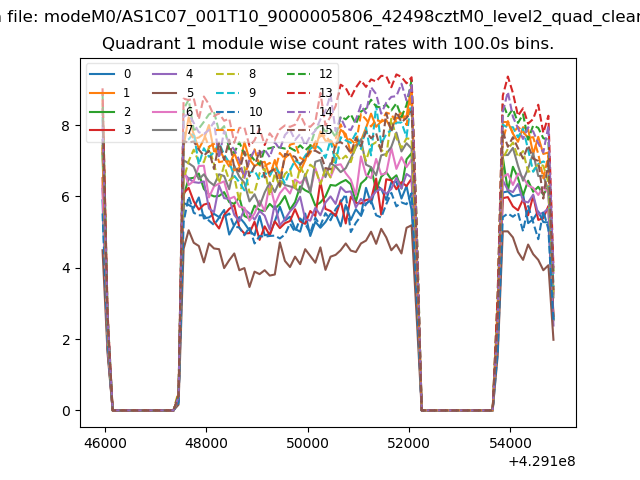
| Module-wise count rates for Quadrant A Data is divided into 100 sec bins |
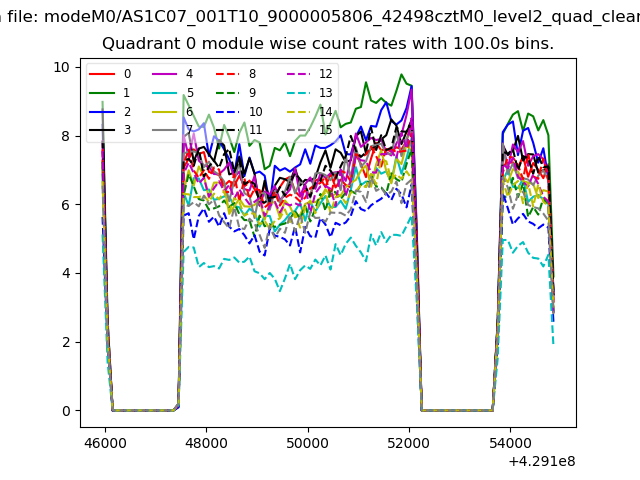 |
 |
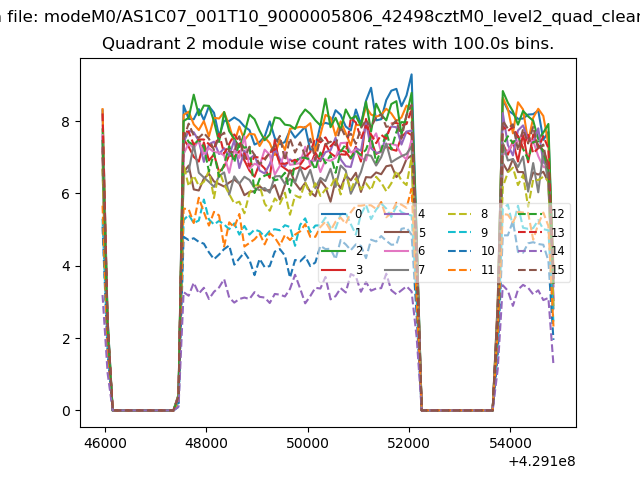
| Module-wise count rates for Quadrant B Data is divided into 100 sec bins |
 |
 |
| Module-wise count rates for Quadrant C Data is divided into 100 sec bins |
 |
 |
| Module-wise count rates for Quadrant D Data is divided into 100 sec bins |
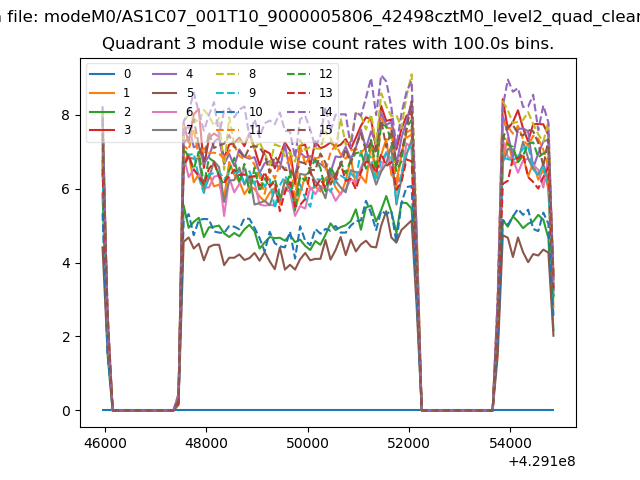 |
 |
| Parameter | Plot |
|---|---|
| CZT HV Monitor | 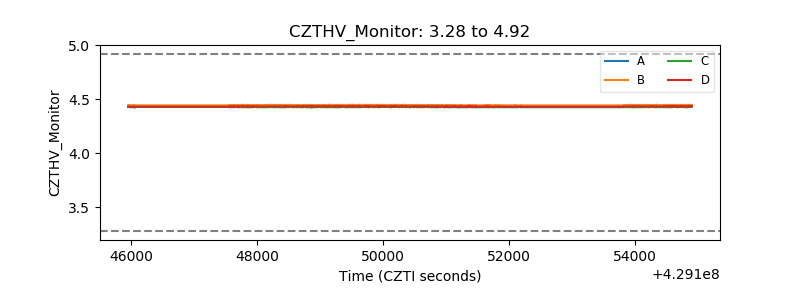 |
| D_VDD | 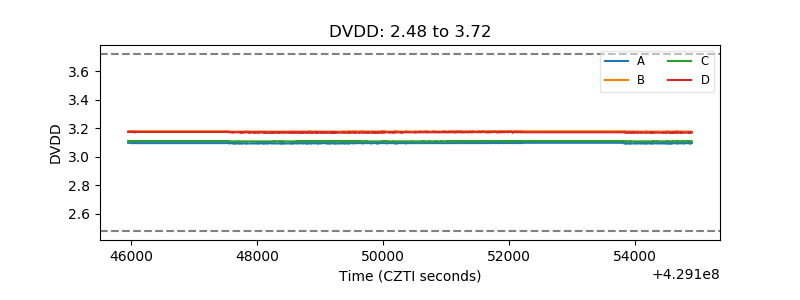 |
| Temperature 1 | 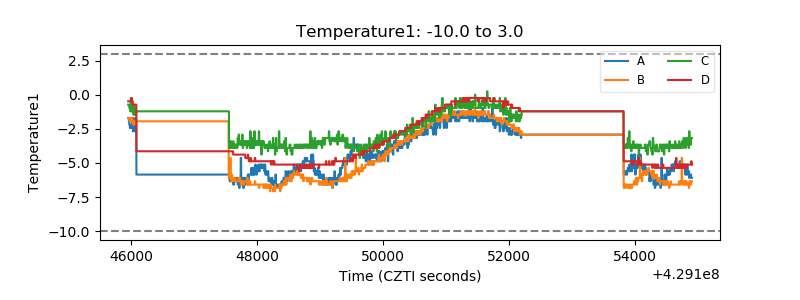 |
| Veto HV Monitor |  |
| Veto LLD | 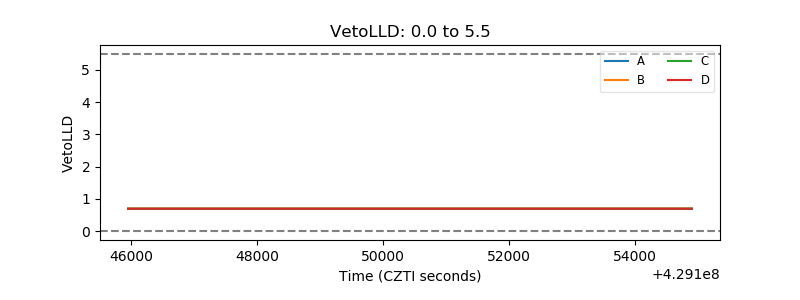 |
| Alpha Counter | 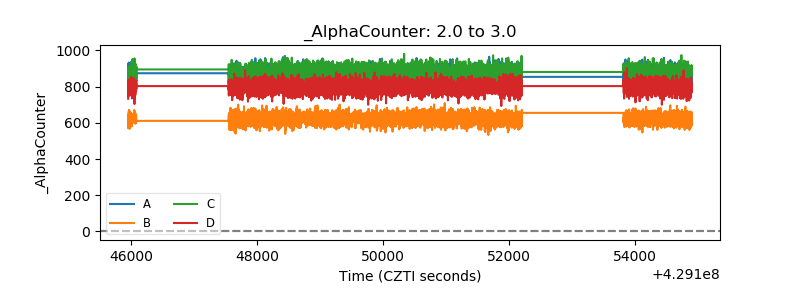 |
| _CPM_Rate | 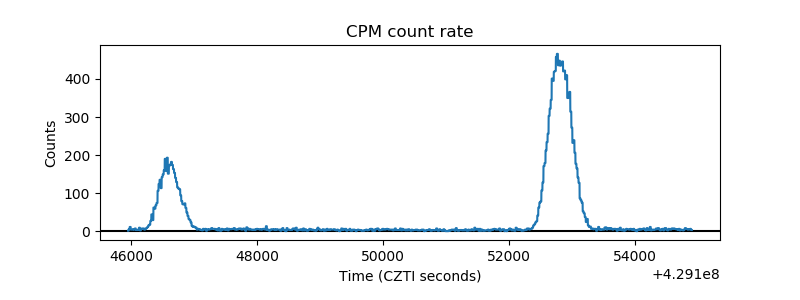 |
| CZT Counter | 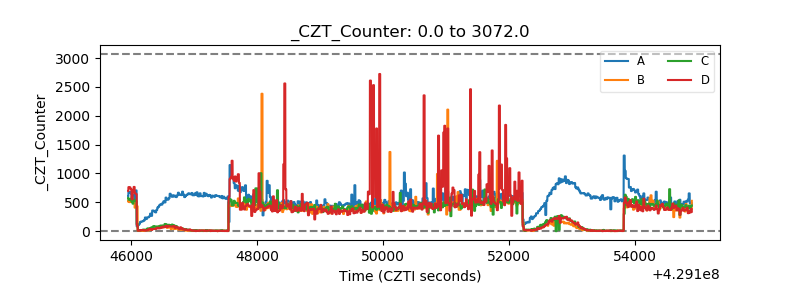 |
| +2.5 Volts monitor | 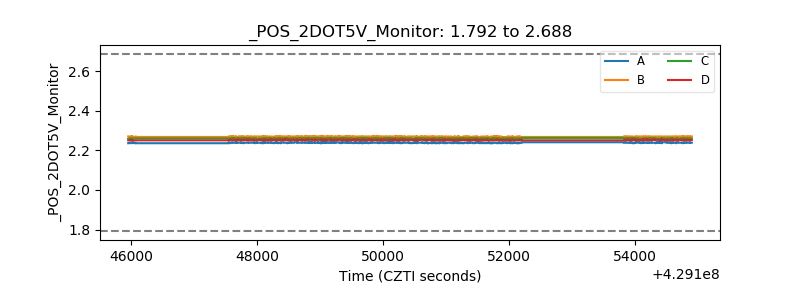 |
| +5 Volts monitor | 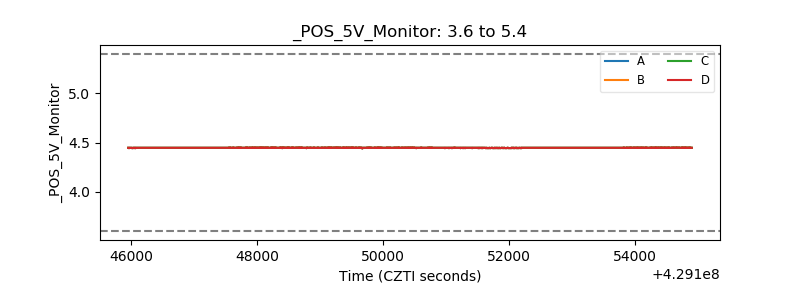 |
| _ROLL_ROT | 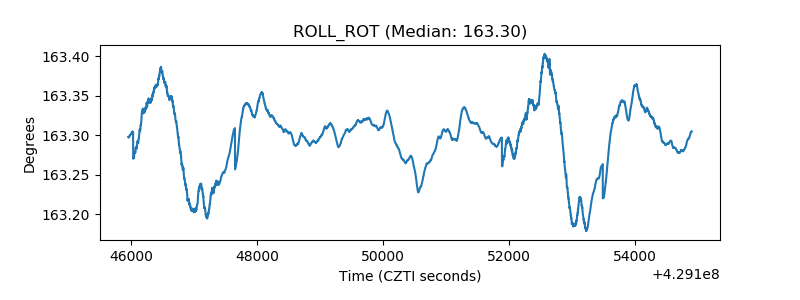 |
| _Roll_DEC | 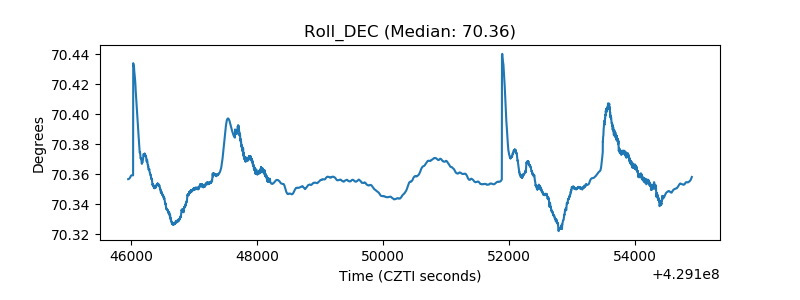 |
| _Roll_RA | 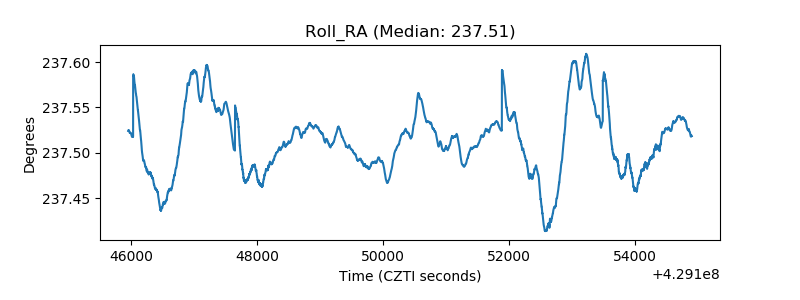 |
| Veto Counter | 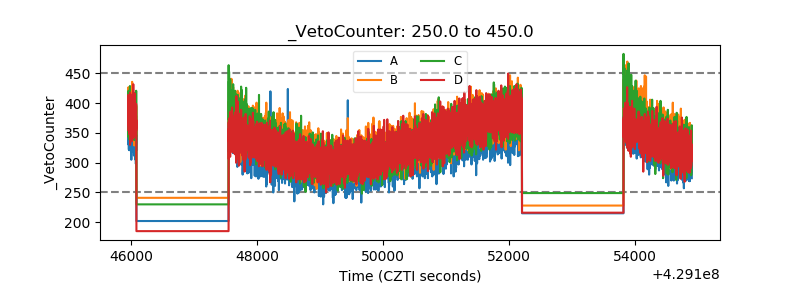 |