| Param | Original file | Final file |
|---|---|---|
| Filename | modeM0/AS1C07_001T10_9000005806_42501cztM0_level2.fits | modeM0/AS1C07_001T10_9000005806_42501cztM0_level2_quad_clean.evt |
| Size (bytes) | 455,950,080 | 79,813,440 |
| Size | 434.8 MB | 76.1 MB |
| Events in quadrant A | 2,882,157 | 586,301 |
| Events in quadrant B | 2,249,137 | 594,247 |
| Events in quadrant C | 8,131,526 | 347,155 |
| Events in quadrant D | 3,207,737 | 522,815 |
| Mode M9 | |||
|---|---|---|---|
| Quadrant | BADHDUFLAG | Total packets | Discarded packets |
| A | 0 | 22 | 0 |
| B | 0 | 23 | 0 |
| C | 0 | 23 | 0 |
| D | 0 | 23 | 0 |
| Mode SS | |||
|---|---|---|---|
| Quadrant | BADHDUFLAG | Total packets | Discarded packets |
| A | 0 | 106 | 0 |
| B | 0 | 106 | 0 |
| C | 0 | 106 | 0 |
| D | 0 | 106 | 0 |
| Mode M0 | |||
|---|---|---|---|
| Quadrant | BADHDUFLAG | Total packets | Discarded packets |
| A | 0 | 11728 | 2 |
| B | 0 | 10501 | 2 |
| C | 0 | 27612 | 2 |
| D | 0 | 13294 | 2 |
| Quadrant | Total seconds | Saturated seconds | Saturation percentage |
|---|---|---|---|
| A | 5229 | 10 | 0.191241% |
| B | 5229 | 5 | 0.095621% |
| C | 5229 | 2225 | 42.551157% |
| D | 5229 | 131 | 2.505259% |
Noise dominated data is calculated using 1-second bins in cleaned event files. If a bin has >2000 counts, and if more than 50% of those come from <1% of pixels, then it is considered to be noise-dominated and hence unusable.
| Quadrant | # 1 sec bins | Bins with >0 counts | Bins with >2000 counts | High rate bins dominated by noise | Noise dominated (total time) | Noise dominated (detector-on time) | Marked lightcurve |
|---|---|---|---|---|---|---|---|
| A | 7111 | 5230 | 5 | 5 | 0.07% | 0.10% | 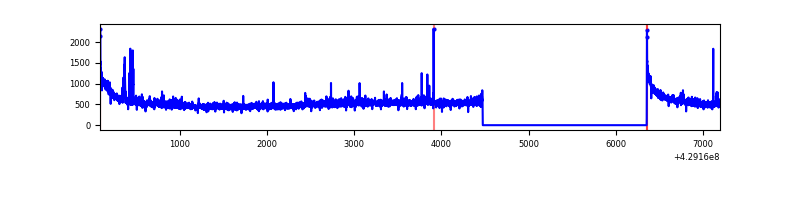 |
| B | 7111 | 5230 | 1 | 1 | 0.01% | 0.02% | 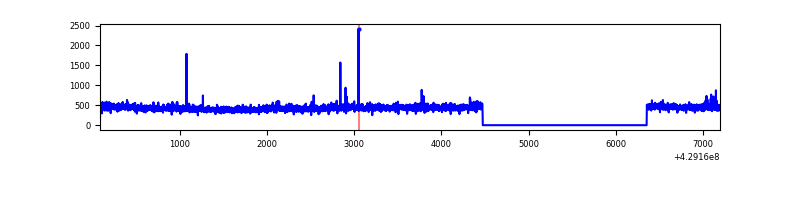 |
| C | 7111 | 5230 | 2215 | 2215 | 31.15% | 42.35% | 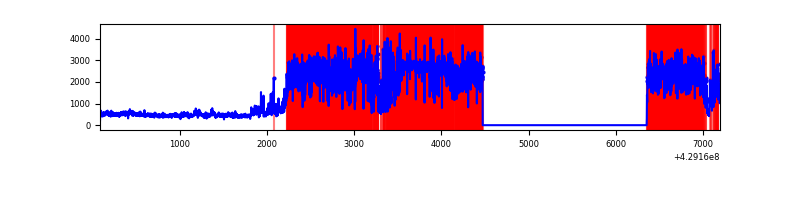 |
| D | 7111 | 5230 | 112 | 112 | 1.58% | 2.14% | 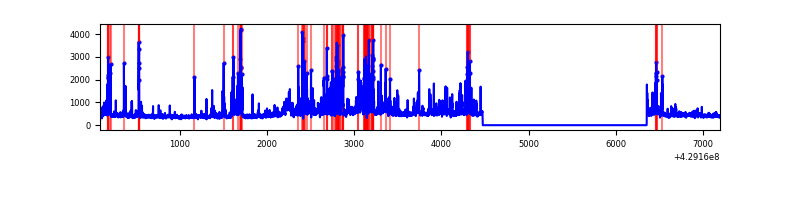 |
Top three noisy pixels from each quadrant. If the there are fewer than three noisy pixels in the level2.evt file, extra rows are filled as -1
| Pixel properties | Quadrant properties | ||||||
|---|---|---|---|---|---|---|---|
| Quadrant | DetID | PixID | Counts | Sigma | Mean | Median | Sigma |
| A | 10 | 83 | 555603 | 4756.71 | 568 | 556 | 116.7 |
| A | 12 | 189 | 61472 | 522.05 | 568 | 556 | 116.7 |
| A | 13 | 248 | 47722 | 404.21 | 568 | 556 | 116.7 |
| B | 5 | 255 | 27901 | 252.78 | 561 | 546 | 108.2 |
| B | 12 | 111 | 13571 | 120.36 | 561 | 546 | 108.2 |
| B | 11 | 111 | 12279 | 108.42 | 561 | 546 | 108.2 |
| C | 0 | 239 | 6155738 | 58447.52 | 451 | 452 | 105.3 |
| C | 15 | 214 | 188150 | 1782.29 | 451 | 452 | 105.3 |
| C | 9 | 54 | 18016 | 166.78 | 451 | 452 | 105.3 |
| D | 1 | 52 | 295653 | 2235.7 | 545 | 531 | 132.0 |
| D | 12 | 233 | 207619 | 1568.79 | 545 | 531 | 132.0 |
| D | 2 | 249 | 184711 | 1395.26 | 545 | 531 | 132.0 |
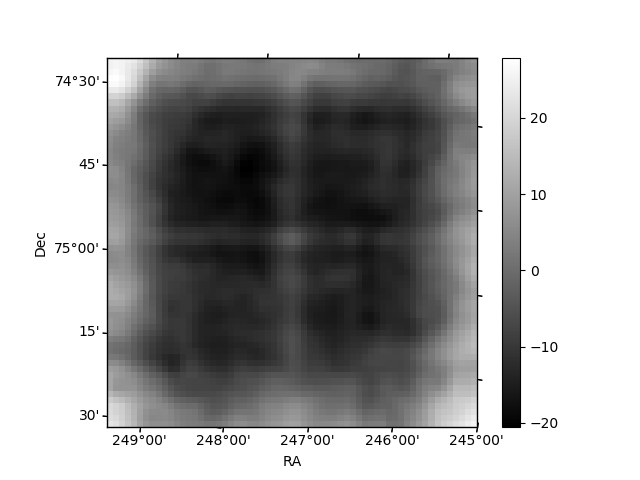
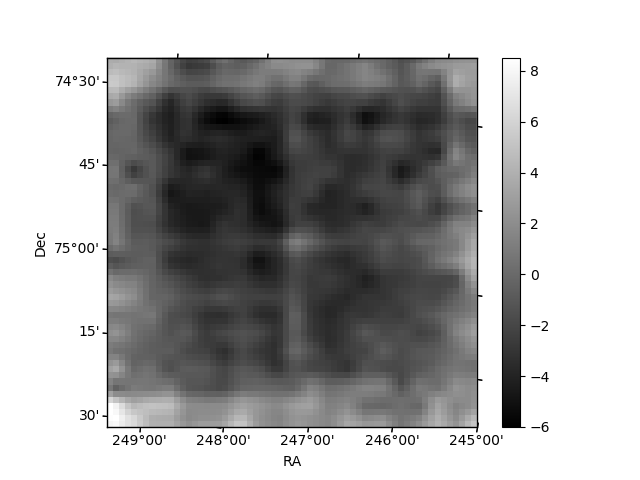
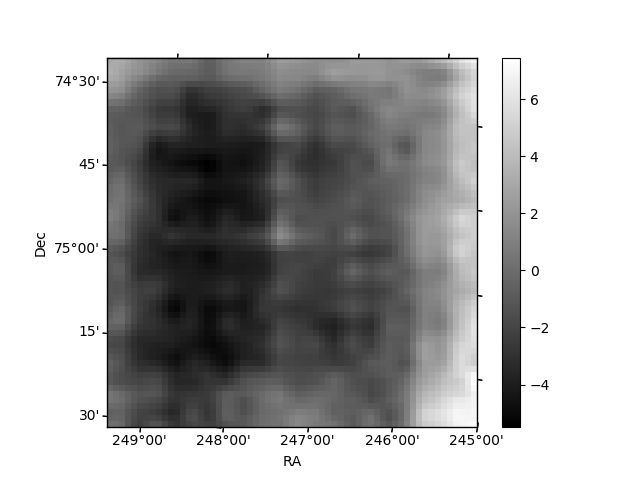
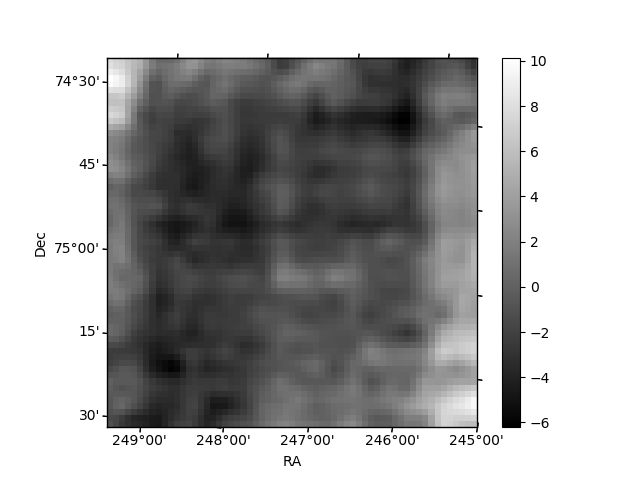
Histogram calculated using DETX and DETY for each event in the final _common_clean file
| Quadrant A | 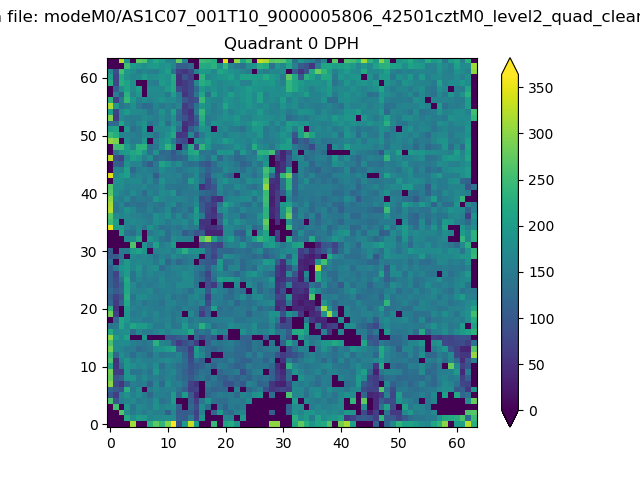 |
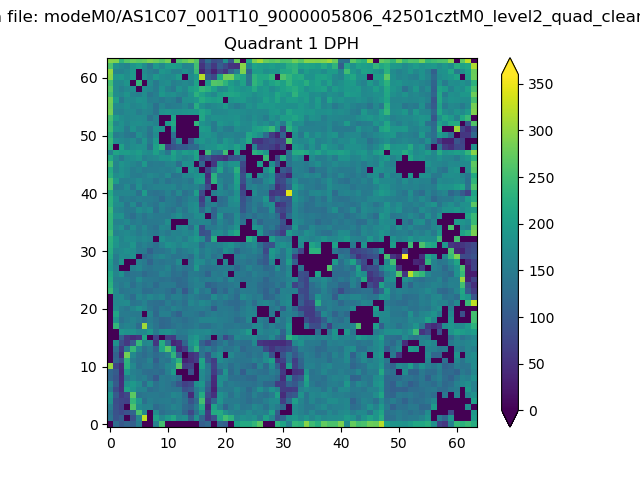 |
Quadrant B |
|---|---|---|---|
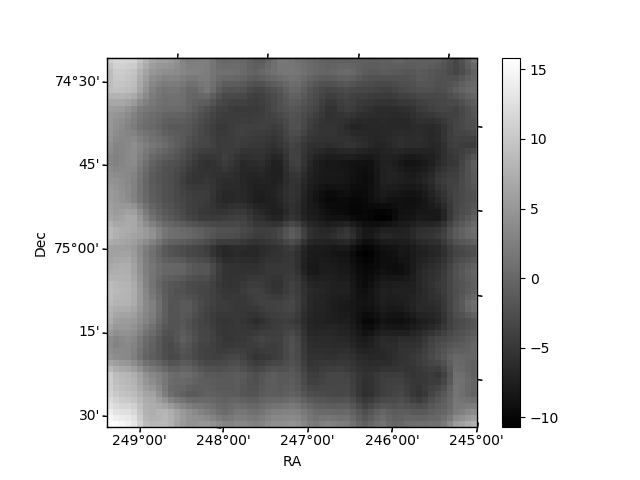
| Quadrant D | 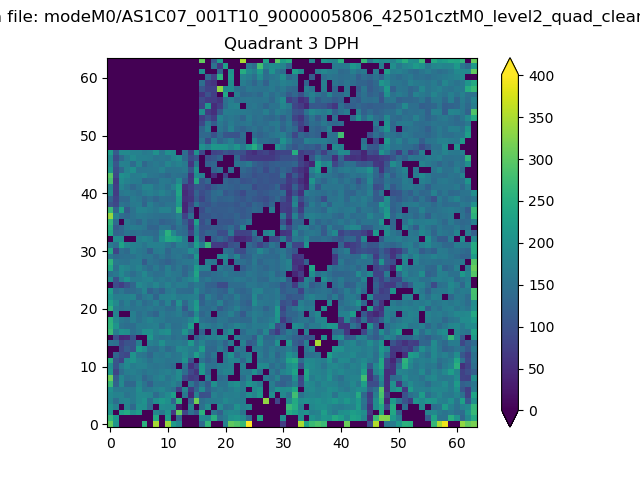 |
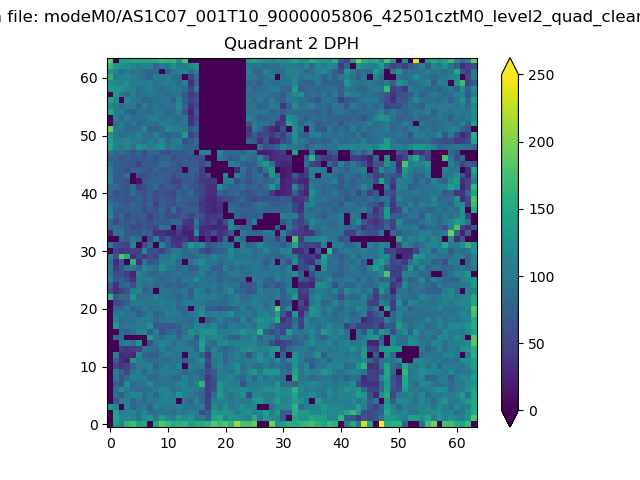 |
Quadrant C |
| Plot type | Count rate plots | Images |
|---|---|---|
| Comparison with Poisson distribution Blue bars denote a histogram of data divided into 1 sec bins. Red curve is a Poisson curve with rate = median count rate of data. |
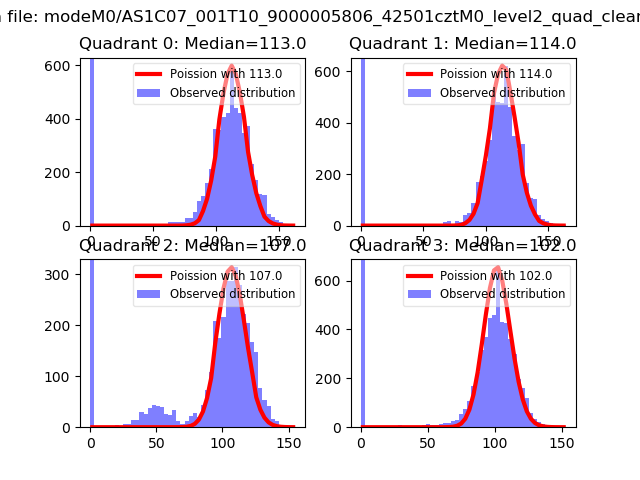 |
 |
| Quadrant-wise count rates Data is divided into 100 sec bins |
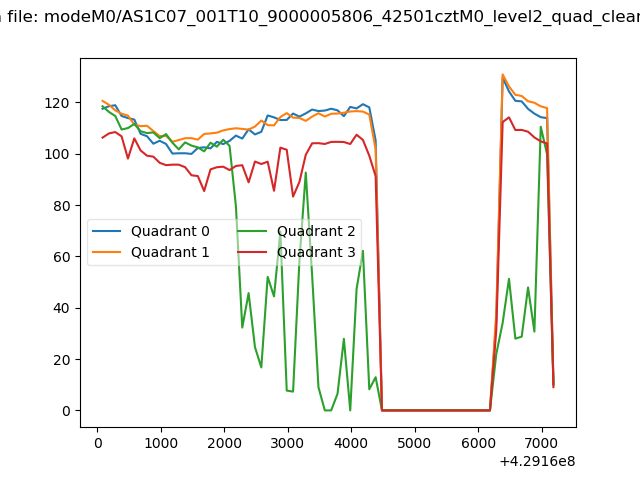 |
|
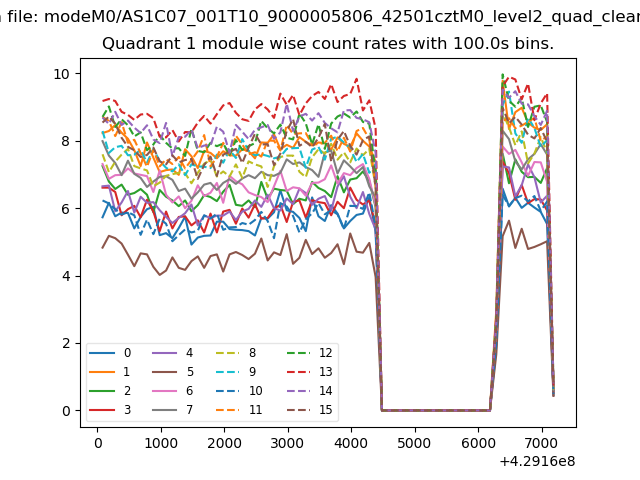
| Module-wise count rates for Quadrant A Data is divided into 100 sec bins |
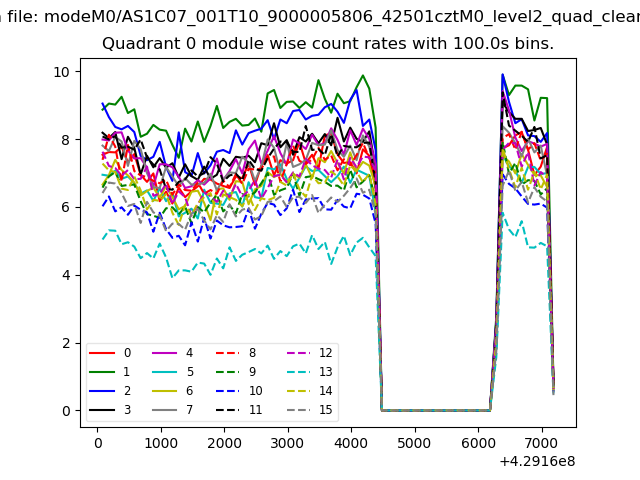 |
 |
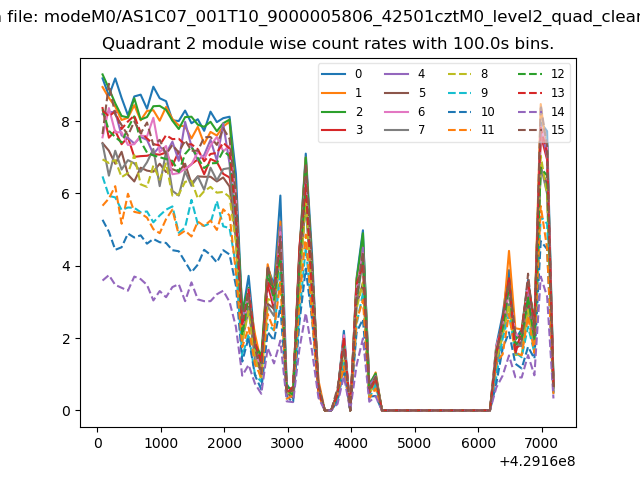
| Module-wise count rates for Quadrant B Data is divided into 100 sec bins |
 |
 |
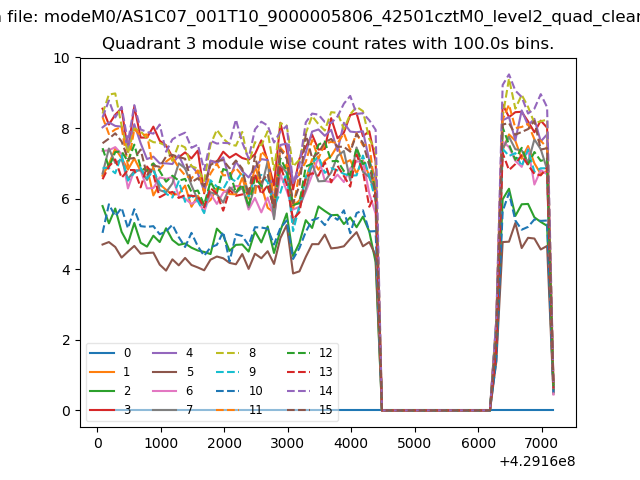
| Module-wise count rates for Quadrant C Data is divided into 100 sec bins |
 |
 |
| Module-wise count rates for Quadrant D Data is divided into 100 sec bins |
 |
 |
| Parameter | Plot |
|---|---|
| CZT HV Monitor | 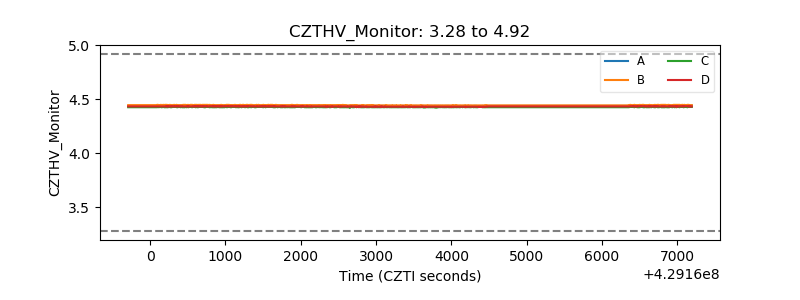 |
| D_VDD | 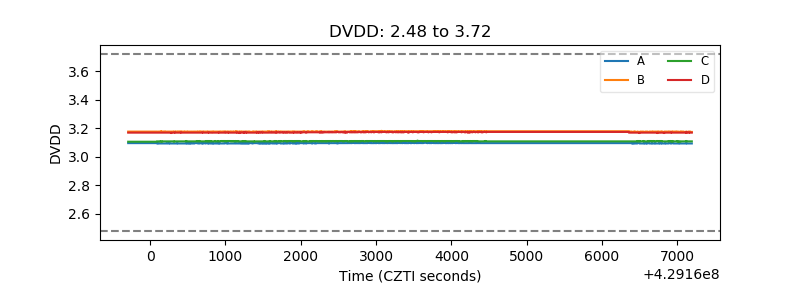 |
| Temperature 1 | 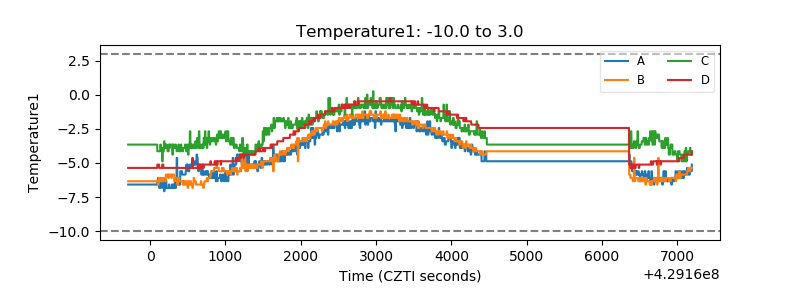 |
| Veto HV Monitor | 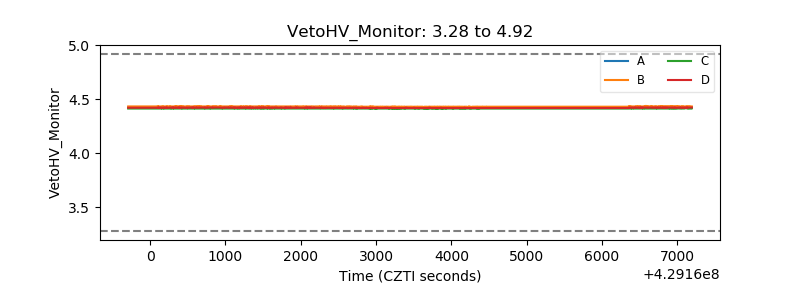 |
| Veto LLD | 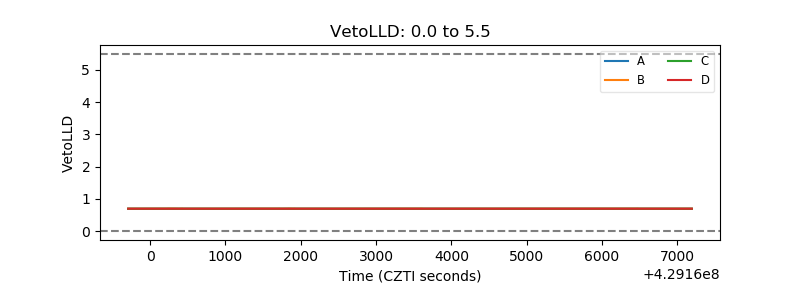 |
| Alpha Counter | 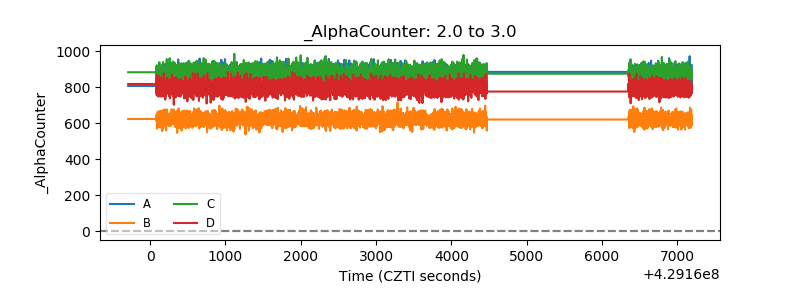 |
| _CPM_Rate | 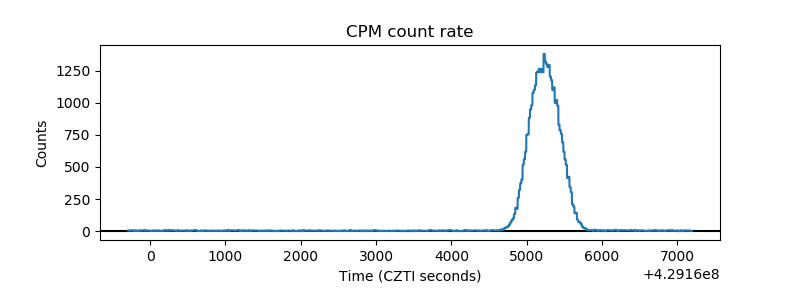 |
| CZT Counter | 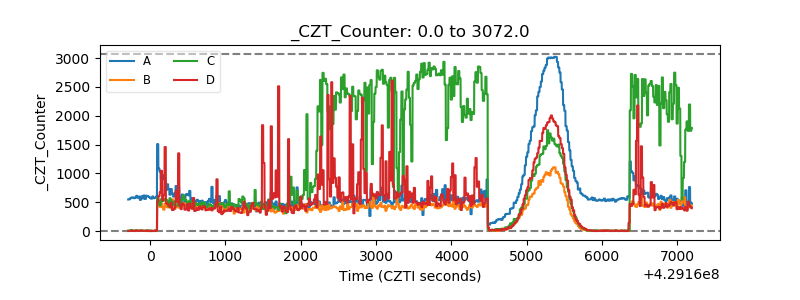 |
| +2.5 Volts monitor | 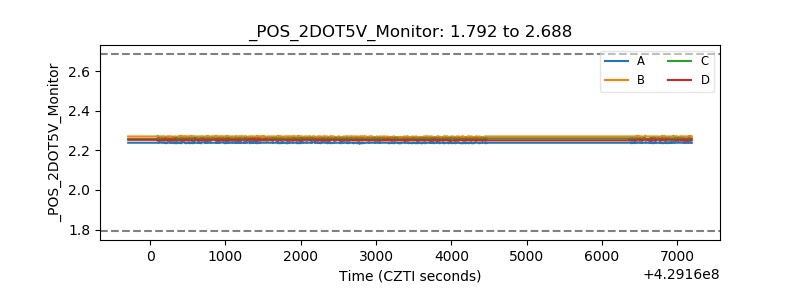 |
| +5 Volts monitor | 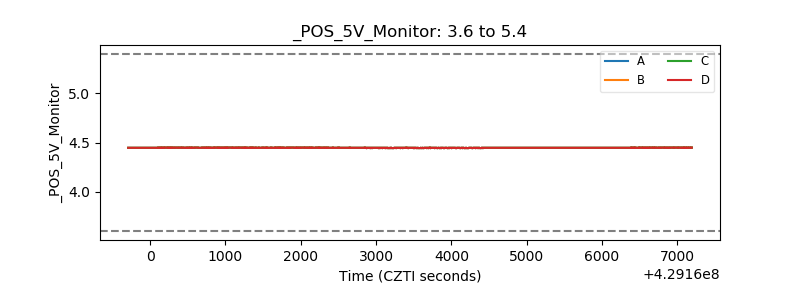 |
| _ROLL_ROT | 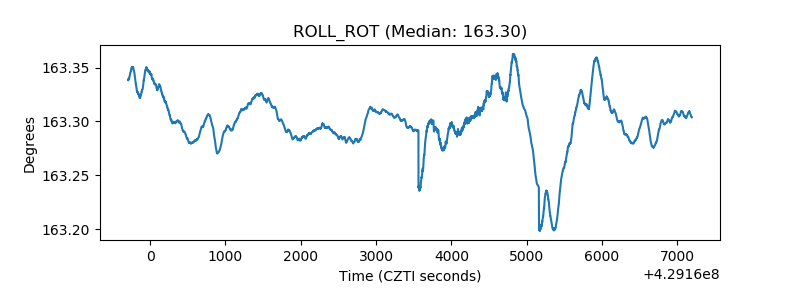 |
| _Roll_DEC | 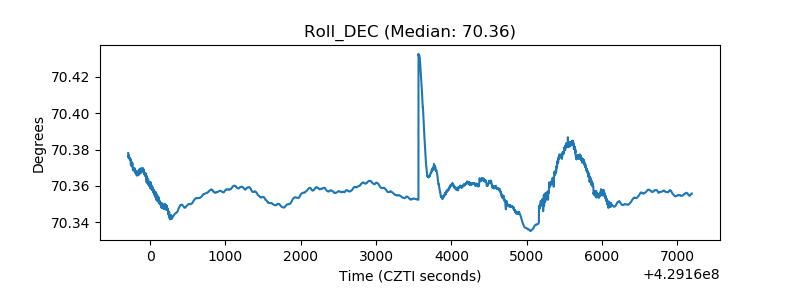 |
| _Roll_RA | 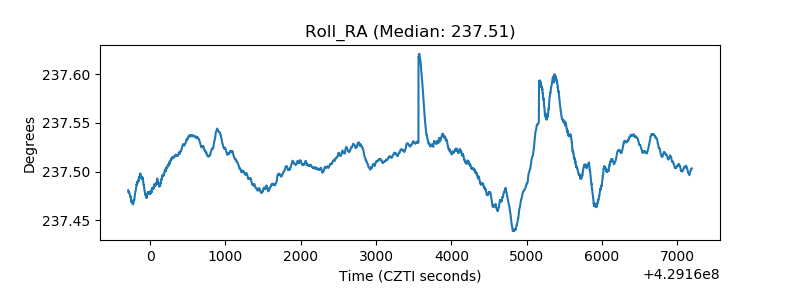 |
| Veto Counter | 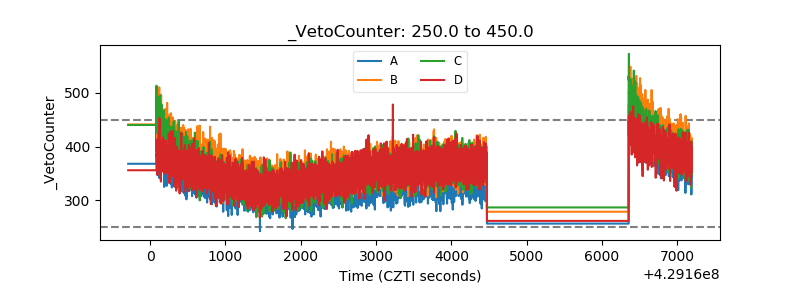 |