| Param | Original file | Final file |
|---|---|---|
| Filename | modeM0/AS1C07_001T10_9000005806_42503cztM0_level2.fits | modeM0/AS1C07_001T10_9000005806_42503cztM0_level2_quad_clean.evt |
| Size (bytes) | 323,498,880 | 87,756,480 |
| Size | 308.5 MB | 83.7 MB |
| Events in quadrant A | 2,872,639 | 605,740 |
| Events in quadrant B | 2,380,509 | 610,210 |
| Events in quadrant C | 2,976,595 | 574,672 |
| Events in quadrant D | 3,355,961 | 516,653 |
| Mode M9 | |||
|---|---|---|---|
| Quadrant | BADHDUFLAG | Total packets | Discarded packets |
| A | 0 | 22 | 0 |
| B | 0 | 23 | 0 |
| C | 0 | 23 | 0 |
| D | 0 | 23 | 0 |
| Mode SS | |||
|---|---|---|---|
| Quadrant | BADHDUFLAG | Total packets | Discarded packets |
| A | 0 | 102 | 0 |
| B | 0 | 102 | 0 |
| C | 0 | 102 | 0 |
| D | 0 | 102 | 0 |
| Mode M0 | |||
|---|---|---|---|
| Quadrant | BADHDUFLAG | Total packets | Discarded packets |
| A | 0 | 11514 | 3 |
| B | 0 | 10568 | 2 |
| C | 0 | 11959 | 2 |
| D | 0 | 13394 | 2 |
| Quadrant | Total seconds | Saturated seconds | Saturation percentage |
|---|---|---|---|
| A | 4996 | 11 | 0.220176% |
| B | 4996 | 21 | 0.420336% |
| C | 4996 | 22 | 0.440352% |
| D | 4996 | 274 | 5.484388% |
Noise dominated data is calculated using 1-second bins in cleaned event files. If a bin has >2000 counts, and if more than 50% of those come from <1% of pixels, then it is considered to be noise-dominated and hence unusable.
| Quadrant | # 1 sec bins | Bins with >0 counts | Bins with >2000 counts | High rate bins dominated by noise | Noise dominated (total time) | Noise dominated (detector-on time) | Marked lightcurve |
|---|---|---|---|---|---|---|---|
| A | 7058 | 4997 | 2 | 2 | 0.03% | 0.04% | 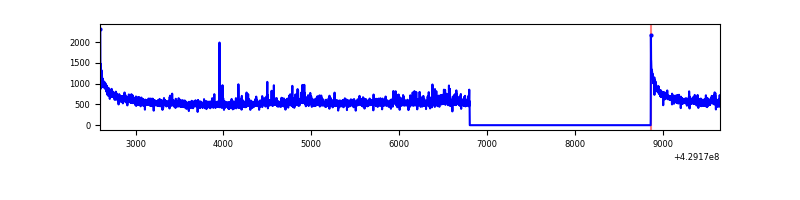 |
| B | 7058 | 4997 | 18 | 18 | 0.26% | 0.36% | 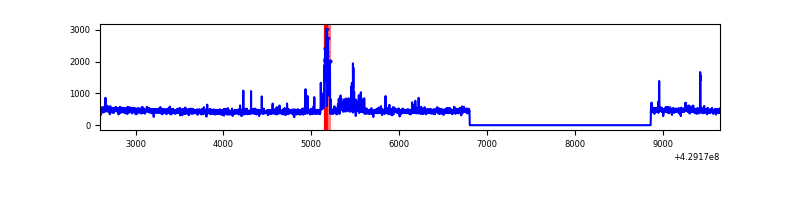 |
| C | 7058 | 4997 | 14 | 14 | 0.20% | 0.28% | 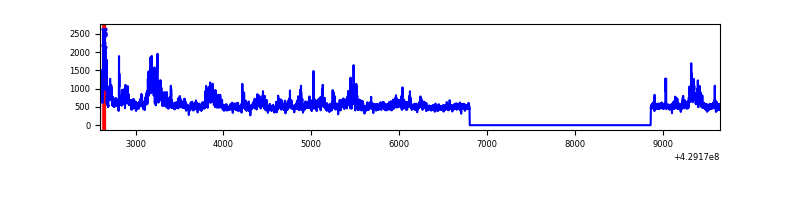 |
| D | 7058 | 4997 | 212 | 212 | 3.00% | 4.24% | 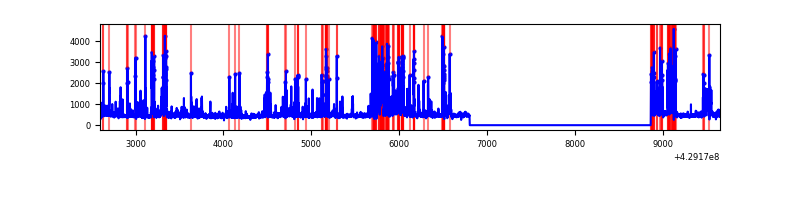 |
Top three noisy pixels from each quadrant. If the there are fewer than three noisy pixels in the level2.evt file, extra rows are filled as -1
| Pixel properties | Quadrant properties | ||||||
|---|---|---|---|---|---|---|---|
| Quadrant | DetID | PixID | Counts | Sigma | Mean | Median | Sigma |
| A | 10 | 83 | 542284 | 4680.9 | 566 | 555 | 115.7 |
| A | 12 | 189 | 94226 | 809.38 | 566 | 555 | 115.7 |
| A | 13 | 248 | 24984 | 211.08 | 566 | 555 | 115.7 |
| B | 15 | 35 | 114525 | 1082.87 | 555 | 541 | 105.3 |
| B | 0 | 245 | 73052 | 688.87 | 555 | 541 | 105.3 |
| B | 12 | 111 | 12805 | 116.51 | 555 | 541 | 105.3 |
| C | 0 | 239 | 609781 | 4892.36 | 537 | 540 | 124.5 |
| C | 15 | 214 | 210597 | 1686.81 | 537 | 540 | 124.5 |
| C | 9 | 54 | 46702 | 370.69 | 537 | 540 | 124.5 |
| D | 12 | 233 | 421306 | 3209.68 | 538 | 524 | 131.1 |
| D | 12 | 6 | 274534 | 2090.12 | 538 | 524 | 131.1 |
| D | 1 | 52 | 172117 | 1308.89 | 538 | 524 | 131.1 |
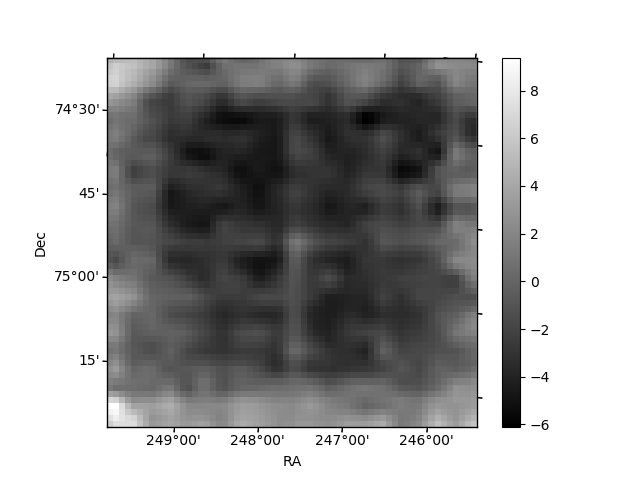
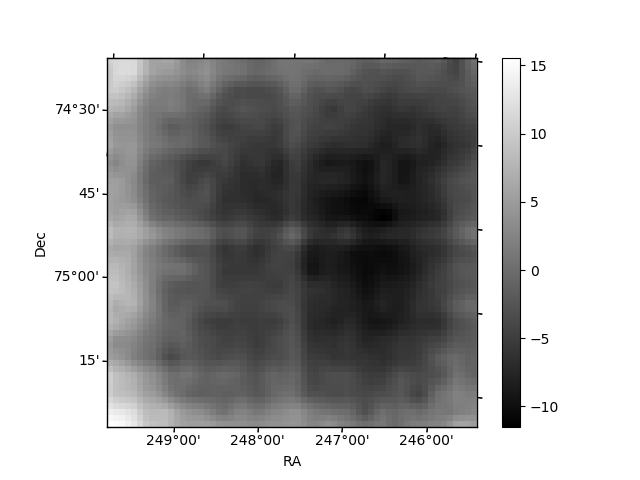
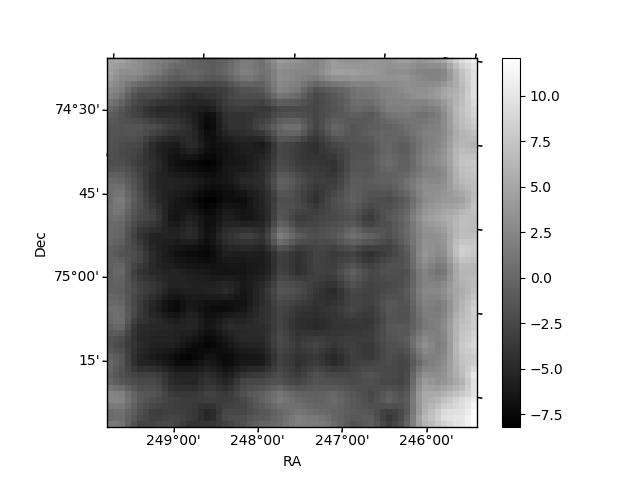
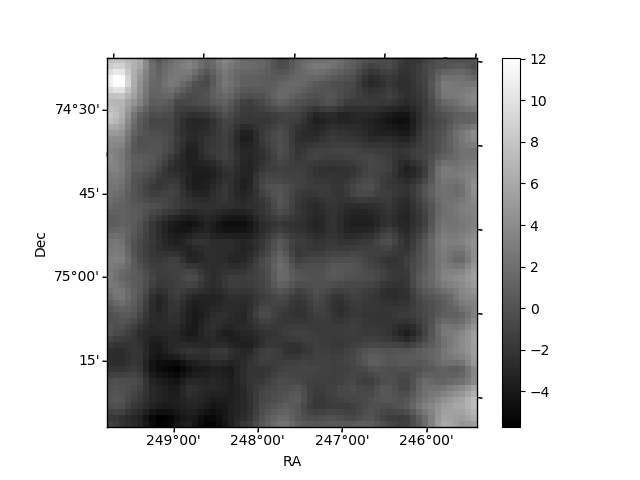
Histogram calculated using DETX and DETY for each event in the final _common_clean file
| Quadrant A | 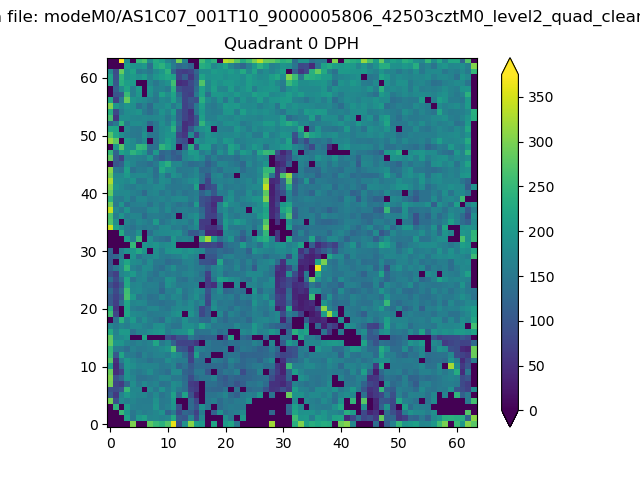 |
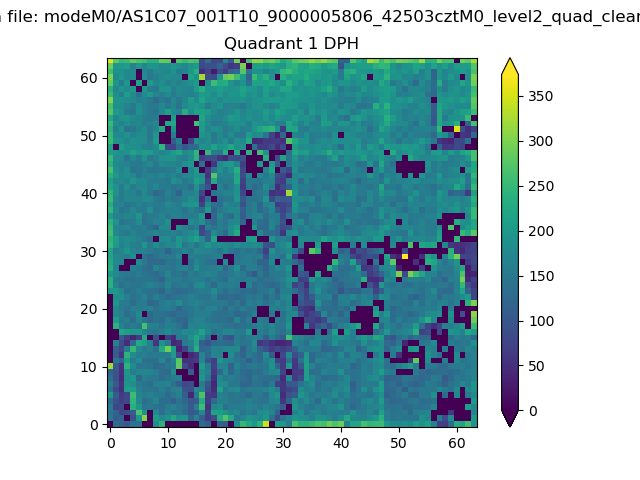 |
Quadrant B |
|---|---|---|---|
| Quadrant D | 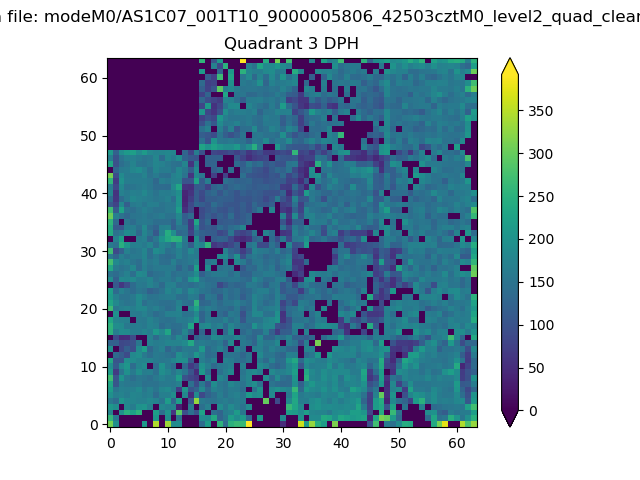 |
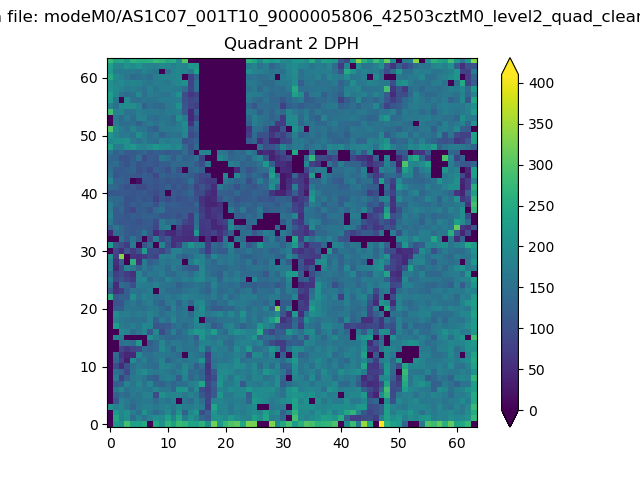 |
Quadrant C |
| Plot type | Count rate plots | Images |
|---|---|---|
| Comparison with Poisson distribution Blue bars denote a histogram of data divided into 1 sec bins. Red curve is a Poisson curve with rate = median count rate of data. |
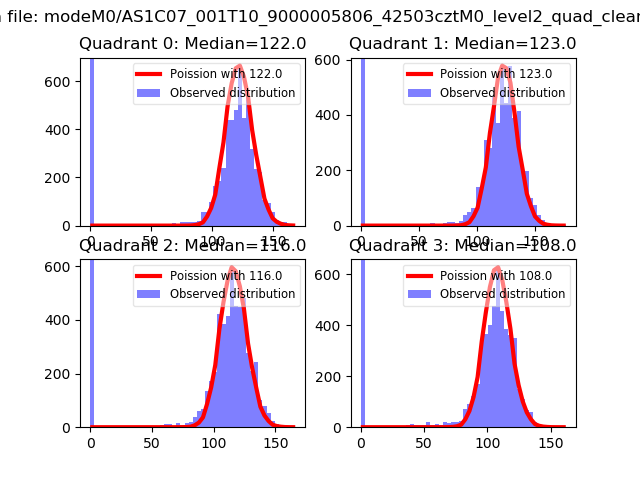 |
 |
| Quadrant-wise count rates Data is divided into 100 sec bins |
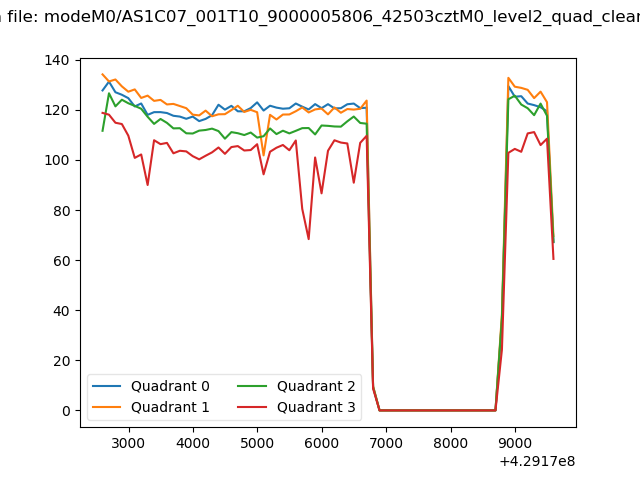 |
|
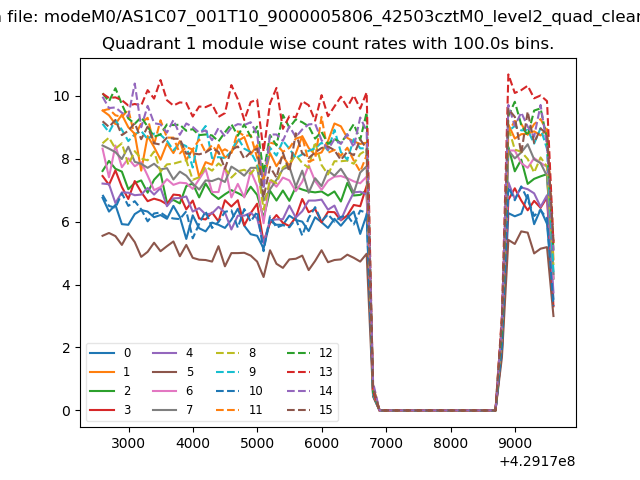
| Module-wise count rates for Quadrant A Data is divided into 100 sec bins |
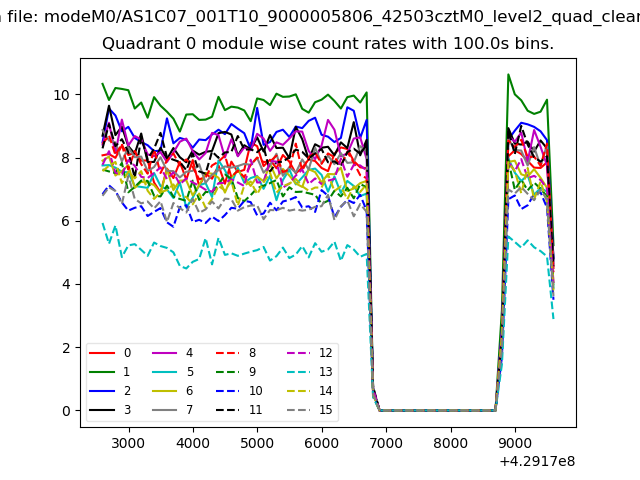 |
 |
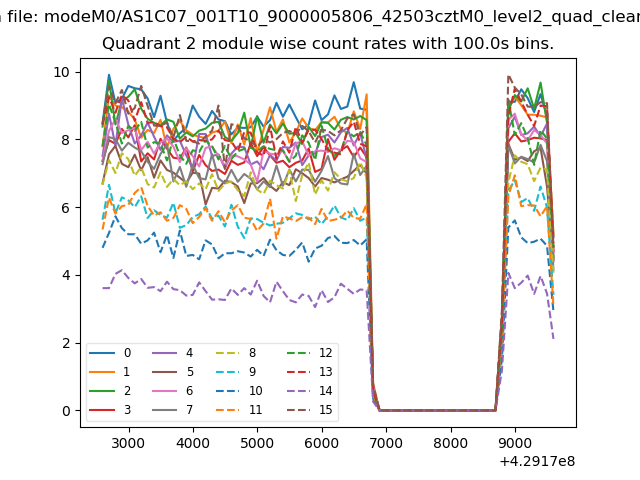
| Module-wise count rates for Quadrant B Data is divided into 100 sec bins |
 |
 |
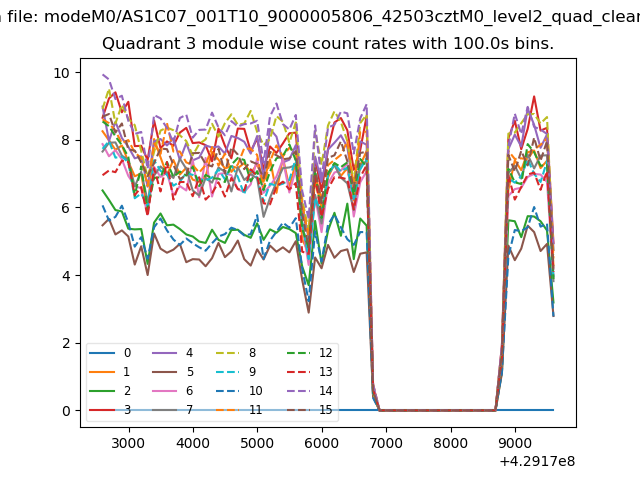
| Module-wise count rates for Quadrant C Data is divided into 100 sec bins |
 |
 |
| Module-wise count rates for Quadrant D Data is divided into 100 sec bins |
 |
 |
| Parameter | Plot |
|---|---|
| CZT HV Monitor | 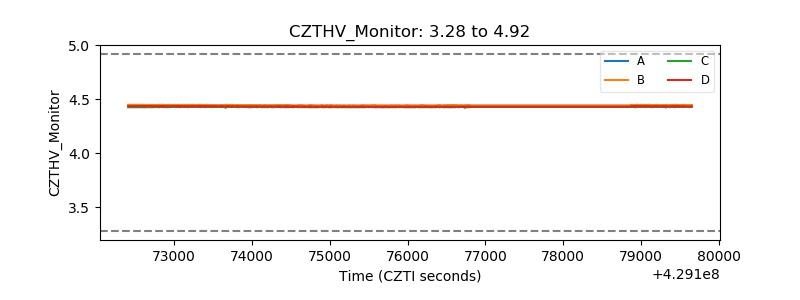 |
| D_VDD | 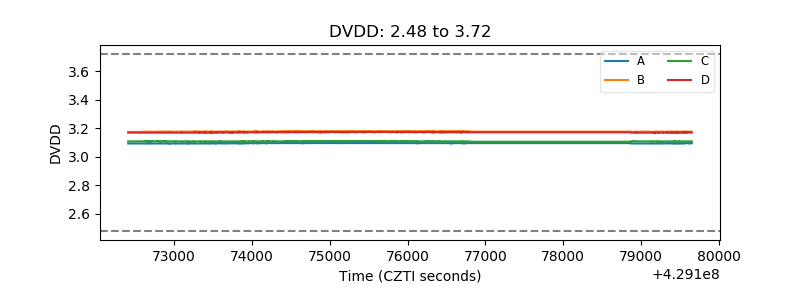 |
| Temperature 1 | 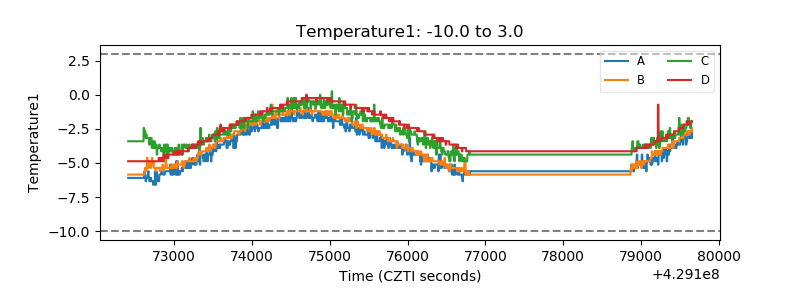 |
| Veto HV Monitor | 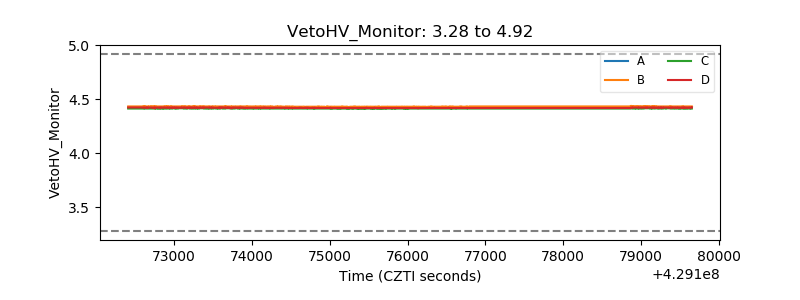 |
| Veto LLD | 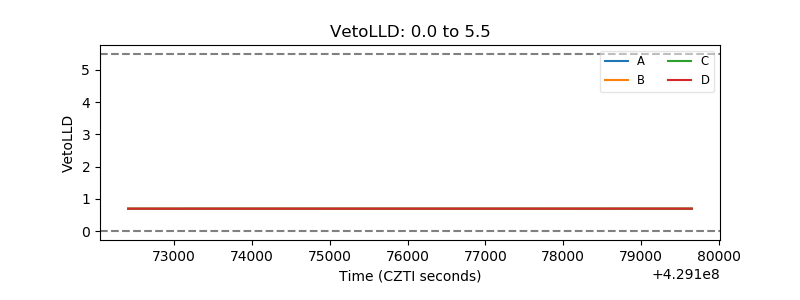 |
| Alpha Counter |  |
| _CPM_Rate |  |
| CZT Counter | 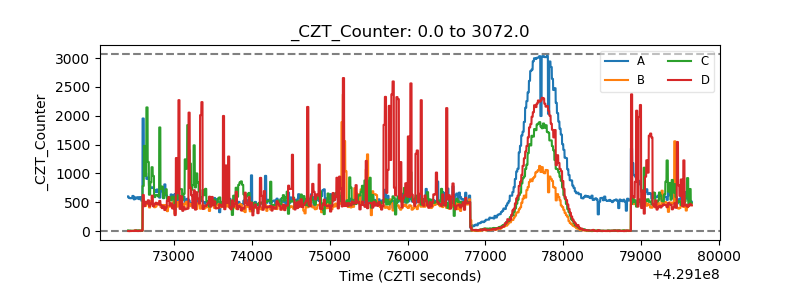 |
| +2.5 Volts monitor | 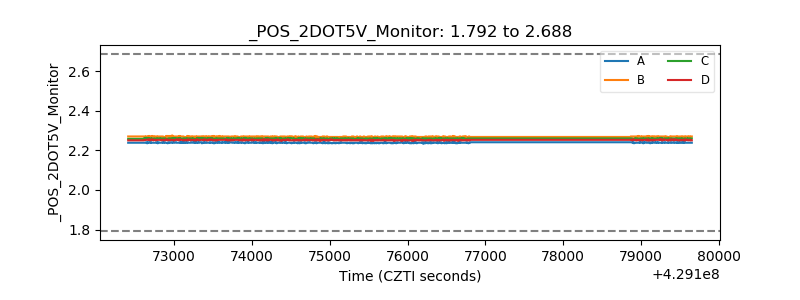 |
| +5 Volts monitor |  |
| _ROLL_ROT | 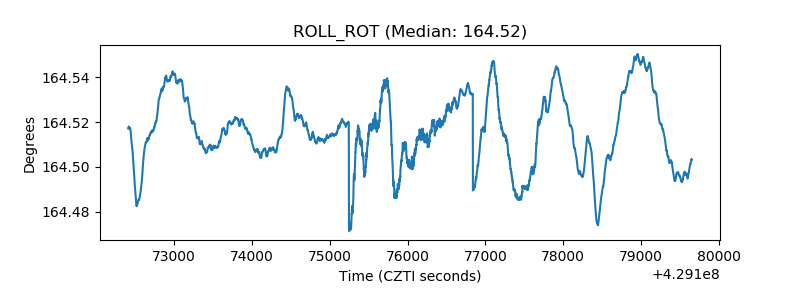 |
| _Roll_DEC | 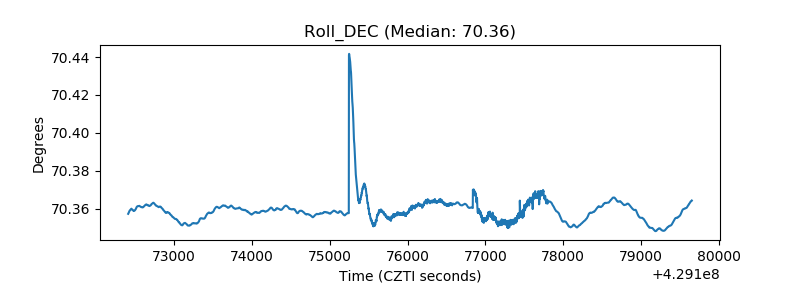 |
| _Roll_RA | 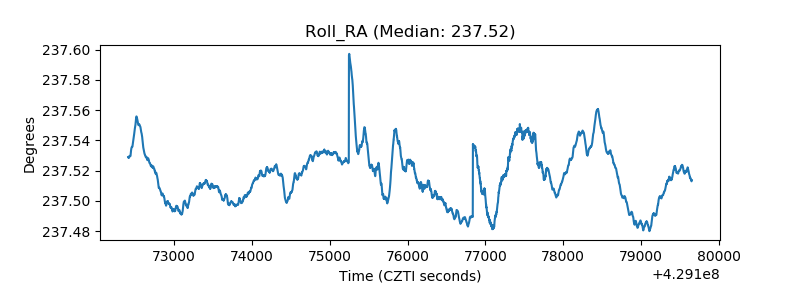 |
| Veto Counter | 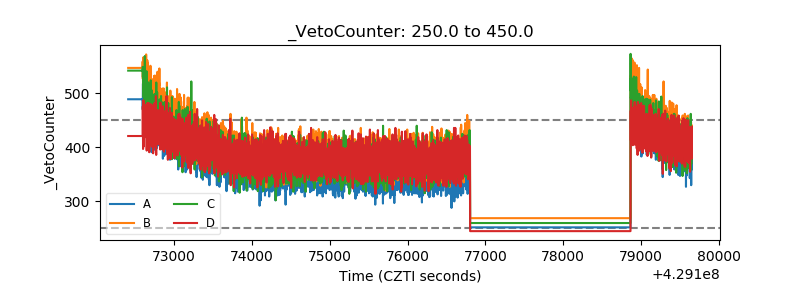 |