| Param | Original file | Final file |
|---|---|---|
| Filename | modeM0/AS1C07_001T10_9000005806_42505cztM0_level2.fits | modeM0/AS1C07_001T10_9000005806_42505cztM0_level2_quad_clean.evt |
| Size (bytes) | 334,779,840 | 82,497,600 |
| Size | 319.3 MB | 78.7 MB |
| Events in quadrant A | 2,821,791 | 570,239 |
| Events in quadrant B | 2,211,331 | 569,347 |
| Events in quadrant C | 2,353,378 | 541,381 |
| Events in quadrant D | 4,620,529 | 470,342 |
| Mode M9 | |||
|---|---|---|---|
| Quadrant | BADHDUFLAG | Total packets | Discarded packets |
| A | 0 | 28 | 0 |
| B | 0 | 29 | 0 |
| C | 0 | 29 | 0 |
| D | 0 | 29 | 0 |
| Mode SS | |||
|---|---|---|---|
| Quadrant | BADHDUFLAG | Total packets | Discarded packets |
| A | 0 | 100 | 0 |
| B | 0 | 100 | 0 |
| C | 0 | 100 | 0 |
| D | 0 | 100 | 0 |
| Mode M0 | |||
|---|---|---|---|
| Quadrant | BADHDUFLAG | Total packets | Discarded packets |
| A | 0 | 11370 | 2 |
| B | 0 | 10087 | 2 |
| C | 0 | 10202 | 2 |
| D | 0 | 17153 | 2 |
| Quadrant | Total seconds | Saturated seconds | Saturation percentage |
|---|---|---|---|
| A | 4945 | 16 | 0.323559% |
| B | 4945 | 10 | 0.202224% |
| C | 4945 | 6 | 0.121335% |
| D | 4945 | 496 | 10.030334% |
Noise dominated data is calculated using 1-second bins in cleaned event files. If a bin has >2000 counts, and if more than 50% of those come from <1% of pixels, then it is considered to be noise-dominated and hence unusable.
| Quadrant | # 1 sec bins | Bins with >0 counts | Bins with >2000 counts | High rate bins dominated by noise | Noise dominated (total time) | Noise dominated (detector-on time) | Marked lightcurve |
|---|---|---|---|---|---|---|---|
| A | 7068 | 4946 | 3 | 3 | 0.04% | 0.06% | 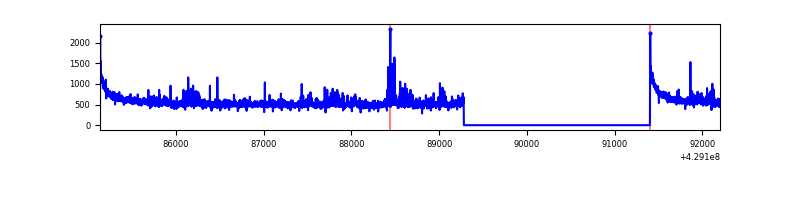 |
| B | 7068 | 4946 | 2 | 2 | 0.03% | 0.04% | 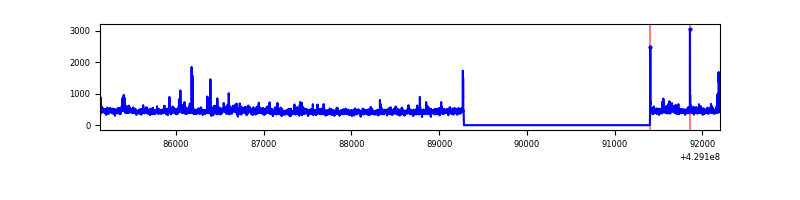 |
| C | 7068 | 4946 | 2 | 2 | 0.03% | 0.04% | 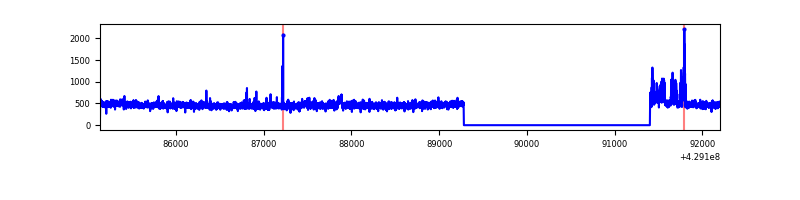 |
| D | 7068 | 4946 | 440 | 440 | 6.23% | 8.90% | 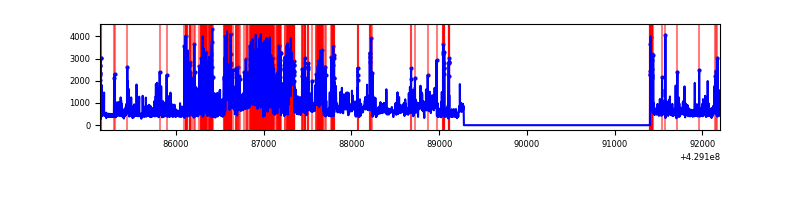 |
Top three noisy pixels from each quadrant. If the there are fewer than three noisy pixels in the level2.evt file, extra rows are filled as -1
| Pixel properties | Quadrant properties | ||||||
|---|---|---|---|---|---|---|---|
| Quadrant | DetID | PixID | Counts | Sigma | Mean | Median | Sigma |
| A | 10 | 83 | 571919 | 5191.44 | 539 | 529 | 110.1 |
| A | 12 | 189 | 106372 | 961.65 | 539 | 529 | 110.1 |
| A | 13 | 248 | 45435 | 408.0 | 539 | 529 | 110.1 |
| B | 0 | 245 | 63378 | 624.61 | 527 | 514 | 100.6 |
| B | 0 | 229 | 24578 | 239.09 | 527 | 514 | 100.6 |
| B | 3 | 112 | 14604 | 139.99 | 527 | 514 | 100.6 |
| C | 15 | 214 | 222094 | 1830.16 | 518 | 520 | 121.1 |
| C | 9 | 54 | 87548 | 718.84 | 518 | 520 | 121.1 |
| C | 14 | 254 | 7773 | 59.91 | 518 | 520 | 121.1 |
| D | 12 | 233 | 1060389 | 8566.46 | 506 | 492 | 123.7 |
| D | 2 | 16 | 861692 | 6960.52 | 506 | 492 | 123.7 |
| D | 2 | 249 | 265663 | 2143.2 | 506 | 492 | 123.7 |
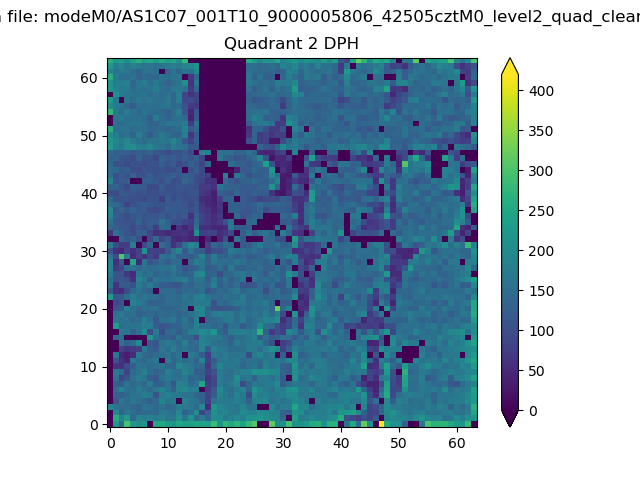
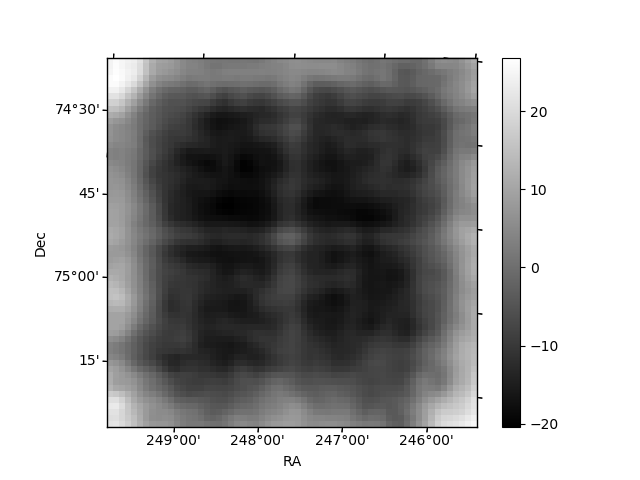
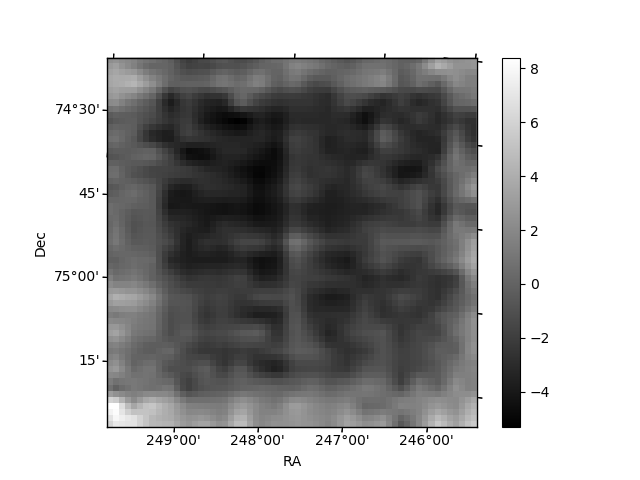
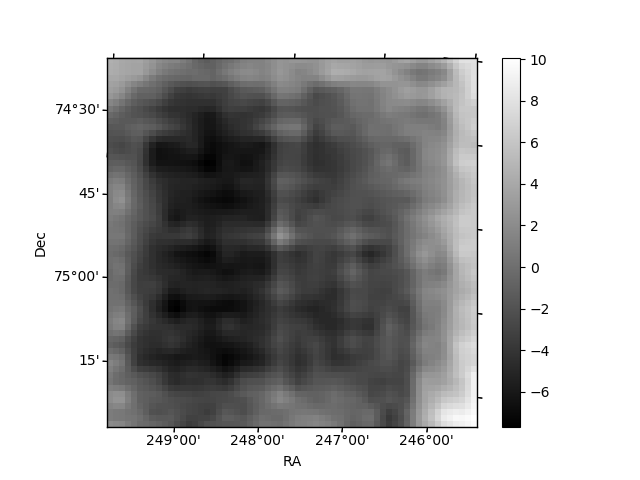
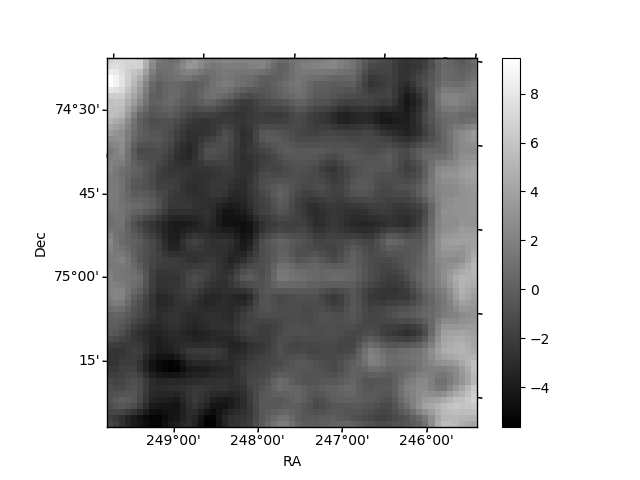
Histogram calculated using DETX and DETY for each event in the final _common_clean file
| Quadrant A | 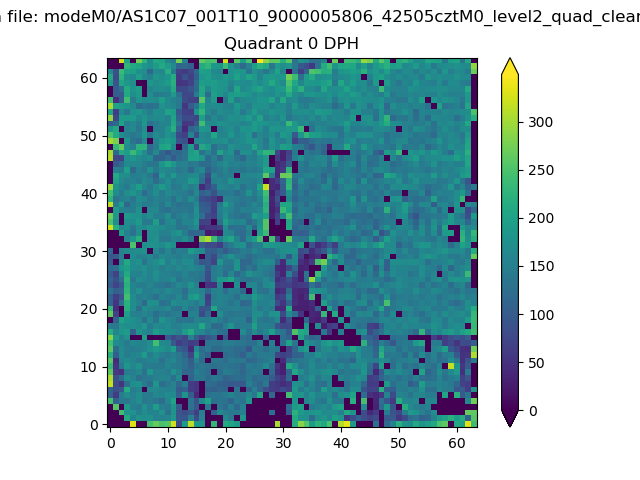 |
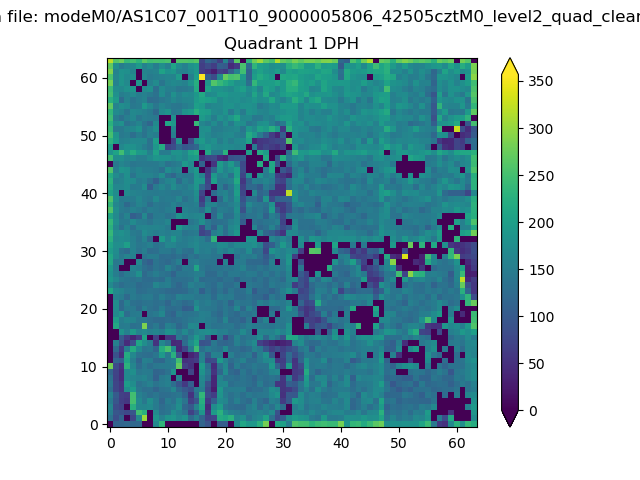 |
Quadrant B |
|---|---|---|---|
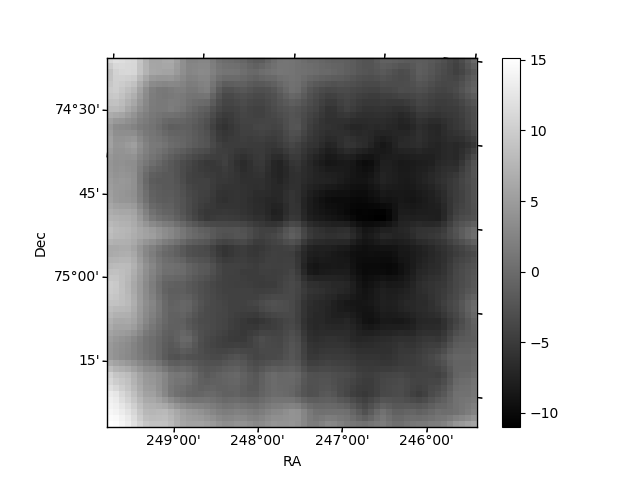
| Quadrant D | 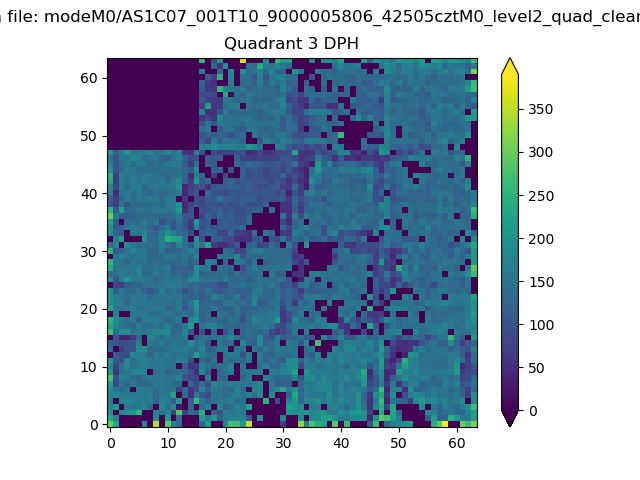 |
 |
Quadrant C |
| Plot type | Count rate plots | Images |
|---|---|---|
| Comparison with Poisson distribution Blue bars denote a histogram of data divided into 1 sec bins. Red curve is a Poisson curve with rate = median count rate of data. |
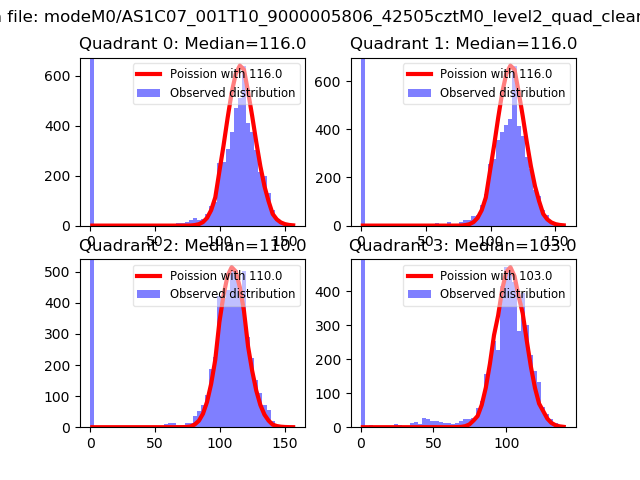 |
 |
| Quadrant-wise count rates Data is divided into 100 sec bins |
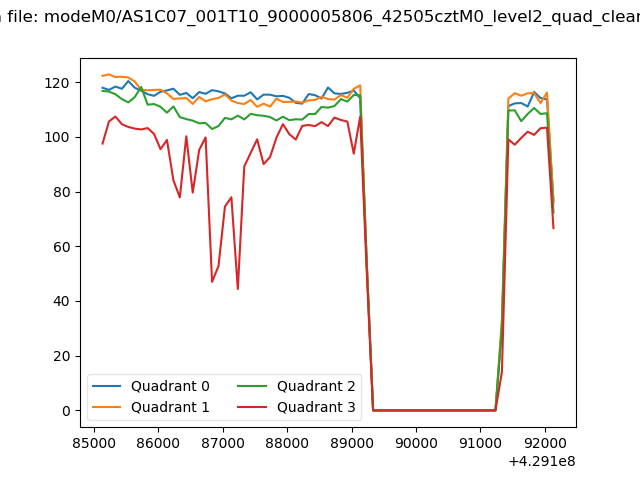 |
|
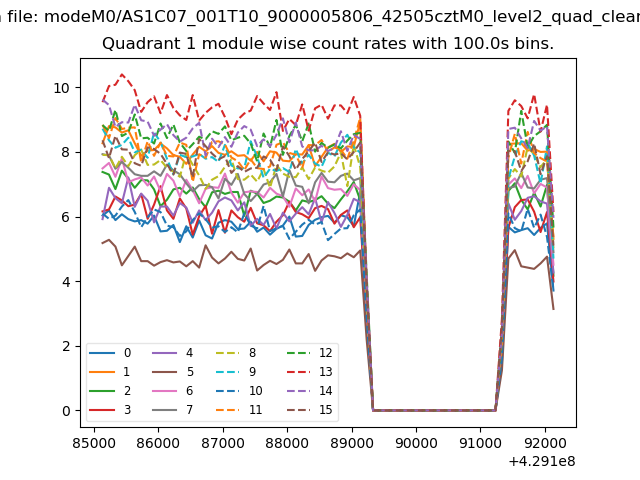
| Module-wise count rates for Quadrant A Data is divided into 100 sec bins |
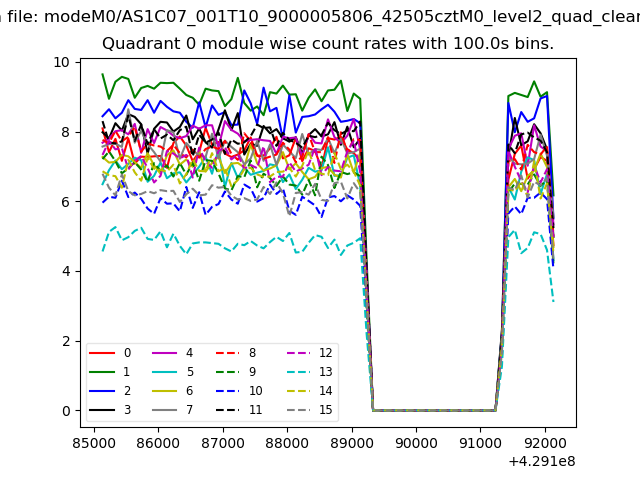 |
 |
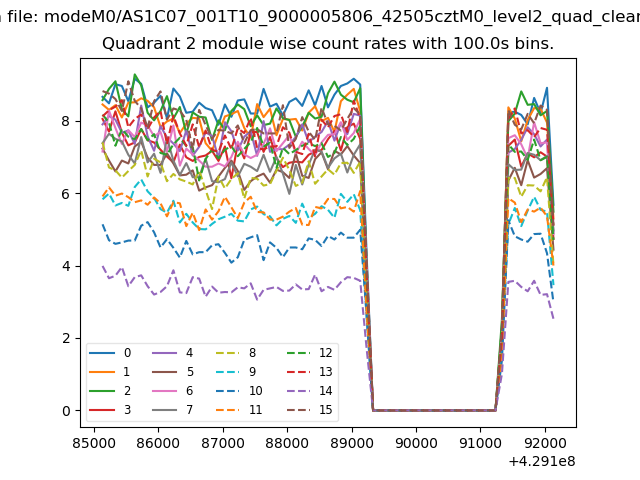
| Module-wise count rates for Quadrant B Data is divided into 100 sec bins |
 |
 |
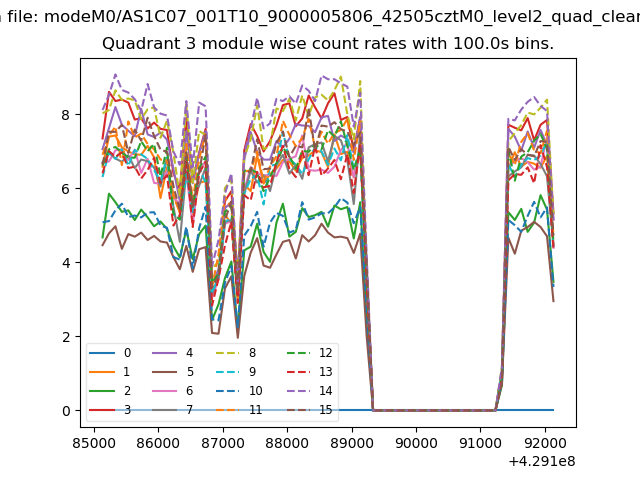
| Module-wise count rates for Quadrant C Data is divided into 100 sec bins |
 |
 |
| Module-wise count rates for Quadrant D Data is divided into 100 sec bins |
 |
 |
| Parameter | Plot |
|---|---|
| CZT HV Monitor | 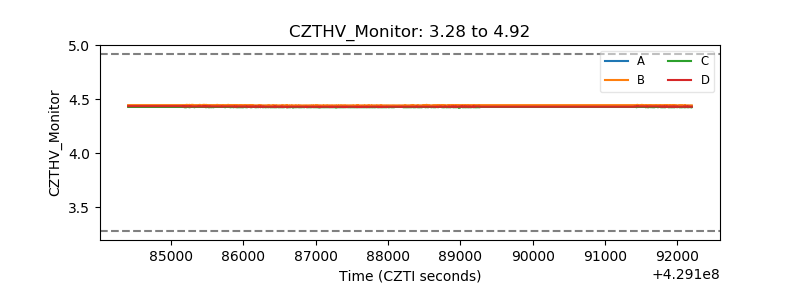 |
| D_VDD | 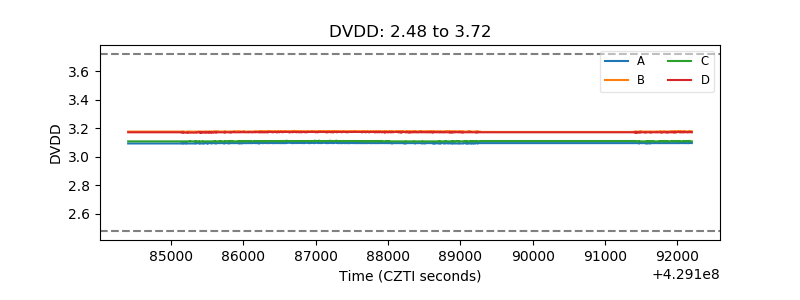 |
| Temperature 1 | 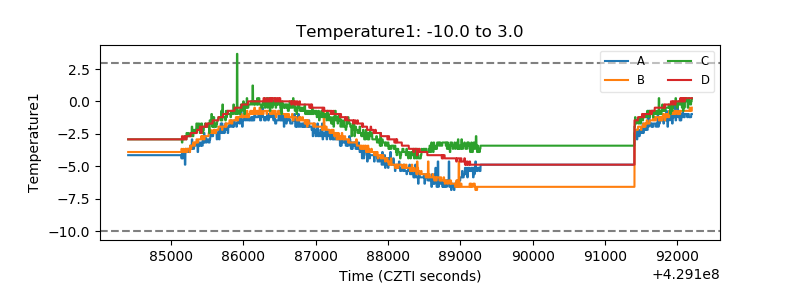 |
| Veto HV Monitor | 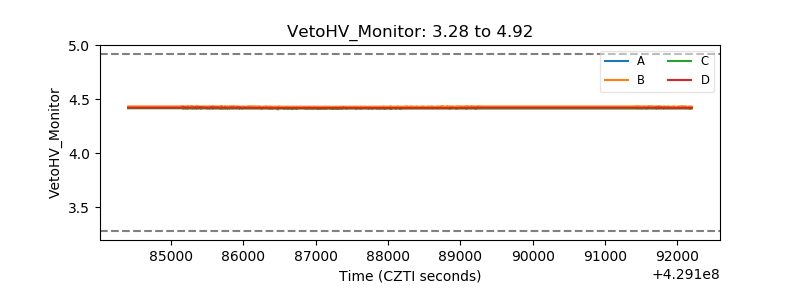 |
| Veto LLD | 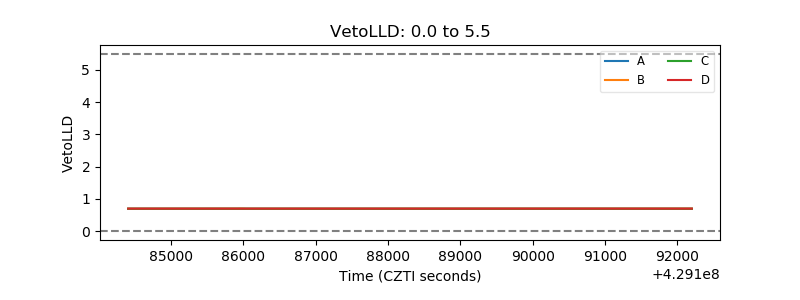 |
| Alpha Counter | 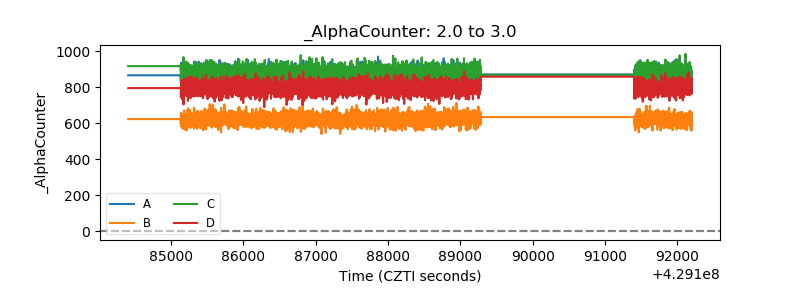 |
| _CPM_Rate | 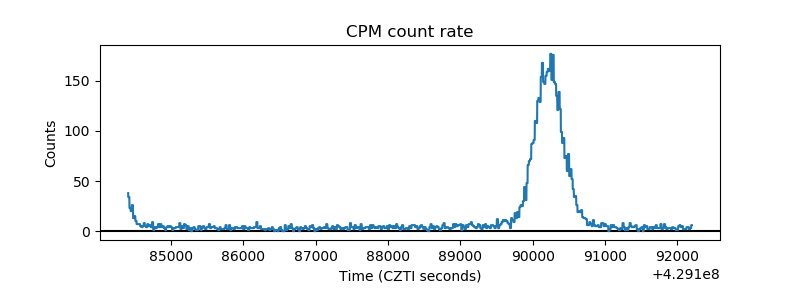 |
| CZT Counter | 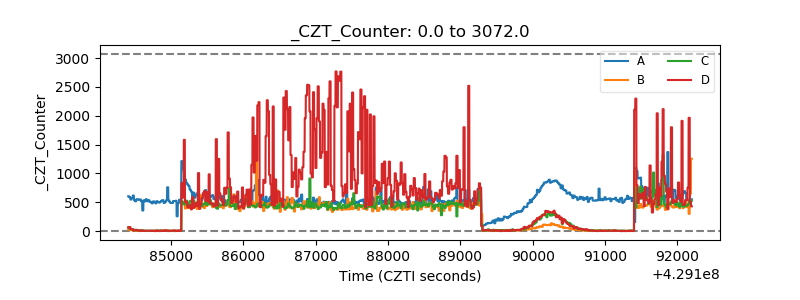 |
| +2.5 Volts monitor | 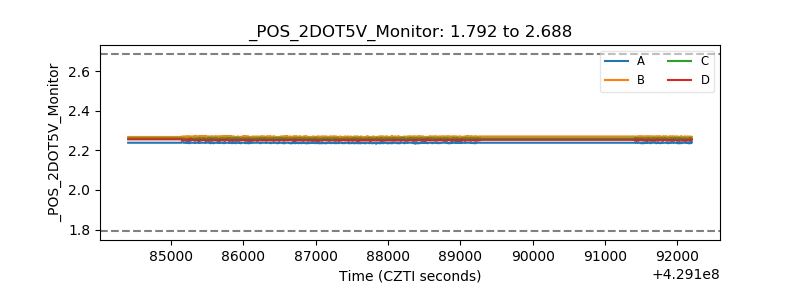 |
| +5 Volts monitor | 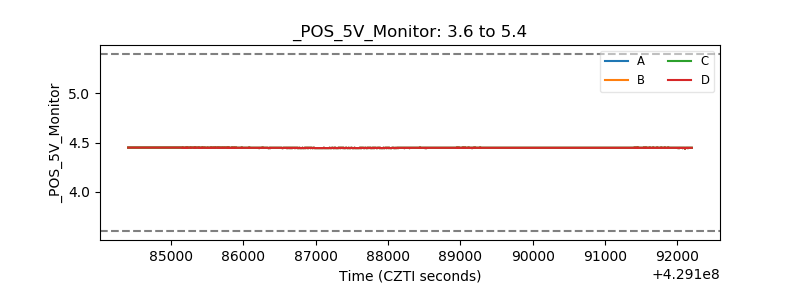 |
| _ROLL_ROT | 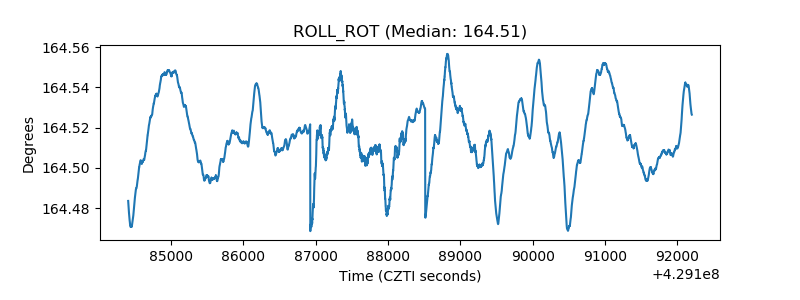 |
| _Roll_DEC | 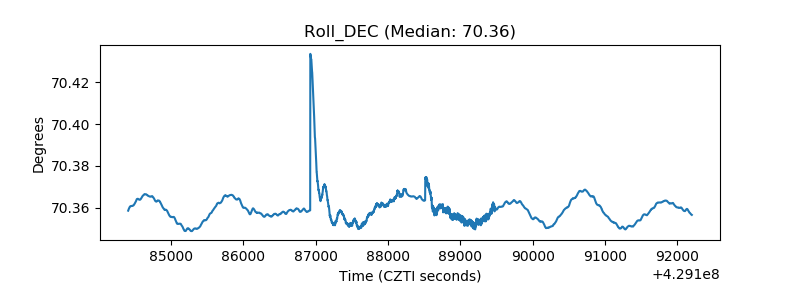 |
| _Roll_RA | 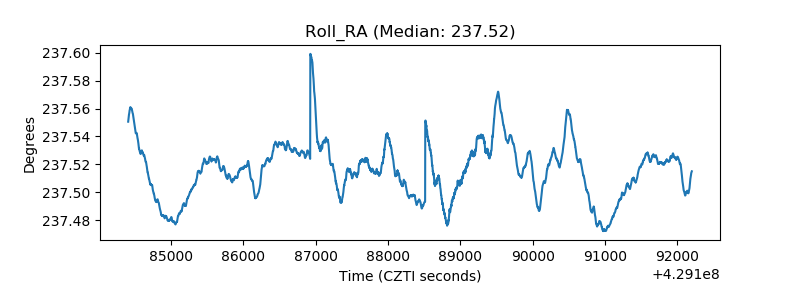 |
| Veto Counter | 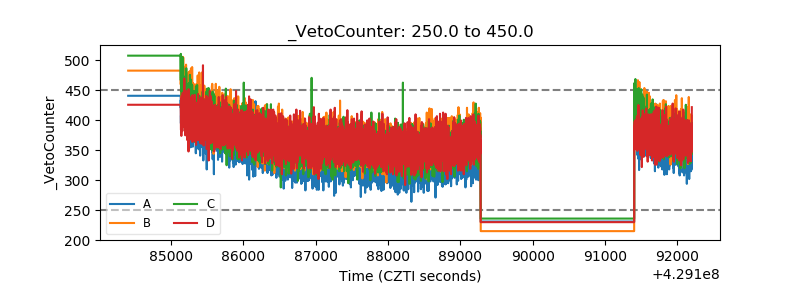 |