| Param | Original file | Final file |
|---|---|---|
| Filename | modeM0/AS1C07_001T10_9000005806_42506cztM0_level2.fits | modeM0/AS1C07_001T10_9000005806_42506cztM0_level2_quad_clean.evt |
| Size (bytes) | 339,364,800 | 88,482,240 |
| Size | 323.6 MB | 84.4 MB |
| Events in quadrant A | 3,029,778 | 603,368 |
| Events in quadrant B | 2,747,642 | 595,300 |
| Events in quadrant C | 2,576,478 | 569,385 |
| Events in quadrant D | 3,790,487 | 535,158 |
| Mode M9 | |||
|---|---|---|---|
| Quadrant | BADHDUFLAG | Total packets | Discarded packets |
| A | 0 | 19 | 0 |
| B | 0 | 19 | 0 |
| C | 0 | 19 | 0 |
| D | 0 | 19 | 0 |
| Mode SS | |||
|---|---|---|---|
| Quadrant | BADHDUFLAG | Total packets | Discarded packets |
| A | 0 | 110 | 0 |
| B | 0 | 110 | 0 |
| C | 0 | 110 | 0 |
| D | 0 | 110 | 0 |
| Mode M0 | |||
|---|---|---|---|
| Quadrant | BADHDUFLAG | Total packets | Discarded packets |
| A | 0 | 12280 | 2 |
| B | 0 | 11883 | 1 |
| C | 0 | 11186 | 1 |
| D | 0 | 14930 | 1 |
| Quadrant | Total seconds | Saturated seconds | Saturation percentage |
|---|---|---|---|
| A | 5365 | 13 | 0.242311% |
| B | 5365 | 33 | 0.615098% |
| C | 5365 | 7 | 0.130475% |
| D | 5366 | 131 | 2.441297% |
Noise dominated data is calculated using 1-second bins in cleaned event files. If a bin has >2000 counts, and if more than 50% of those come from <1% of pixels, then it is considered to be noise-dominated and hence unusable.
| Quadrant | # 1 sec bins | Bins with >0 counts | Bins with >2000 counts | High rate bins dominated by noise | Noise dominated (total time) | Noise dominated (detector-on time) | Marked lightcurve |
|---|---|---|---|---|---|---|---|
| A | 7277 | 5366 | 3 | 3 | 0.04% | 0.06% | 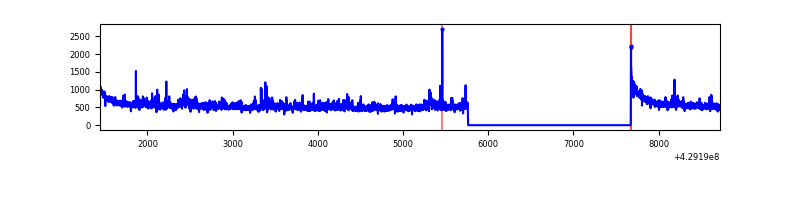 |
| B | 7277 | 5366 | 23 | 23 | 0.32% | 0.43% | 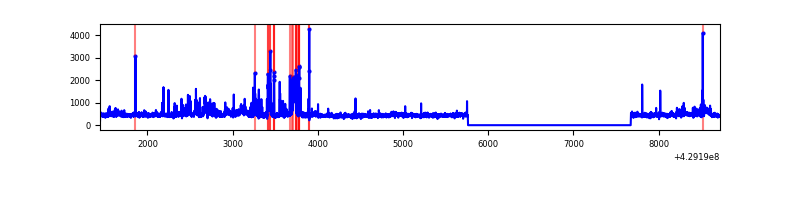 |
| C | 7277 | 5366 | 5 | 5 | 0.07% | 0.09% | 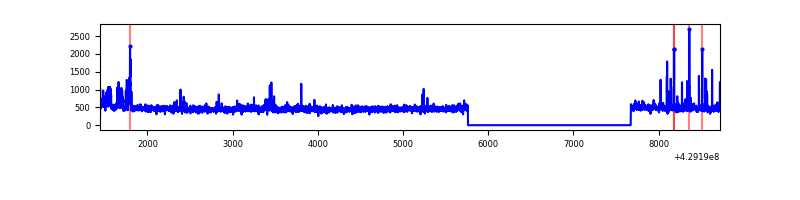 |
| D | 7278 | 5367 | 118 | 118 | 1.62% | 2.20% | 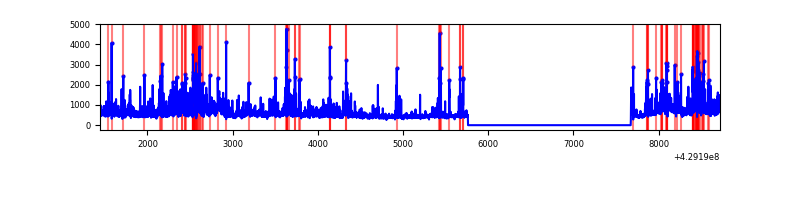 |
Top three noisy pixels from each quadrant. If the there are fewer than three noisy pixels in the level2.evt file, extra rows are filled as -1
| Pixel properties | Quadrant properties | ||||||
|---|---|---|---|---|---|---|---|
| Quadrant | DetID | PixID | Counts | Sigma | Mean | Median | Sigma |
| A | 10 | 83 | 600758 | 5126.64 | 571 | 560 | 117.1 |
| A | 12 | 189 | 177884 | 1514.63 | 571 | 560 | 117.1 |
| A | 13 | 248 | 25518 | 213.18 | 571 | 560 | 117.1 |
| B | 0 | 229 | 402060 | 3727.4 | 561 | 546 | 107.7 |
| B | 0 | 245 | 80086 | 738.4 | 561 | 546 | 107.7 |
| B | 15 | 35 | 20172 | 182.2 | 561 | 546 | 107.7 |
| C | 15 | 214 | 240510 | 1868.36 | 553 | 555 | 128.4 |
| C | 9 | 54 | 148499 | 1151.94 | 553 | 555 | 128.4 |
| C | 0 | 239 | 8733 | 63.68 | 553 | 555 | 128.4 |
| D | 1 | 52 | 644556 | 4766.05 | 556 | 540 | 135.1 |
| D | 12 | 233 | 289575 | 2139.01 | 556 | 540 | 135.1 |
| D | 10 | 118 | 223860 | 1652.68 | 556 | 540 | 135.1 |
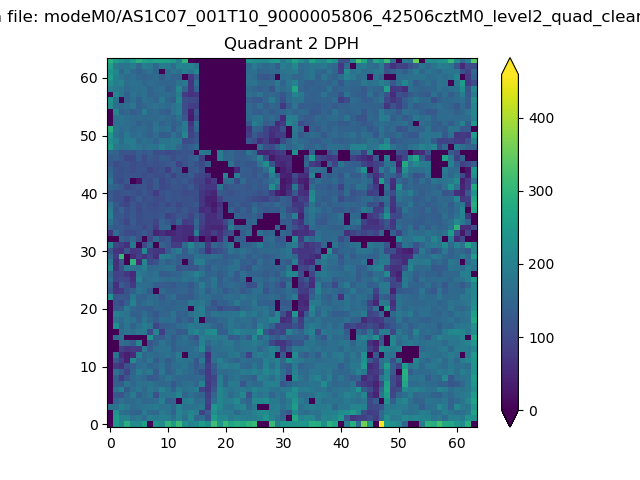
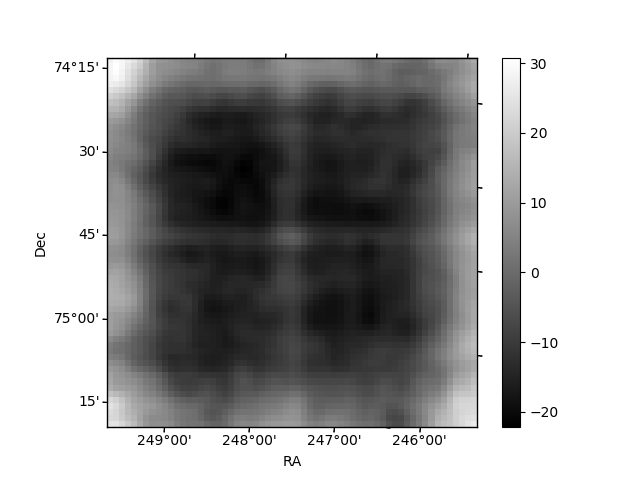
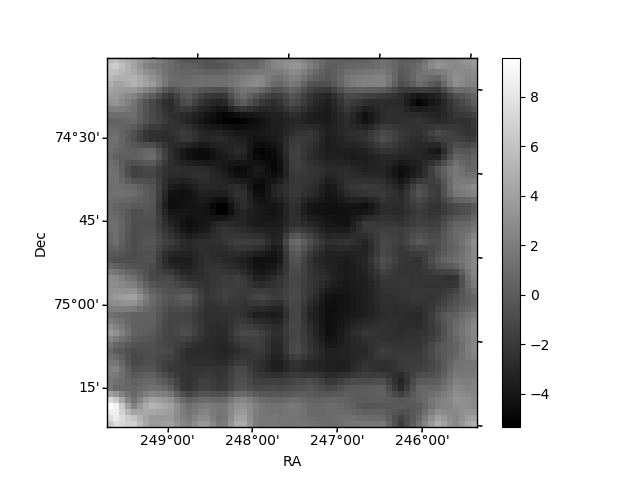
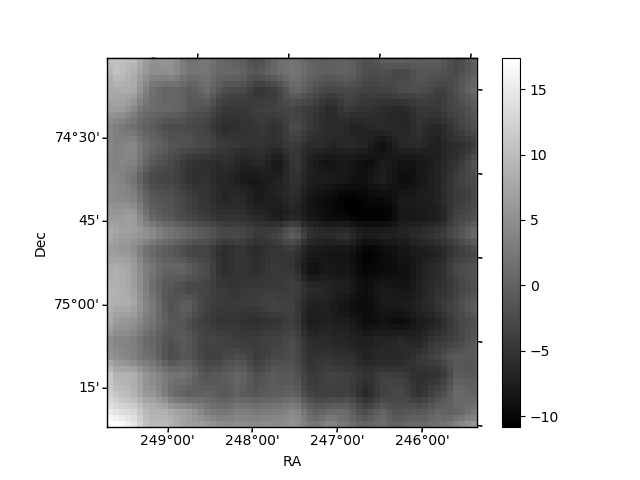
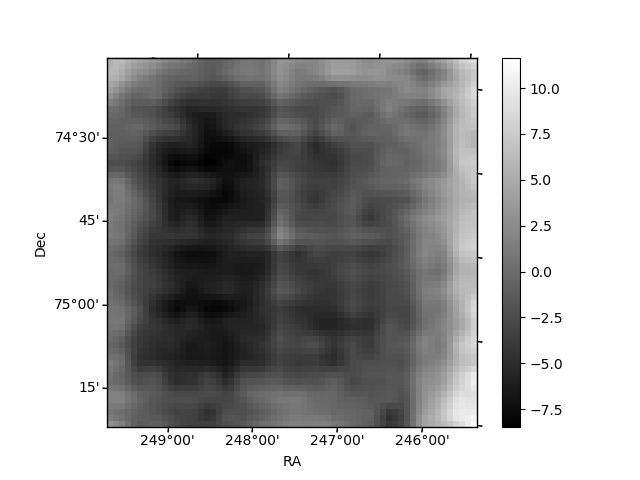
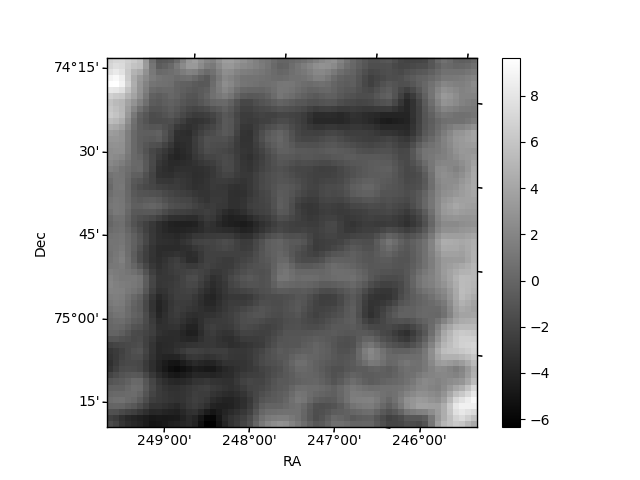
Histogram calculated using DETX and DETY for each event in the final _common_clean file
| Quadrant A | 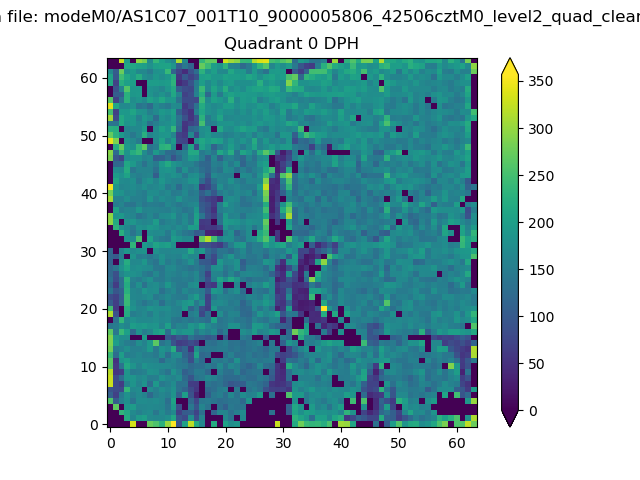 |
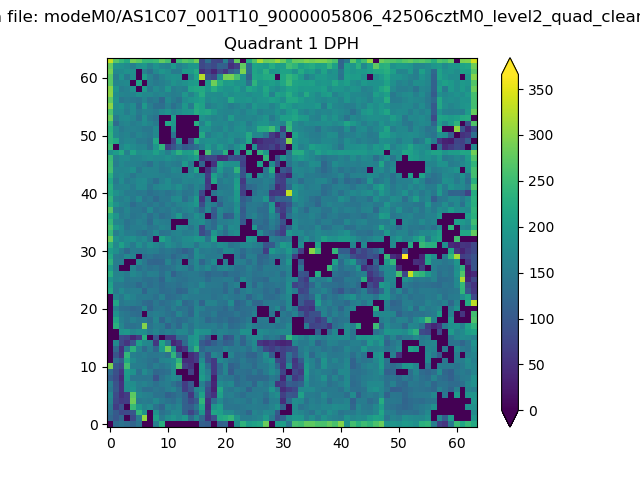 |
Quadrant B |
|---|---|---|---|
| Quadrant D | 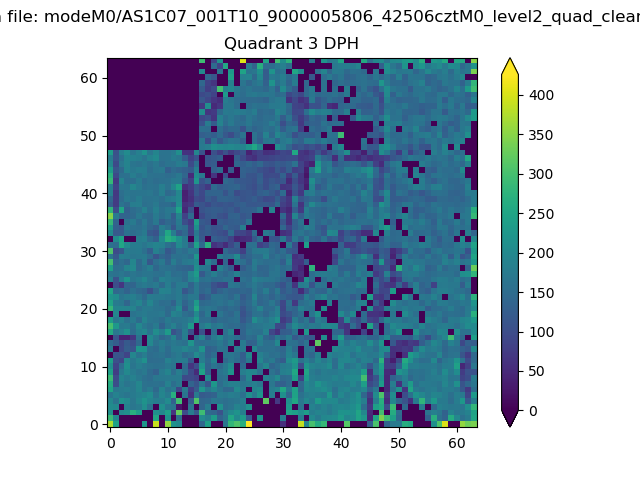 |
 |
Quadrant C |
| Plot type | Count rate plots | Images |
|---|---|---|
| Comparison with Poisson distribution Blue bars denote a histogram of data divided into 1 sec bins. Red curve is a Poisson curve with rate = median count rate of data. |
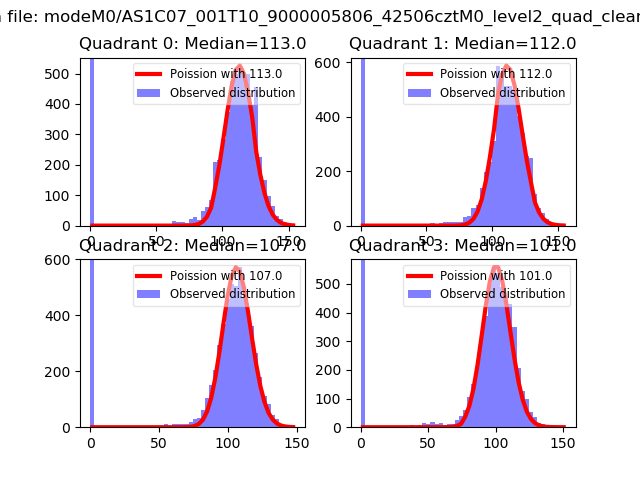 |
 |
| Quadrant-wise count rates Data is divided into 100 sec bins |
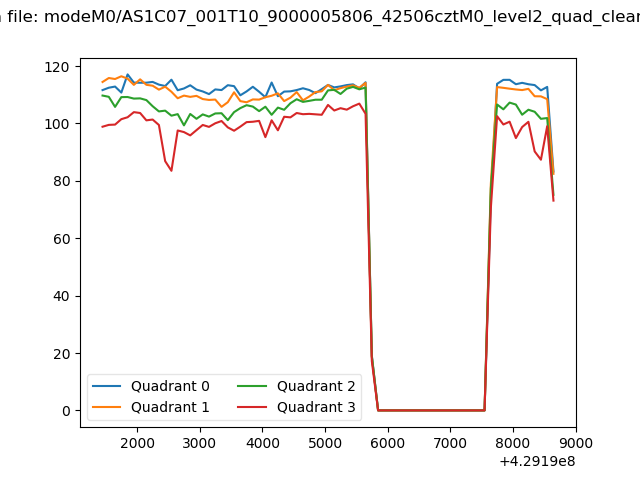 |
|
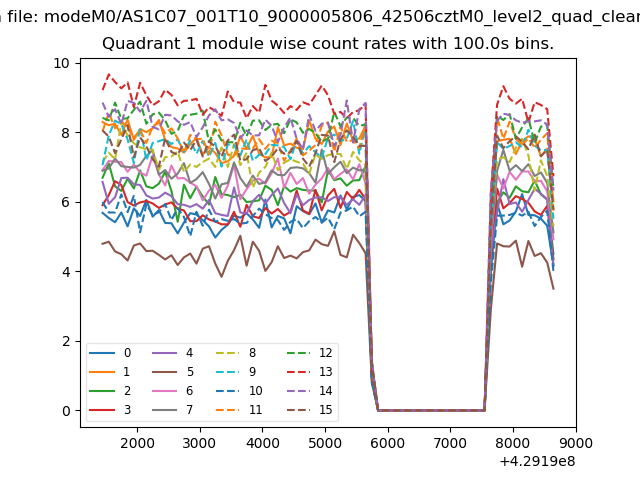
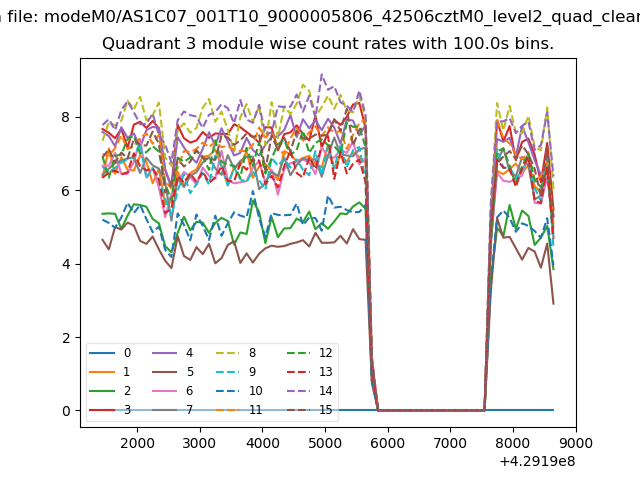
| Module-wise count rates for Quadrant A Data is divided into 100 sec bins |
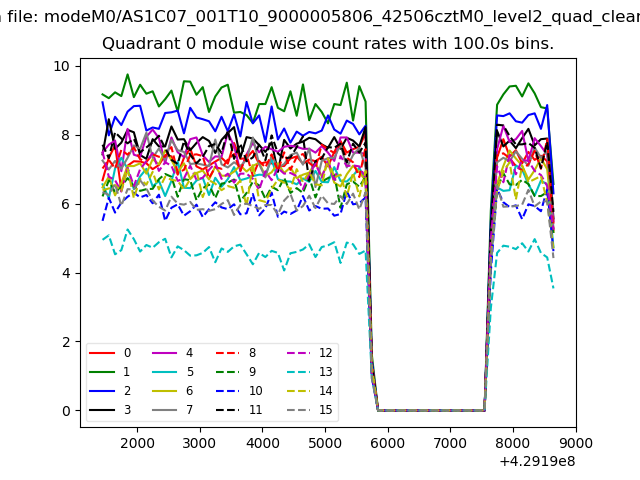 |
 |
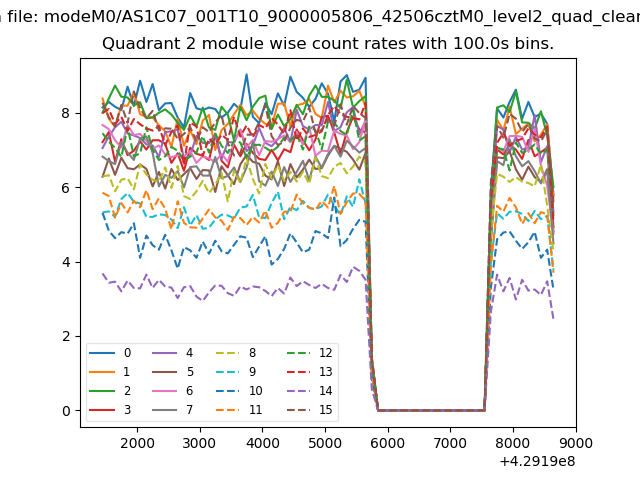
| Module-wise count rates for Quadrant B Data is divided into 100 sec bins |
 |
 |
| Module-wise count rates for Quadrant C Data is divided into 100 sec bins |
 |
 |
| Module-wise count rates for Quadrant D Data is divided into 100 sec bins |
 |
 |
| Parameter | Plot |
|---|---|
| CZT HV Monitor | 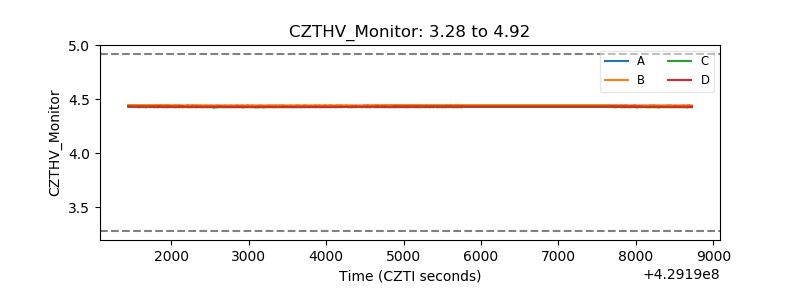 |
| D_VDD | 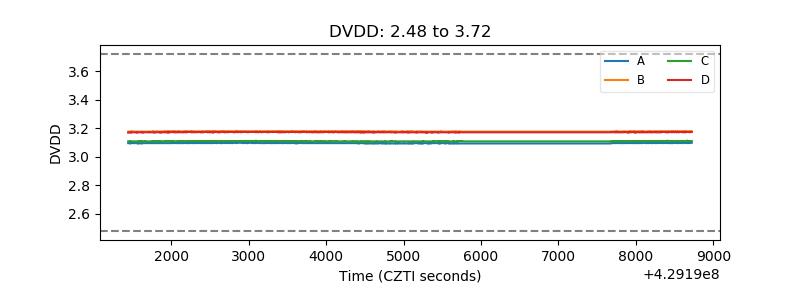 |
| Temperature 1 | 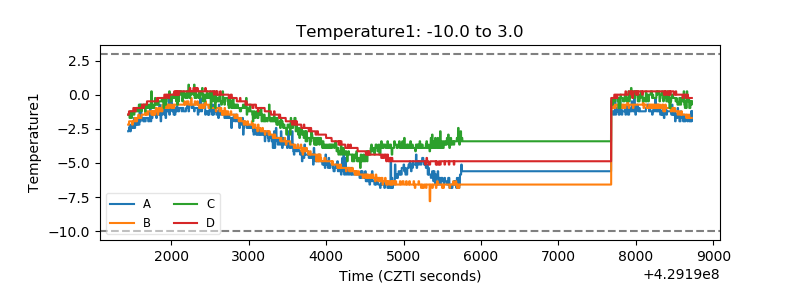 |
| Veto HV Monitor |  |
| Veto LLD | 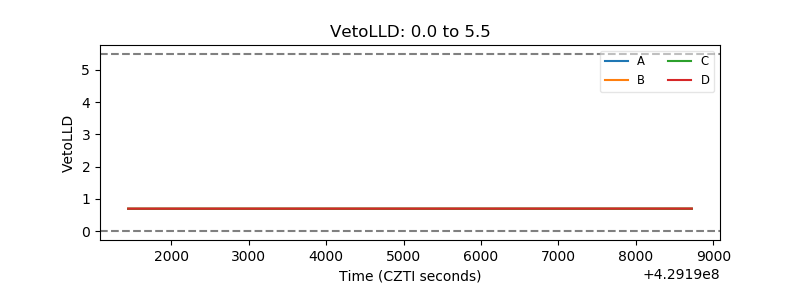 |
| Alpha Counter |  |
| _CPM_Rate |  |
| CZT Counter | 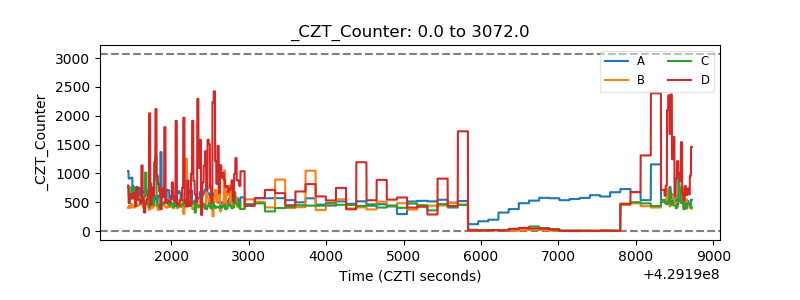 |
| +2.5 Volts monitor | 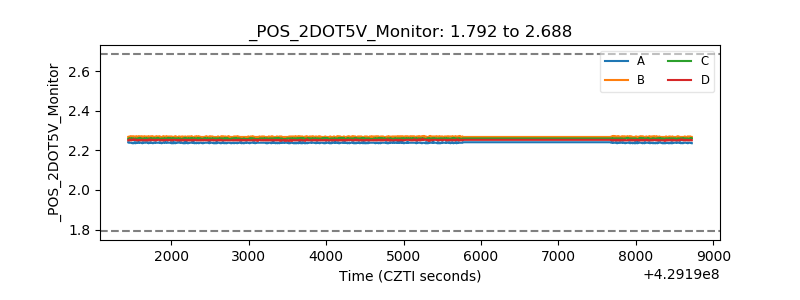 |
| +5 Volts monitor |  |
| _ROLL_ROT | 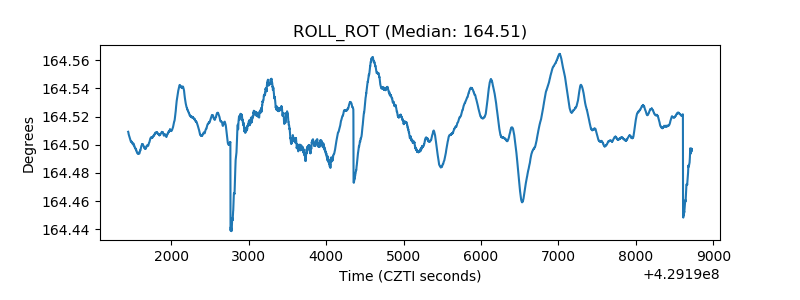 |
| _Roll_DEC | 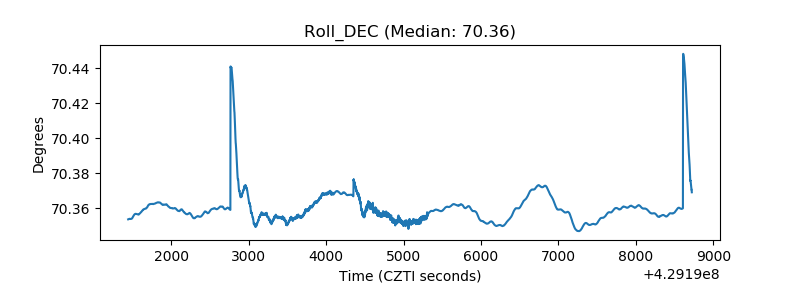 |
| _Roll_RA | 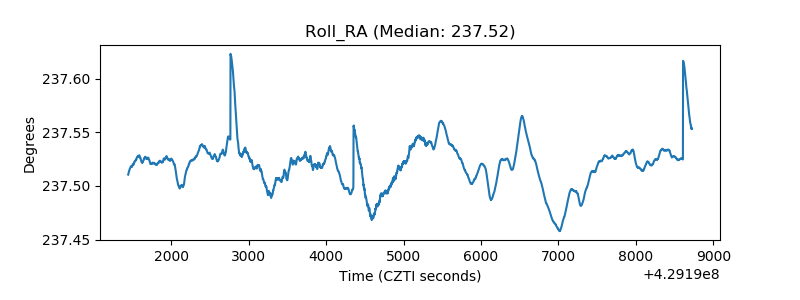 |
| Veto Counter | 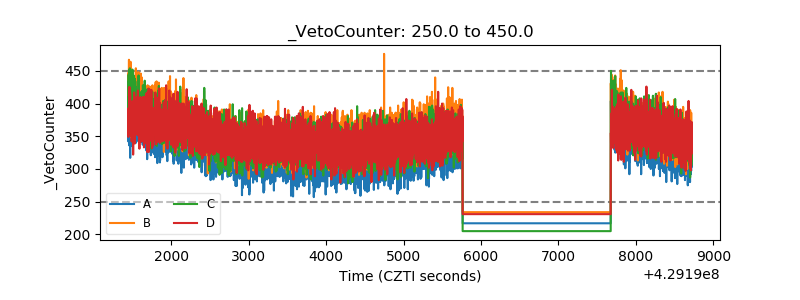 |