| Param | Original file | Final file |
|---|---|---|
| Filename | modeM0/AS1C07_001T10_9000005806_42507cztM0_level2.fits | modeM0/AS1C07_001T10_9000005806_42507cztM0_level2_quad_clean.evt |
| Size (bytes) | 348,065,280 | 90,118,080 |
| Size | 331.9 MB | 85.9 MB |
| Events in quadrant A | 3,020,195 | 612,720 |
| Events in quadrant B | 2,998,833 | 599,692 |
| Events in quadrant C | 2,692,400 | 580,834 |
| Events in quadrant D | 3,741,759 | 548,091 |
| Mode M9 | |||
|---|---|---|---|
| Quadrant | BADHDUFLAG | Total packets | Discarded packets |
| A | 0 | 16 | 0 |
| B | 0 | 17 | 0 |
| C | 0 | 17 | 0 |
| D | 0 | 17 | 0 |
| Mode SS | |||
|---|---|---|---|
| Quadrant | BADHDUFLAG | Total packets | Discarded packets |
| A | 0 | 112 | 0 |
| B | 0 | 112 | 0 |
| C | 0 | 112 | 0 |
| D | 0 | 112 | 0 |
| Mode M0 | |||
|---|---|---|---|
| Quadrant | BADHDUFLAG | Total packets | Discarded packets |
| A | 0 | 12338 | 21 |
| B | 0 | 12897 | 29 |
| C | 0 | 11535 | 21 |
| D | 0 | 15034 | 45 |
| Quadrant | Total seconds | Saturated seconds | Saturation percentage |
|---|---|---|---|
| A | 5538 | 14 | 0.252799% |
| B | 5535 | 75 | 1.355014% |
| C | 5537 | 13 | 0.234784% |
| D | 5535 | 123 | 2.222222% |
Noise dominated data is calculated using 1-second bins in cleaned event files. If a bin has >2000 counts, and if more than 50% of those come from <1% of pixels, then it is considered to be noise-dominated and hence unusable.
| Quadrant | # 1 sec bins | Bins with >0 counts | Bins with >2000 counts | High rate bins dominated by noise | Noise dominated (total time) | Noise dominated (detector-on time) | Marked lightcurve |
|---|---|---|---|---|---|---|---|
| A | 7103 | 5550 | 4 | 4 | 0.06% | 0.07% | 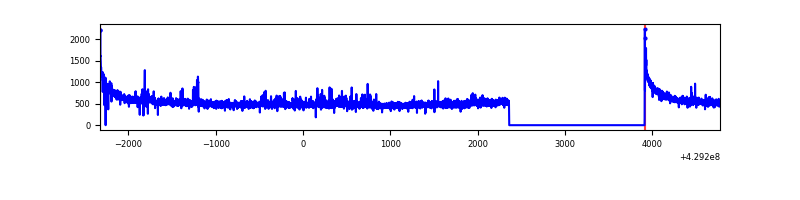 |
| B | 7103 | 5547 | 52 | 52 | 0.73% | 0.94% | 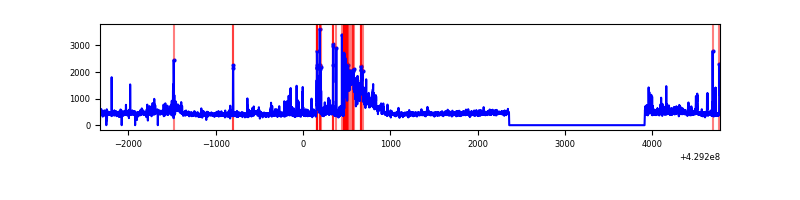 |
| C | 7103 | 5545 | 6 | 6 | 0.08% | 0.11% | 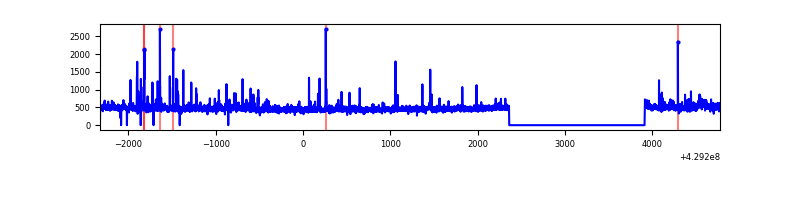 |
| D | 7103 | 5549 | 119 | 119 | 1.68% | 2.14% | 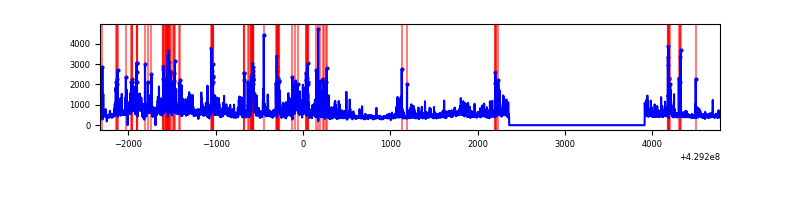 |
Top three noisy pixels from each quadrant. If the there are fewer than three noisy pixels in the level2.evt file, extra rows are filled as -1
| Pixel properties | Quadrant properties | ||||||
|---|---|---|---|---|---|---|---|
| Quadrant | DetID | PixID | Counts | Sigma | Mean | Median | Sigma |
| A | 10 | 83 | 630554 | 5248.28 | 585 | 573 | 120.0 |
| A | 12 | 189 | 89253 | 738.78 | 585 | 573 | 120.0 |
| A | 13 | 6 | 16275 | 130.81 | 585 | 573 | 120.0 |
| B | 0 | 229 | 626066 | 5712.56 | 575 | 561 | 109.5 |
| B | 0 | 245 | 59177 | 535.32 | 575 | 561 | 109.5 |
| B | 4 | 141 | 15072 | 132.52 | 575 | 561 | 109.5 |
| C | 15 | 214 | 247893 | 1877.46 | 568 | 571 | 131.7 |
| C | 9 | 54 | 159714 | 1208.08 | 568 | 571 | 131.7 |
| C | 0 | 239 | 42719 | 319.95 | 568 | 571 | 131.7 |
| D | 12 | 233 | 421830 | 2995.07 | 571 | 555 | 140.7 |
| D | 2 | 249 | 308885 | 2192.09 | 571 | 555 | 140.7 |
| D | 10 | 118 | 301600 | 2140.29 | 571 | 555 | 140.7 |
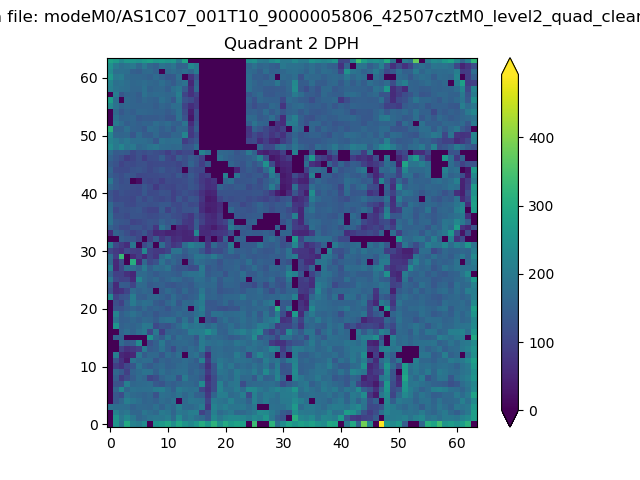
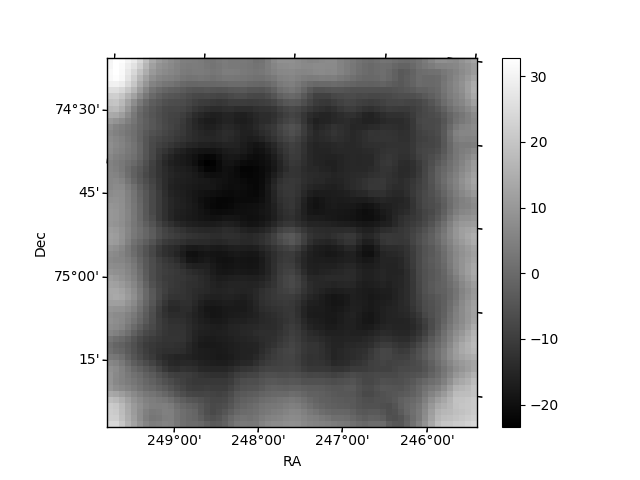
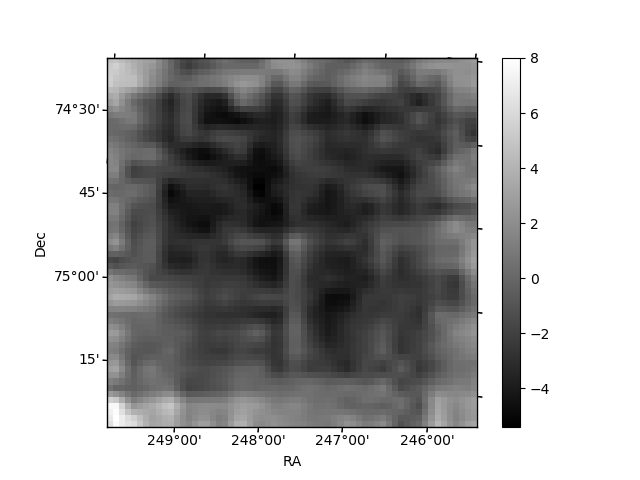
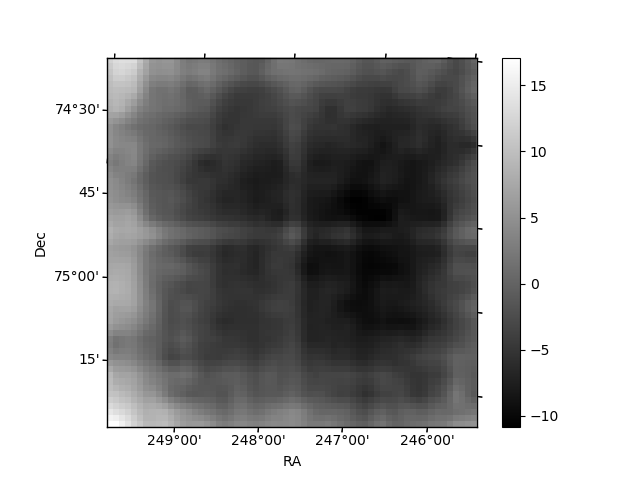
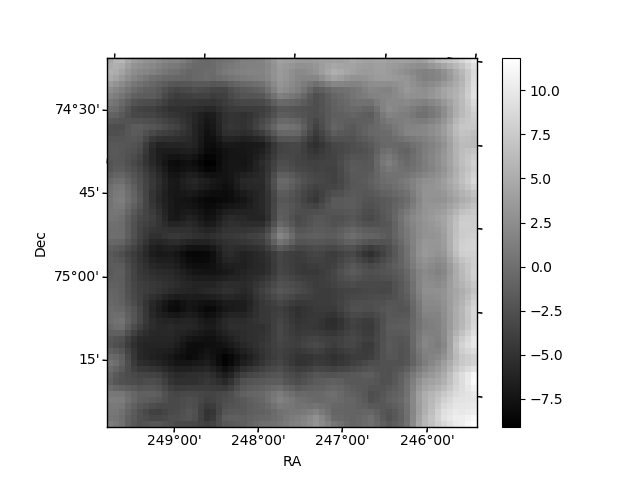
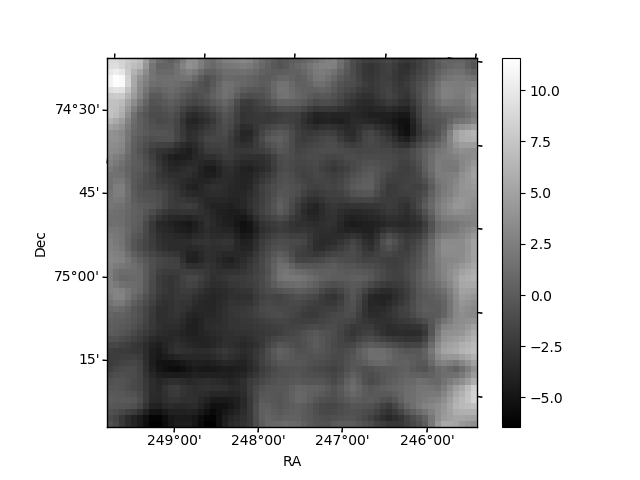
Histogram calculated using DETX and DETY for each event in the final _common_clean file
| Quadrant A | 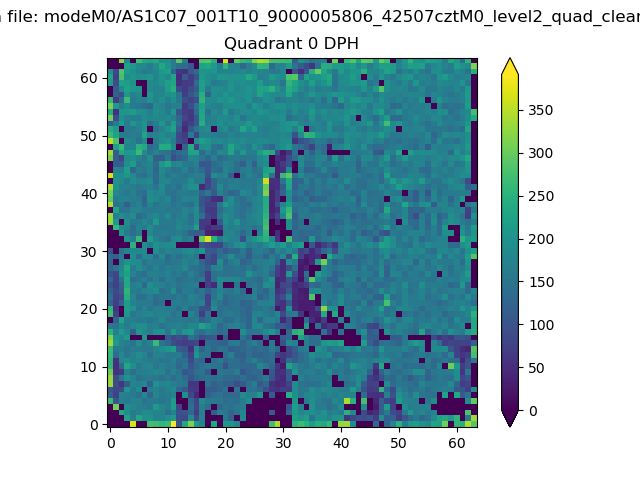 |
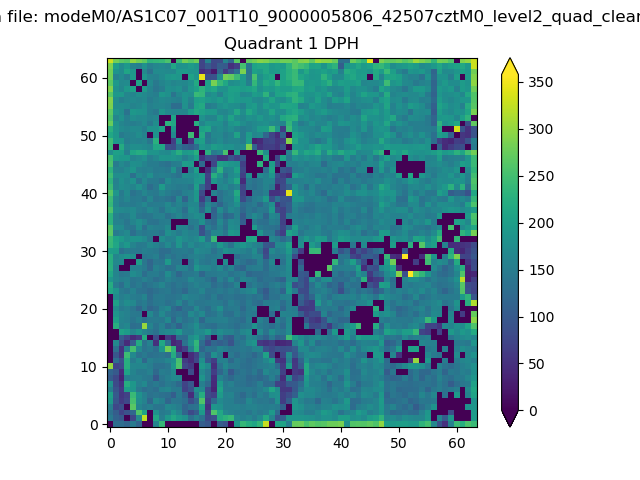 |
Quadrant B |
|---|---|---|---|
| Quadrant D | 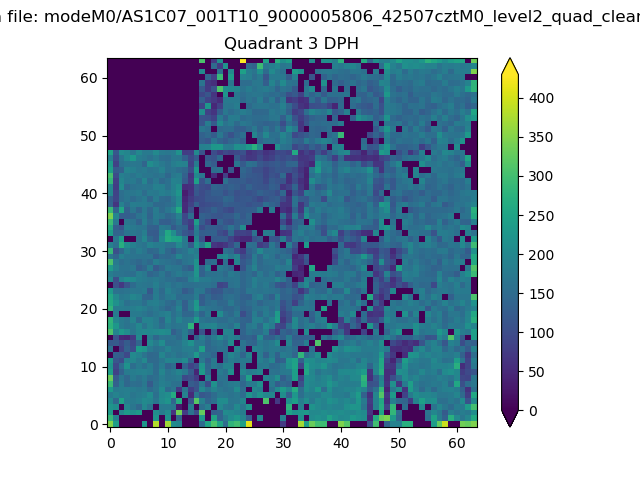 |
 |
Quadrant C |
| Plot type | Count rate plots | Images |
|---|---|---|
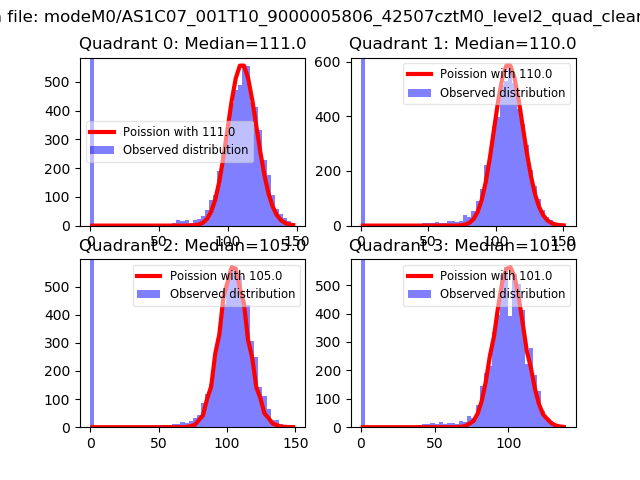
| Comparison with Poisson distribution Blue bars denote a histogram of data divided into 1 sec bins. Red curve is a Poisson curve with rate = median count rate of data. |
 |
 |
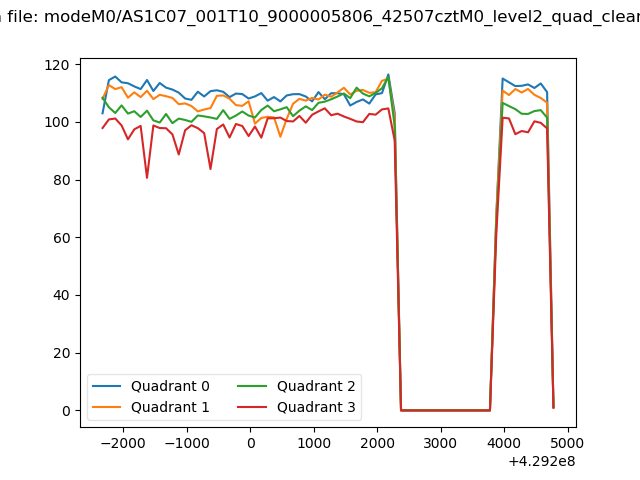
| Quadrant-wise count rates Data is divided into 100 sec bins |
 |
|
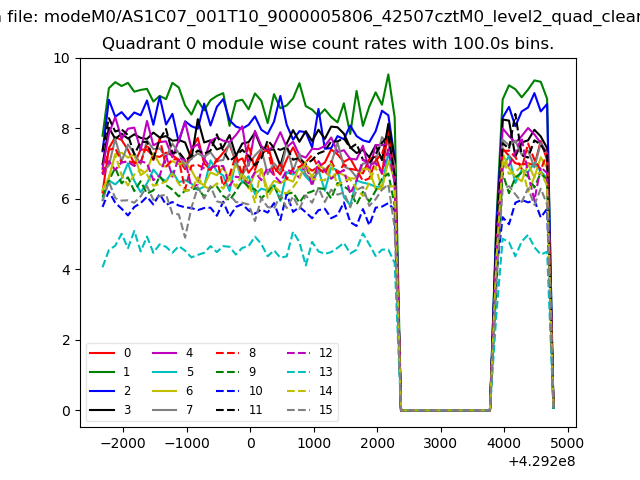
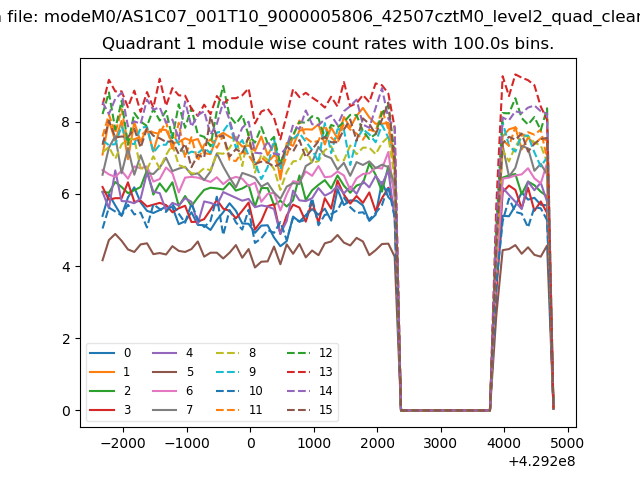
| Module-wise count rates for Quadrant A Data is divided into 100 sec bins |
 |
 |
| Module-wise count rates for Quadrant B Data is divided into 100 sec bins |
 |
 |
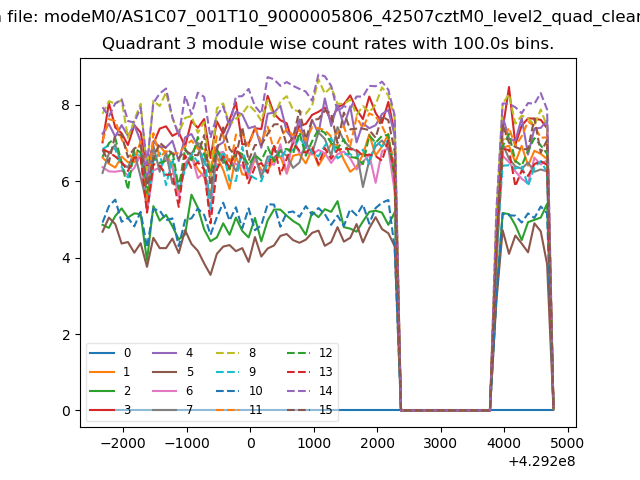
| Module-wise count rates for Quadrant C Data is divided into 100 sec bins |
 |
 |
| Module-wise count rates for Quadrant D Data is divided into 100 sec bins |
 |
 |
| Parameter | Plot |
|---|---|
| CZT HV Monitor | 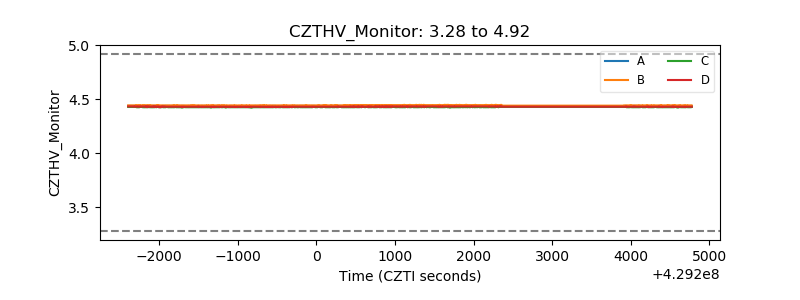 |
| D_VDD | 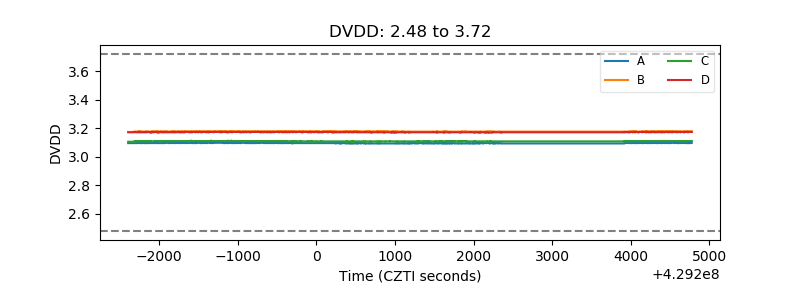 |
| Temperature 1 | 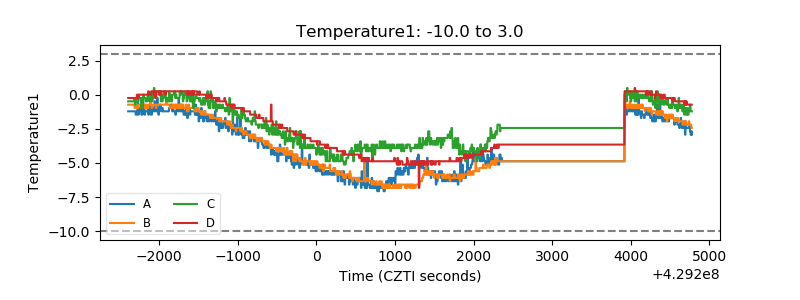 |
| Veto HV Monitor |  |
| Veto LLD | 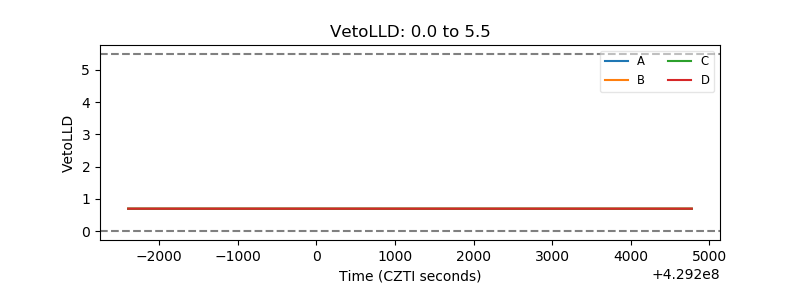 |
| Alpha Counter |  |
| _CPM_Rate |  |
| CZT Counter | 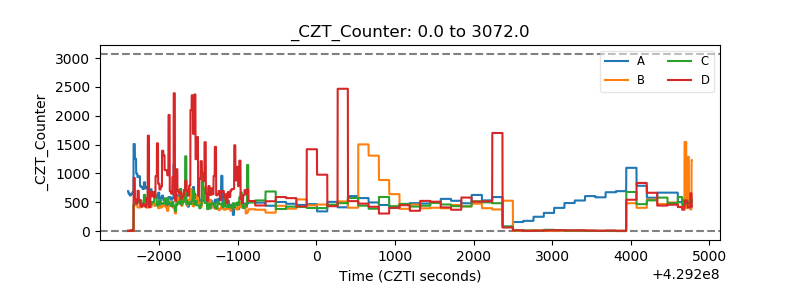 |
| +2.5 Volts monitor | 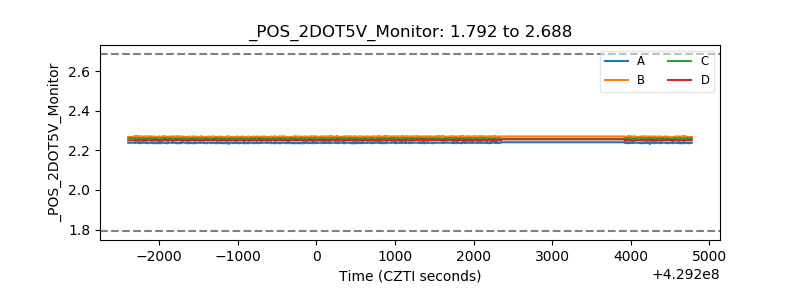 |
| +5 Volts monitor |  |
| _ROLL_ROT | 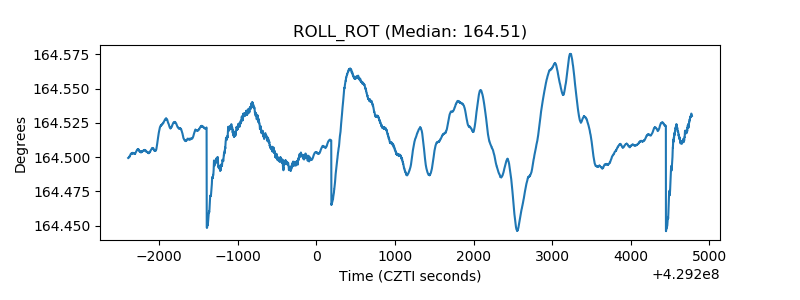 |
| _Roll_DEC | 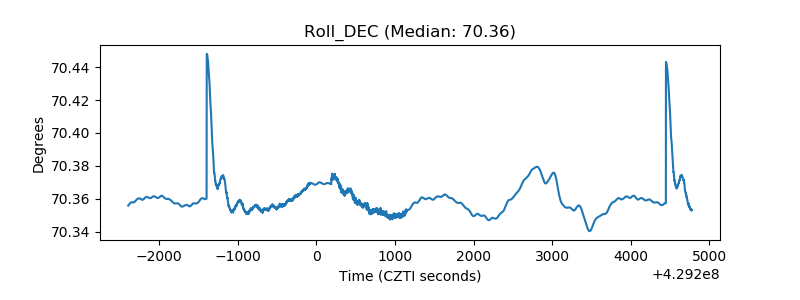 |
| _Roll_RA | 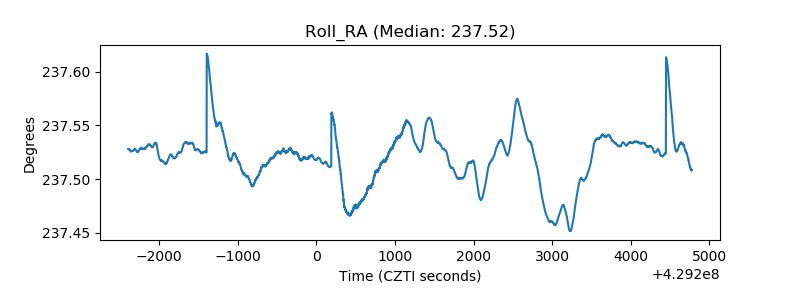 |
| Veto Counter |  |