| Param | Original file | Final file |
|---|---|---|
| Filename | modeM0/AS1C07_001T10_9000005806_42508cztM0_level2.fits | modeM0/AS1C07_001T10_9000005806_42508cztM0_level2_quad_clean.evt |
| Size (bytes) | 400,711,680 | 90,907,200 |
| Size | 382.1 MB | 86.7 MB |
| Events in quadrant A | 3,087,665 | 625,534 |
| Events in quadrant B | 3,052,567 | 618,929 |
| Events in quadrant C | 5,002,297 | 550,211 |
| Events in quadrant D | 3,241,805 | 554,328 |
| Mode M9 | |||
|---|---|---|---|
| Quadrant | BADHDUFLAG | Total packets | Discarded packets |
| A | 0 | 16 | 0 |
| B | 0 | 17 | 0 |
| C | 0 | 17 | 0 |
| D | 0 | 17 | 0 |
| Mode SS | |||
|---|---|---|---|
| Quadrant | BADHDUFLAG | Total packets | Discarded packets |
| A | 0 | 118 | 0 |
| B | 0 | 118 | 0 |
| C | 0 | 118 | 0 |
| D | 0 | 118 | 0 |
| Mode M0 | |||
|---|---|---|---|
| Quadrant | BADHDUFLAG | Total packets | Discarded packets |
| A | 0 | 12681 | 2 |
| B | 0 | 13081 | 5 |
| C | 0 | 18721 | 2 |
| D | 0 | 13666 | 2 |
| Quadrant | Total seconds | Saturated seconds | Saturation percentage |
|---|---|---|---|
| A | 5770 | 11 | 0.190641% |
| B | 5768 | 42 | 0.728155% |
| C | 5770 | 569 | 9.861352% |
| D | 5770 | 166 | 2.876950% |
Noise dominated data is calculated using 1-second bins in cleaned event files. If a bin has >2000 counts, and if more than 50% of those come from <1% of pixels, then it is considered to be noise-dominated and hence unusable.
| Quadrant | # 1 sec bins | Bins with >0 counts | Bins with >2000 counts | High rate bins dominated by noise | Noise dominated (total time) | Noise dominated (detector-on time) | Marked lightcurve |
|---|---|---|---|---|---|---|---|
| A | 7112 | 5771 | 4 | 4 | 0.06% | 0.07% | 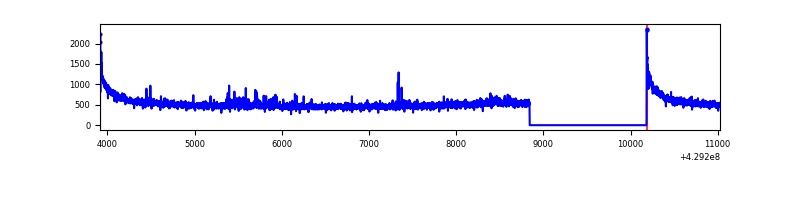 |
| B | 7112 | 5770 | 34 | 34 | 0.48% | 0.59% | 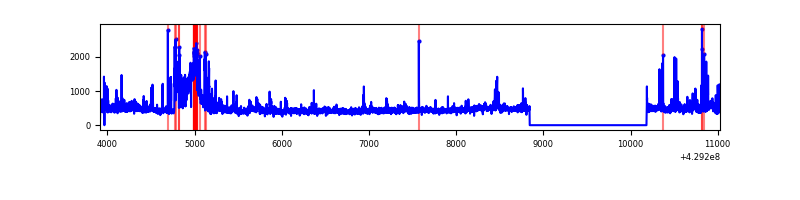 |
| C | 7112 | 5771 | 537 | 537 | 7.55% | 9.31% | 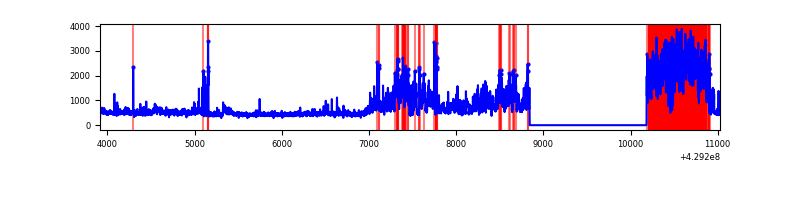 |
| D | 7112 | 5771 | 132 | 132 | 1.86% | 2.29% | 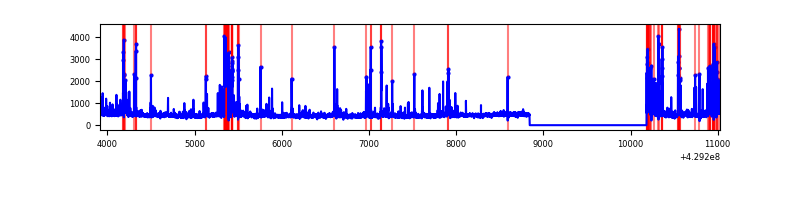 |
Top three noisy pixels from each quadrant. If the there are fewer than three noisy pixels in the level2.evt file, extra rows are filled as -1
| Pixel properties | Quadrant properties | ||||||
|---|---|---|---|---|---|---|---|
| Quadrant | DetID | PixID | Counts | Sigma | Mean | Median | Sigma |
| A | 10 | 83 | 646892 | 5127.0 | 610 | 597 | 126.1 |
| A | 12 | 189 | 60226 | 473.03 | 610 | 597 | 126.1 |
| A | 13 | 6 | 12748 | 96.39 | 610 | 597 | 126.1 |
| B | 0 | 229 | 569117 | 4917.84 | 600 | 582 | 115.6 |
| B | 0 | 245 | 58234 | 498.69 | 600 | 582 | 115.6 |
| B | 5 | 255 | 29476 | 249.93 | 600 | 582 | 115.6 |
| C | 0 | 239 | 2287867 | 17405.04 | 572 | 576 | 131.4 |
| C | 15 | 214 | 250181 | 1899.36 | 572 | 576 | 131.4 |
| C | 9 | 54 | 195374 | 1482.31 | 572 | 576 | 131.4 |
| D | 12 | 233 | 272868 | 1888.92 | 591 | 576 | 144.2 |
| D | 10 | 118 | 257366 | 1781.38 | 591 | 576 | 144.2 |
| D | 13 | 249 | 124107 | 856.95 | 591 | 576 | 144.2 |
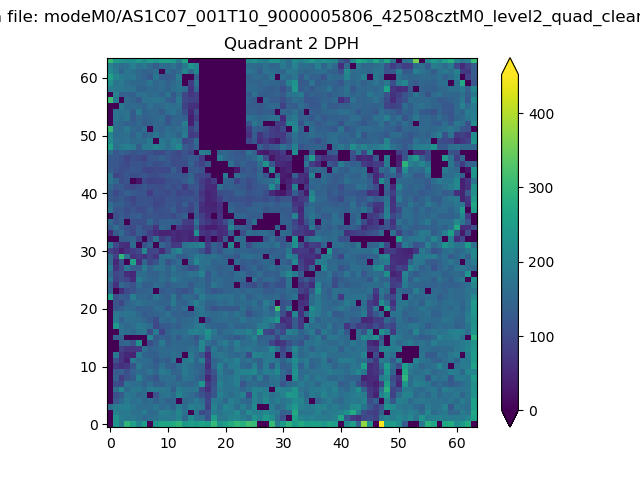
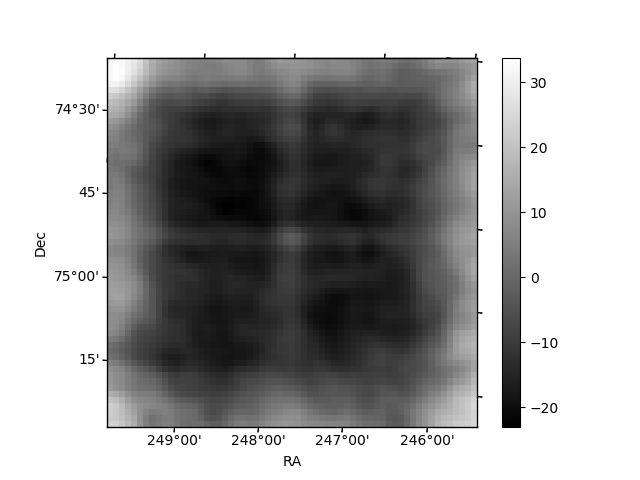
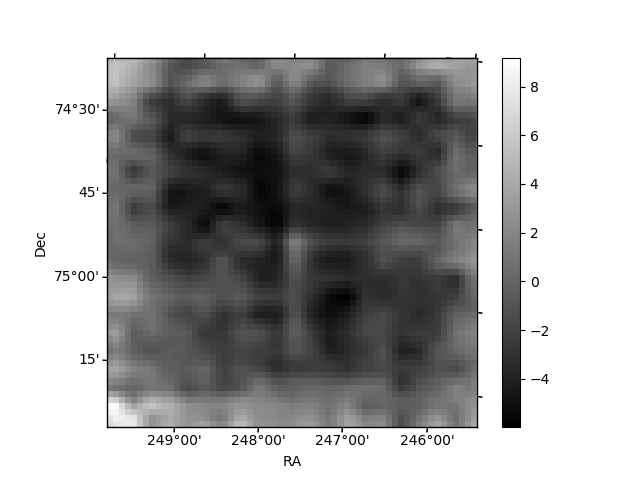
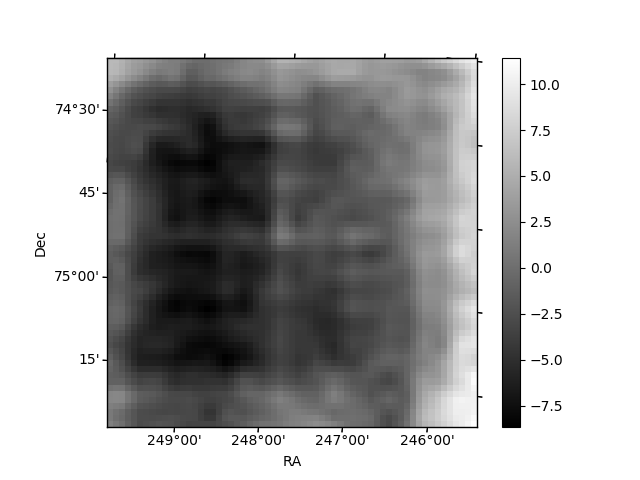
Histogram calculated using DETX and DETY for each event in the final _common_clean file
| Quadrant A | 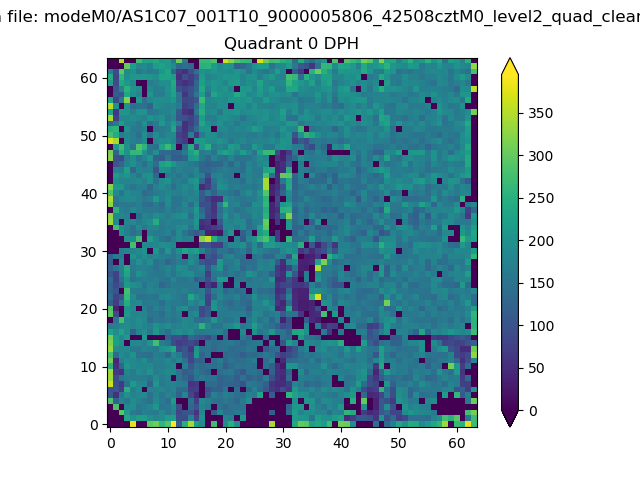 |
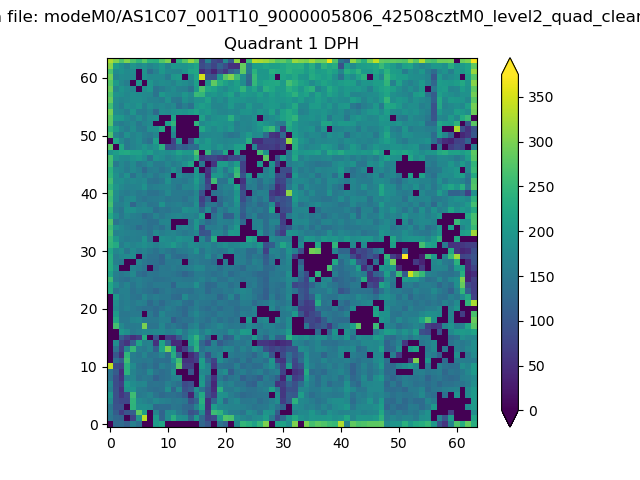 |
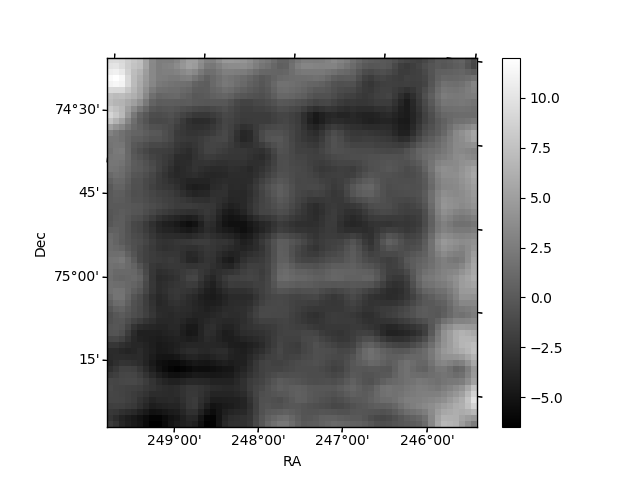
Quadrant B |
|---|---|---|---|
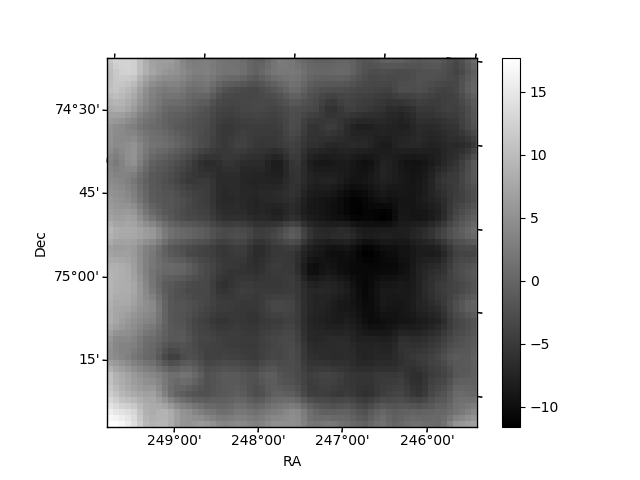
| Quadrant D | 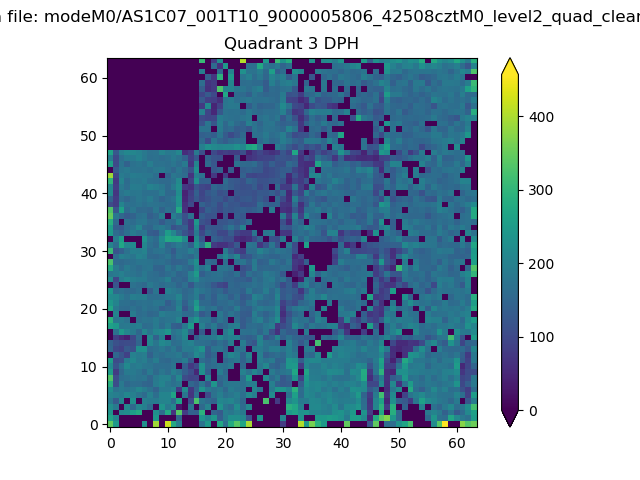 |
 |
Quadrant C |
| Plot type | Count rate plots | Images |
|---|---|---|
| Comparison with Poisson distribution Blue bars denote a histogram of data divided into 1 sec bins. Red curve is a Poisson curve with rate = median count rate of data. |
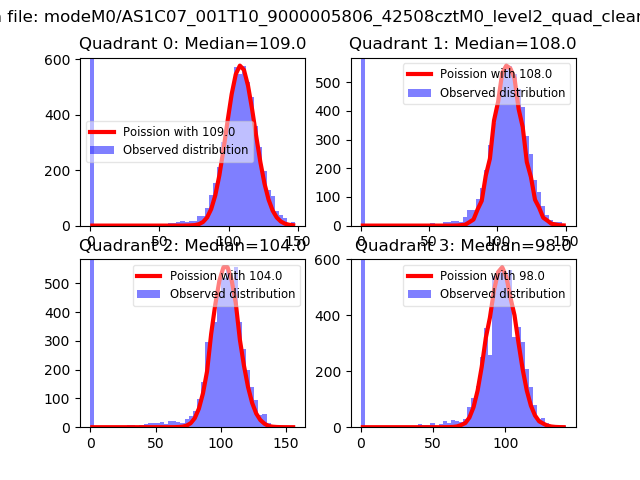 |
 |
| Quadrant-wise count rates Data is divided into 100 sec bins |
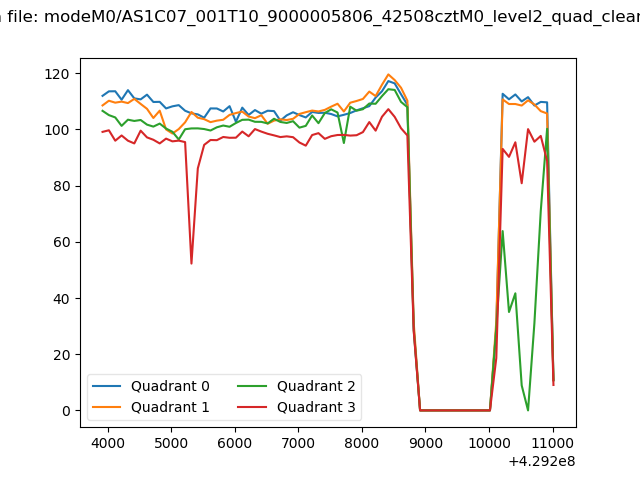 |
|
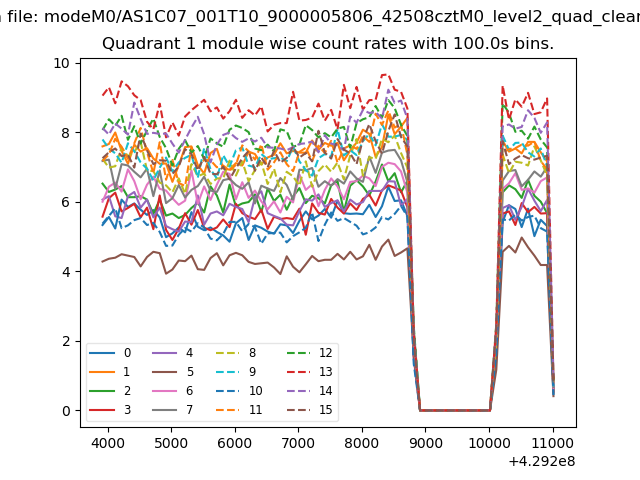
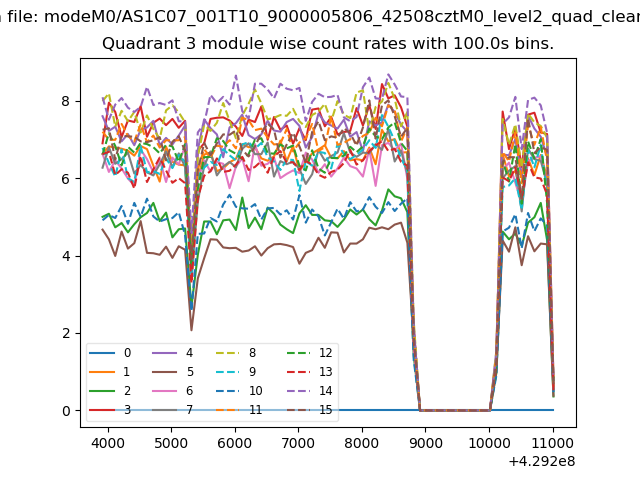
| Module-wise count rates for Quadrant A Data is divided into 100 sec bins |
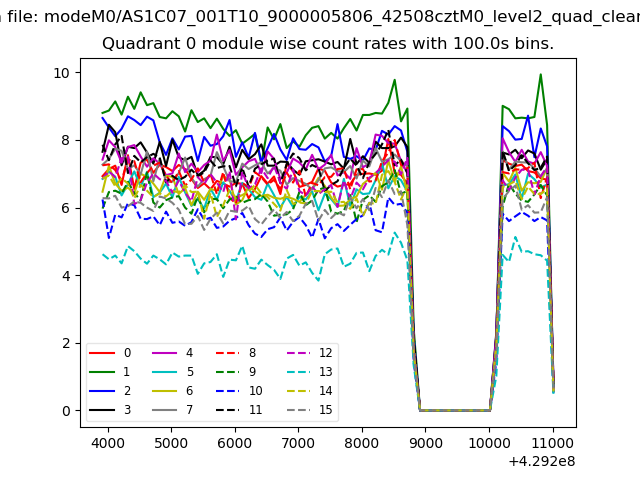 |
 |
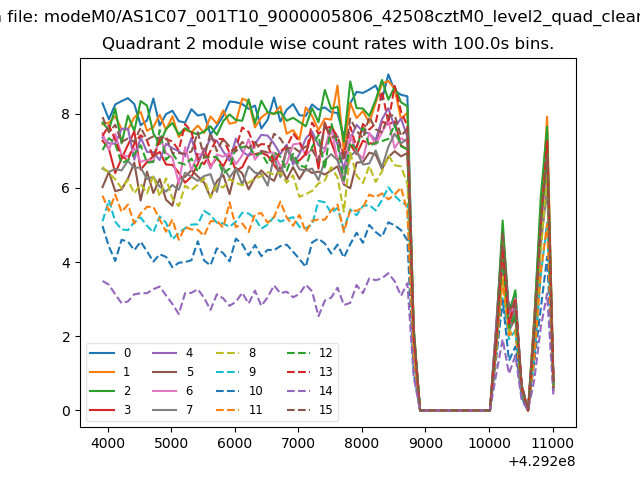
| Module-wise count rates for Quadrant B Data is divided into 100 sec bins |
 |
 |
| Module-wise count rates for Quadrant C Data is divided into 100 sec bins |
 |
 |
| Module-wise count rates for Quadrant D Data is divided into 100 sec bins |
 |
 |
| Parameter | Plot |
|---|---|
| CZT HV Monitor |  |
| D_VDD | 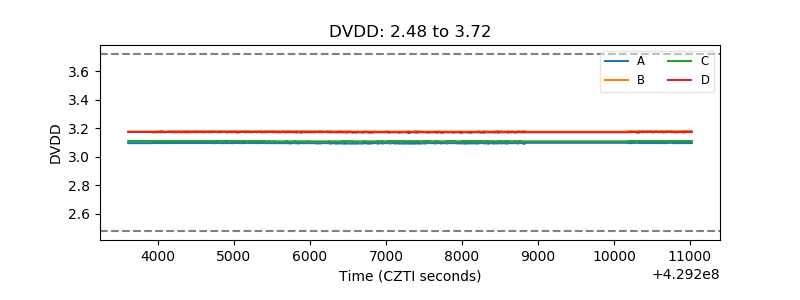 |
| Temperature 1 | 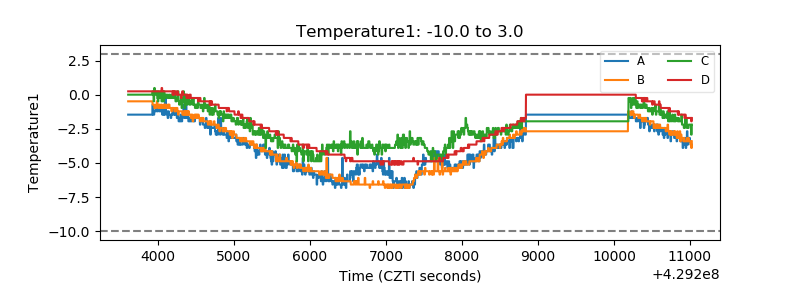 |
| Veto HV Monitor | 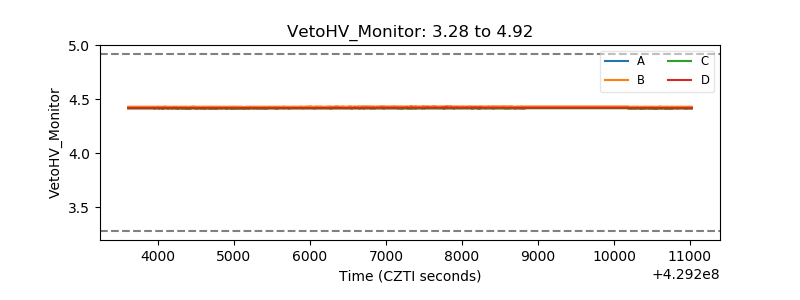 |
| Veto LLD | 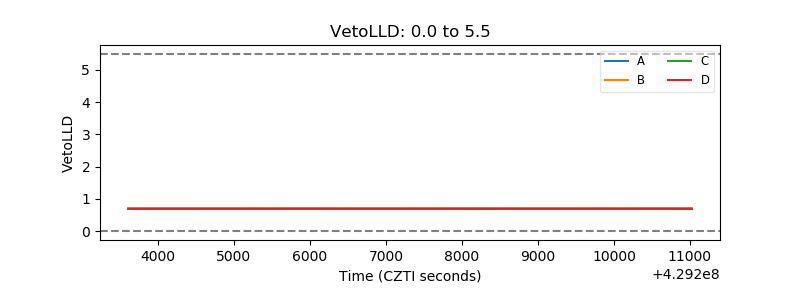 |
| Alpha Counter |  |
| _CPM_Rate |  |
| CZT Counter | 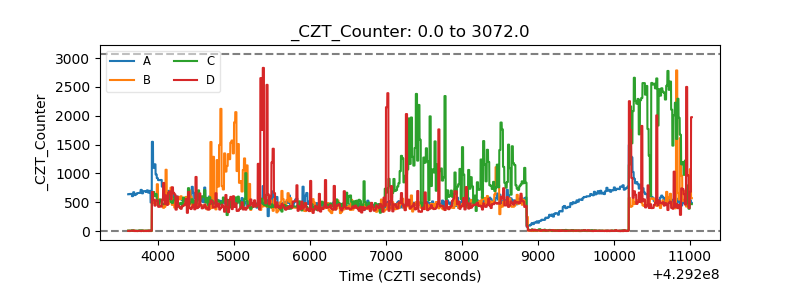 |
| +2.5 Volts monitor | 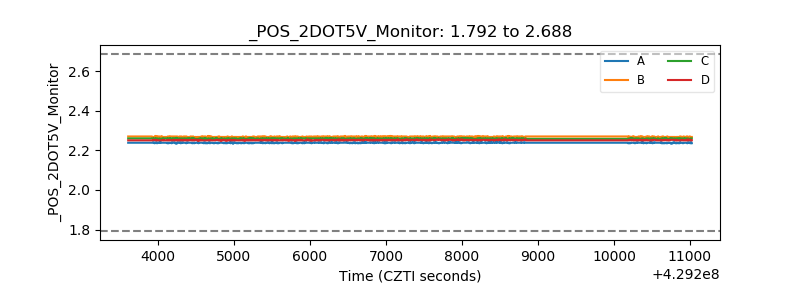 |
| +5 Volts monitor |  |
| _ROLL_ROT | 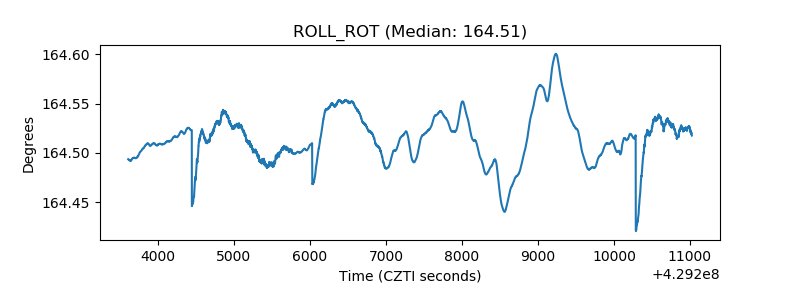 |
| _Roll_DEC | 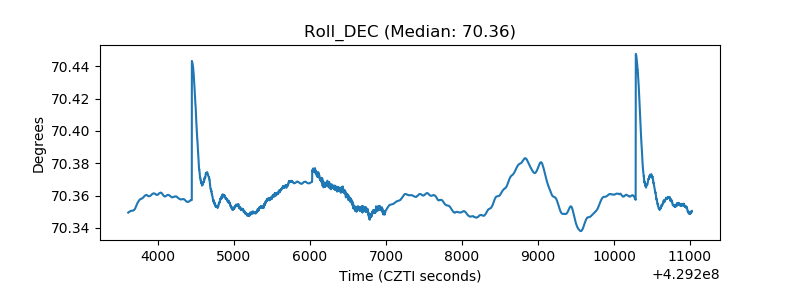 |
| _Roll_RA | 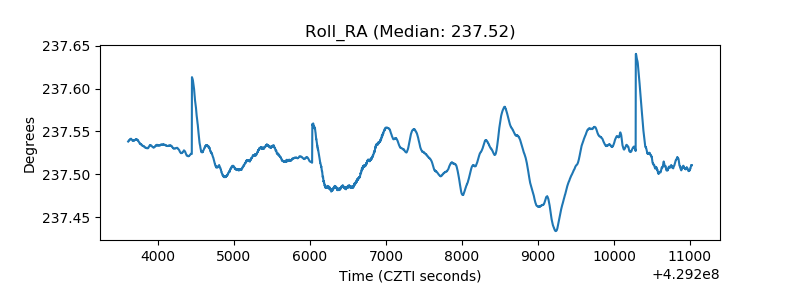 |
| Veto Counter | 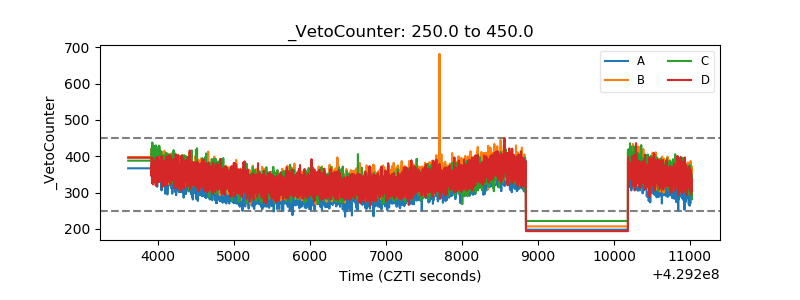 |