| Param | Original file | Final file |
|---|---|---|
| Filename | modeM0/AS1C07_001T10_9000005806_42509cztM0_level2.fits | modeM0/AS1C07_001T10_9000005806_42509cztM0_level2_quad_clean.evt |
| Size (bytes) | 482,163,840 | 90,547,200 |
| Size | 459.8 MB | 86.4 MB |
| Events in quadrant A | 3,139,046 | 639,552 |
| Events in quadrant B | 2,861,145 | 633,344 |
| Events in quadrant C | 7,825,989 | 486,841 |
| Events in quadrant D | 3,562,346 | 567,894 |
| Mode M9 | |||
|---|---|---|---|
| Quadrant | BADHDUFLAG | Total packets | Discarded packets |
| A | 0 | 20 | 0 |
| B | 0 | 21 | 0 |
| C | 0 | 21 | 0 |
| D | 0 | 21 | 0 |
| Mode SS | |||
|---|---|---|---|
| Quadrant | BADHDUFLAG | Total packets | Discarded packets |
| A | 0 | 122 | 0 |
| B | 0 | 122 | 0 |
| C | 0 | 122 | 0 |
| D | 0 | 122 | 0 |
| Mode M0 | |||
|---|---|---|---|
| Quadrant | BADHDUFLAG | Total packets | Discarded packets |
| A | 0 | 12947 | 2 |
| B | 0 | 12689 | 2 |
| C | 0 | 27280 | 7 |
| D | 0 | 14901 | 2 |
| Quadrant | Total seconds | Saturated seconds | Saturation percentage |
|---|---|---|---|
| A | 5915 | 12 | 0.202874% |
| B | 5915 | 19 | 0.321217% |
| C | 5914 | 1421 | 24.027731% |
| D | 5914 | 201 | 3.398715% |
Noise dominated data is calculated using 1-second bins in cleaned event files. If a bin has >2000 counts, and if more than 50% of those come from <1% of pixels, then it is considered to be noise-dominated and hence unusable.
| Quadrant | # 1 sec bins | Bins with >0 counts | Bins with >2000 counts | High rate bins dominated by noise | Noise dominated (total time) | Noise dominated (detector-on time) | Marked lightcurve |
|---|---|---|---|---|---|---|---|
| A | 7228 | 5916 | 4 | 4 | 0.06% | 0.07% | 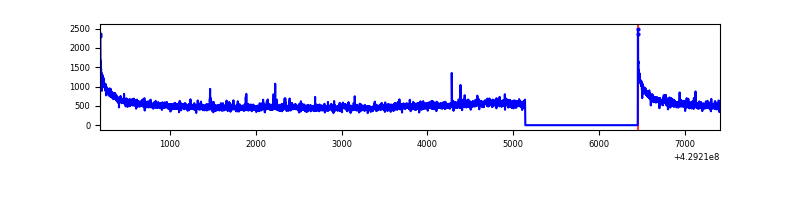 |
| B | 7228 | 5916 | 12 | 12 | 0.17% | 0.20% | 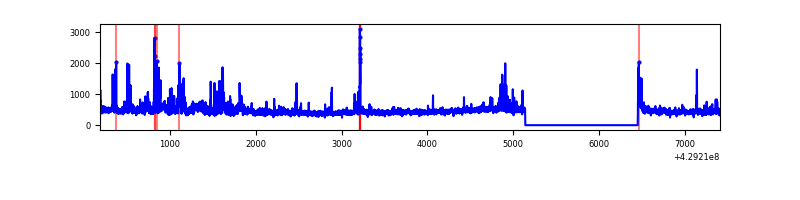 |
| C | 7227 | 5914 | 1414 | 1414 | 19.57% | 23.91% | 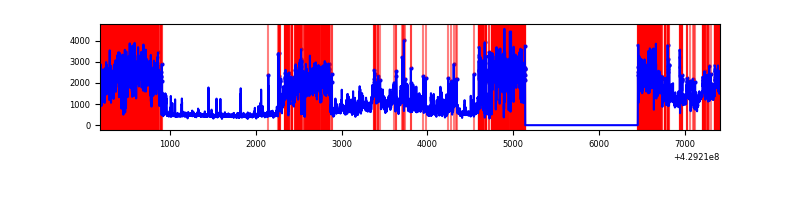 |
| D | 7227 | 5915 | 158 | 158 | 2.19% | 2.67% | 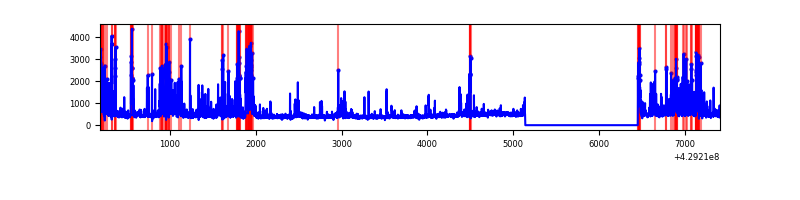 |
Top three noisy pixels from each quadrant. If the there are fewer than three noisy pixels in the level2.evt file, extra rows are filled as -1
| Pixel properties | Quadrant properties | ||||||
|---|---|---|---|---|---|---|---|
| Quadrant | DetID | PixID | Counts | Sigma | Mean | Median | Sigma |
| A | 10 | 83 | 646603 | 4987.24 | 623 | 609 | 129.5 |
| A | 12 | 189 | 49477 | 377.27 | 623 | 609 | 129.5 |
| A | 13 | 6 | 10820 | 78.83 | 623 | 609 | 129.5 |
| B | 0 | 229 | 245785 | 2056.98 | 614 | 597 | 119.2 |
| B | 5 | 255 | 71908 | 598.26 | 614 | 597 | 119.2 |
| B | 0 | 245 | 61628 | 512.01 | 614 | 597 | 119.2 |
| C | 0 | 239 | 5008399 | 38772.11 | 554 | 556 | 129.2 |
| C | 9 | 54 | 398387 | 3080.12 | 554 | 556 | 129.2 |
| C | 15 | 214 | 241658 | 1866.68 | 554 | 556 | 129.2 |
| D | 12 | 233 | 463480 | 3136.78 | 605 | 588 | 147.6 |
| D | 10 | 118 | 230247 | 1556.28 | 605 | 588 | 147.6 |
| D | 13 | 249 | 226543 | 1531.18 | 605 | 588 | 147.6 |
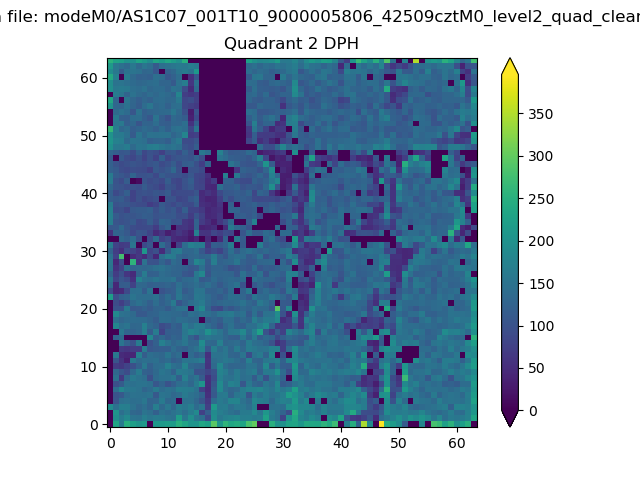
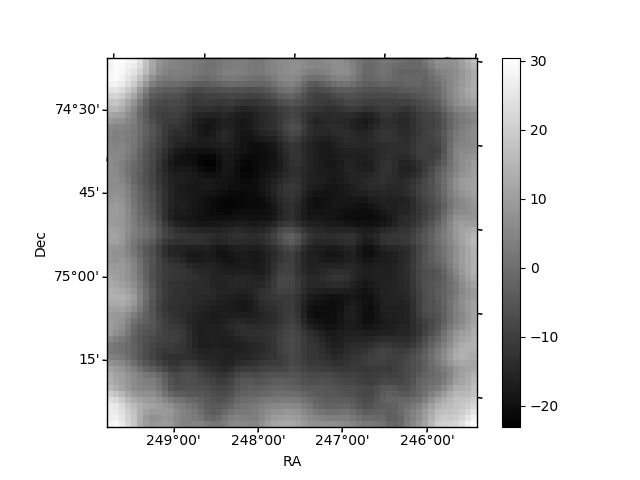
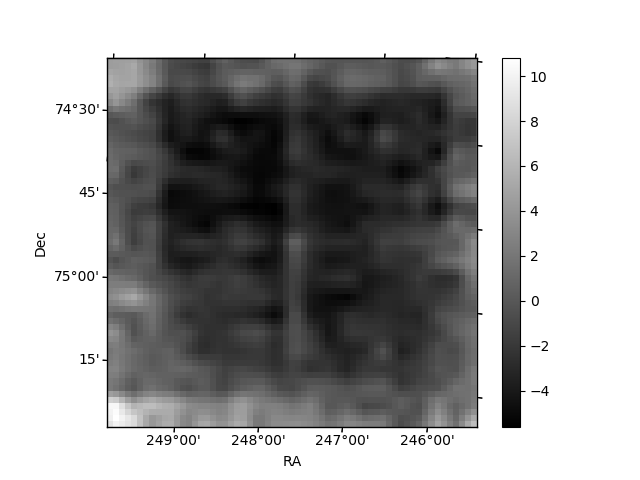
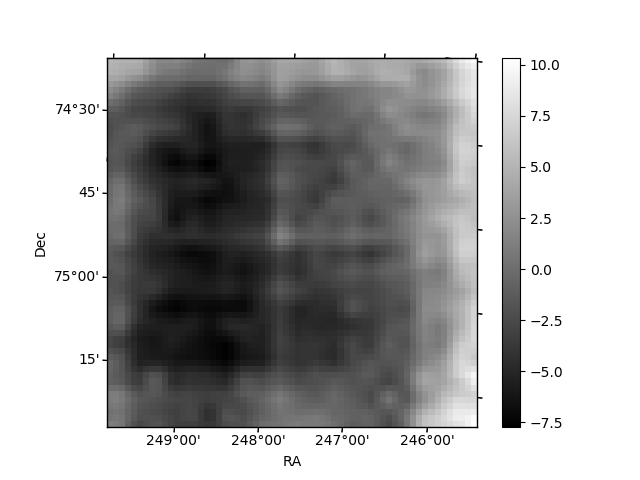
Histogram calculated using DETX and DETY for each event in the final _common_clean file
| Quadrant A | 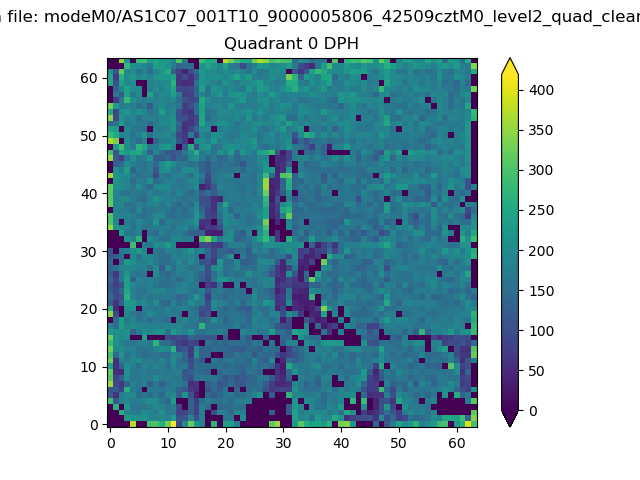 |
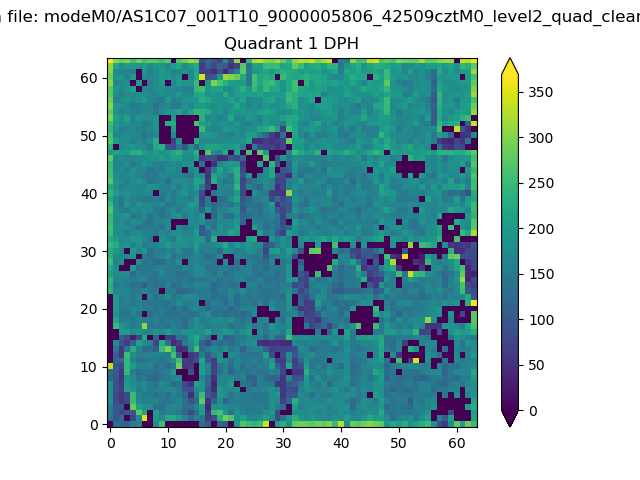 |
Quadrant B |
|---|---|---|---|
| Quadrant D | 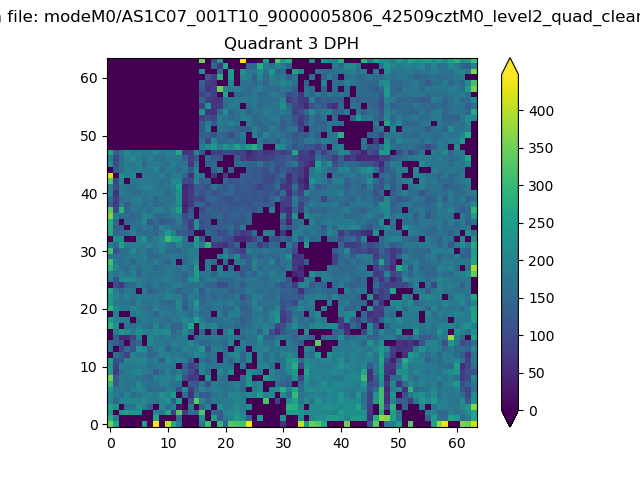 |
 |
Quadrant C |
| Plot type | Count rate plots | Images |
|---|---|---|
| Comparison with Poisson distribution Blue bars denote a histogram of data divided into 1 sec bins. Red curve is a Poisson curve with rate = median count rate of data. |
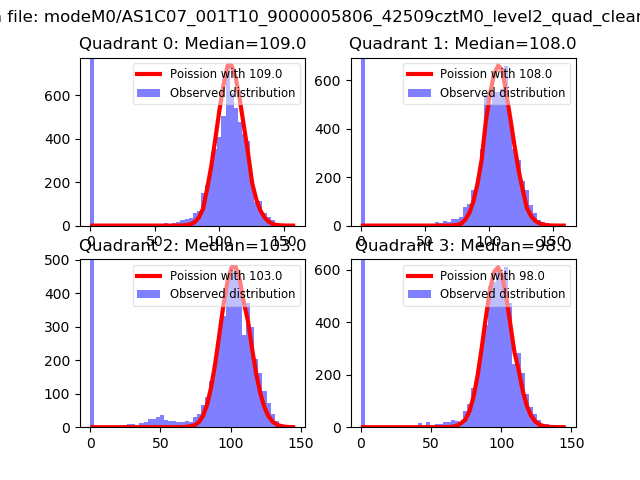 |
 |
| Quadrant-wise count rates Data is divided into 100 sec bins |
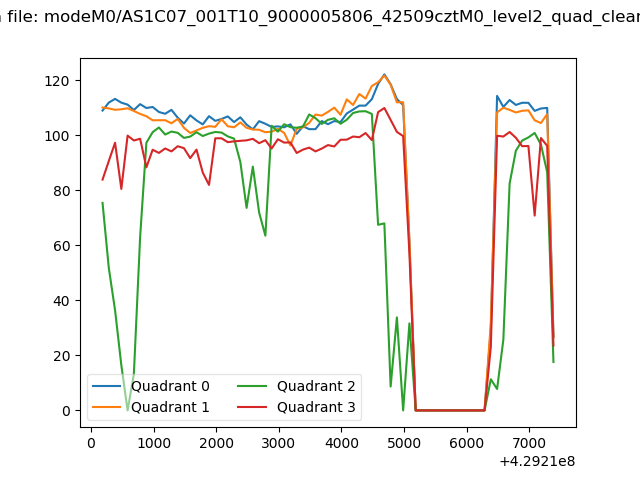 |
|
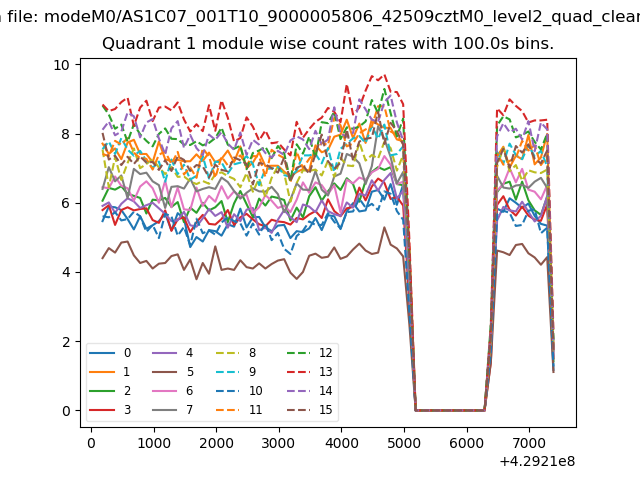
| Module-wise count rates for Quadrant A Data is divided into 100 sec bins |
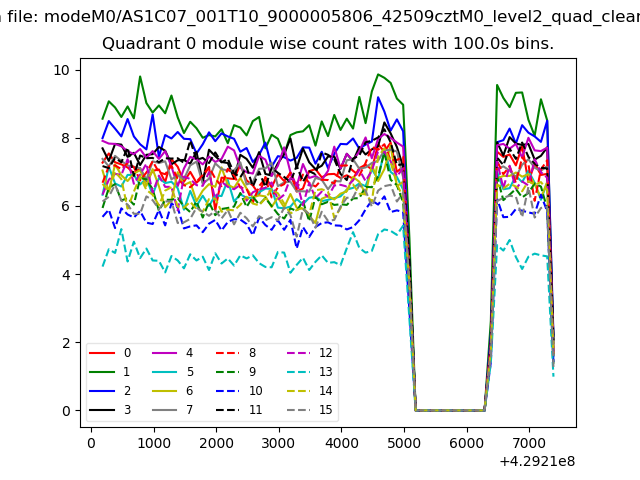 |
 |
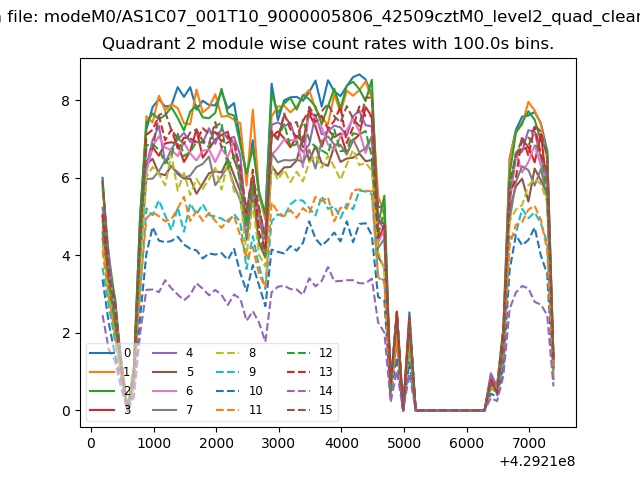
| Module-wise count rates for Quadrant B Data is divided into 100 sec bins |
 |
 |
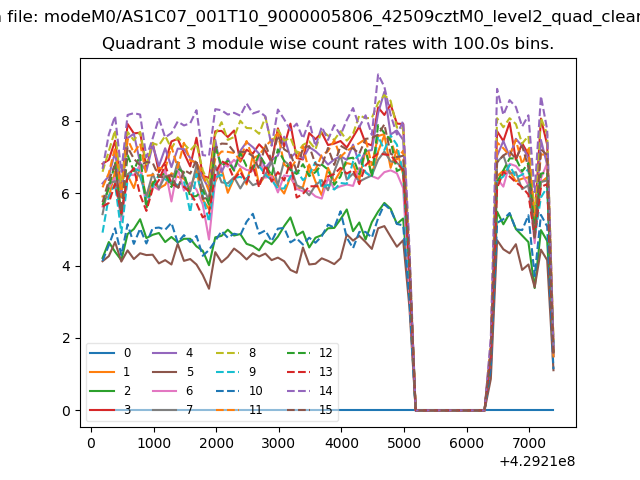
| Module-wise count rates for Quadrant C Data is divided into 100 sec bins |
 |
 |
| Module-wise count rates for Quadrant D Data is divided into 100 sec bins |
 |
 |
| Parameter | Plot |
|---|---|
| CZT HV Monitor | 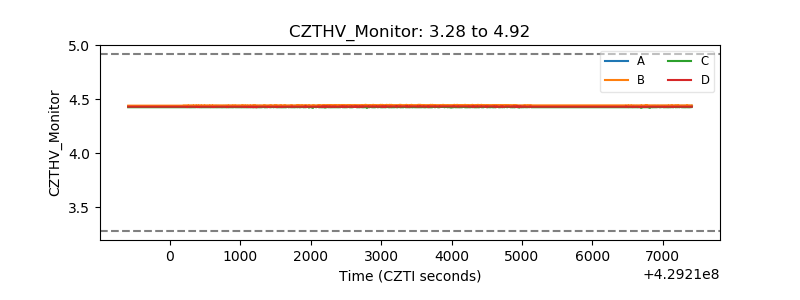 |
| D_VDD | 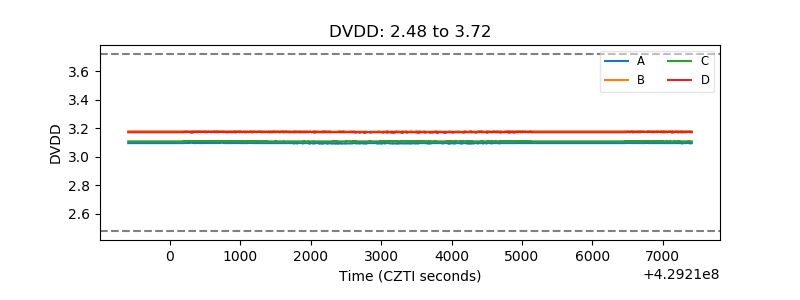 |
| Temperature 1 | 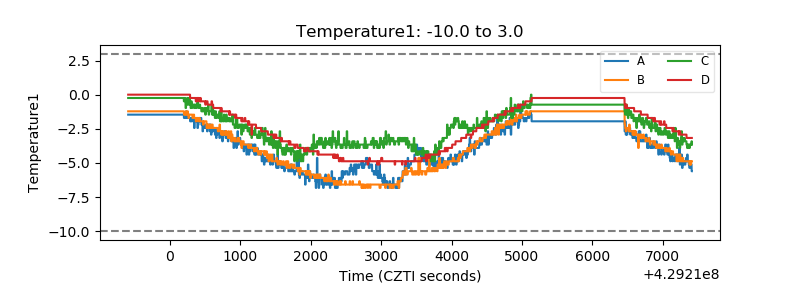 |
| Veto HV Monitor | 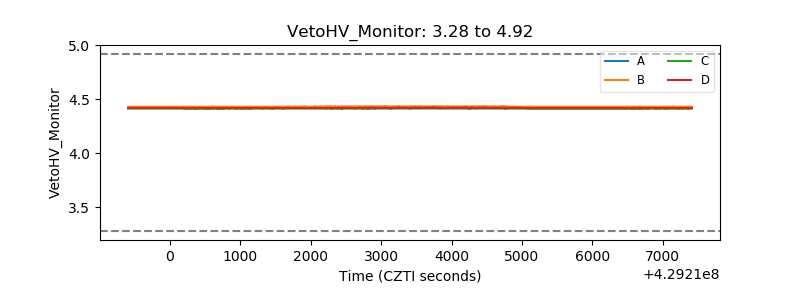 |
| Veto LLD | 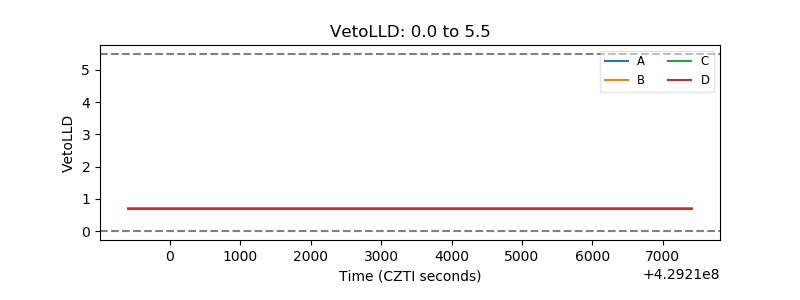 |
| Alpha Counter | 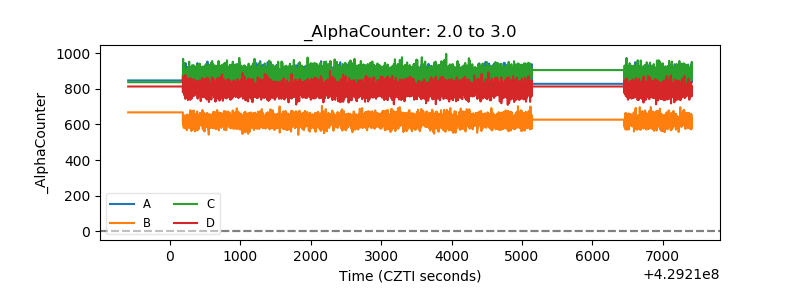 |
| _CPM_Rate | 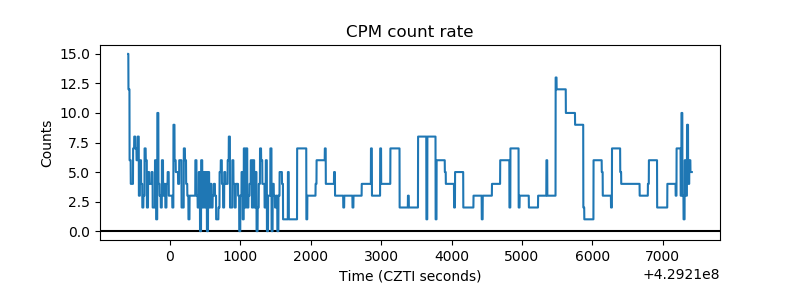 |
| CZT Counter |  |
| +2.5 Volts monitor | 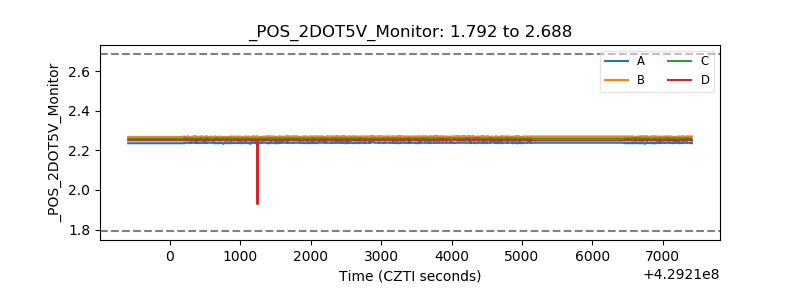 |
| +5 Volts monitor | 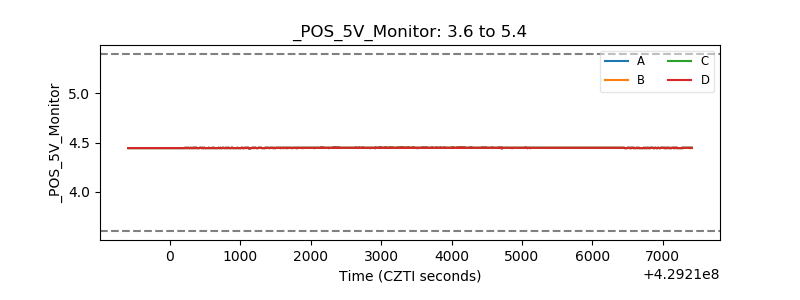 |
| _ROLL_ROT | 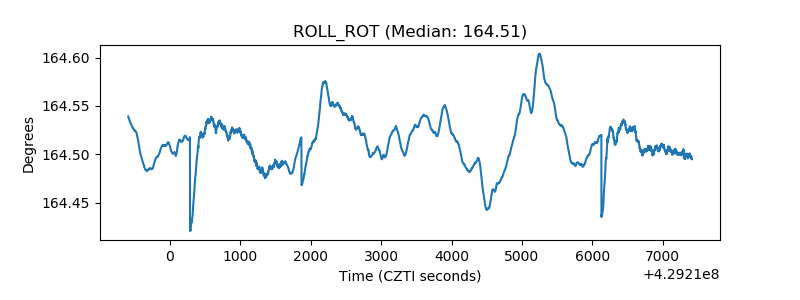 |
| _Roll_DEC | 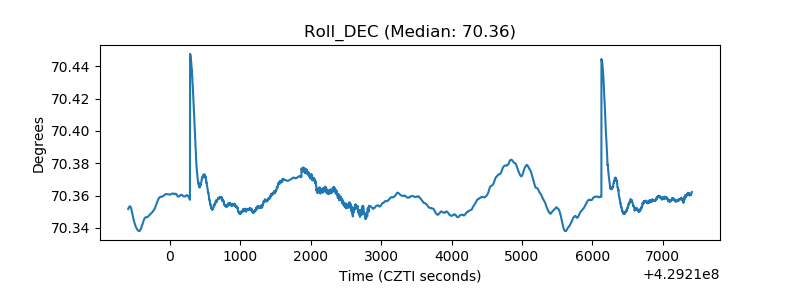 |
| _Roll_RA | 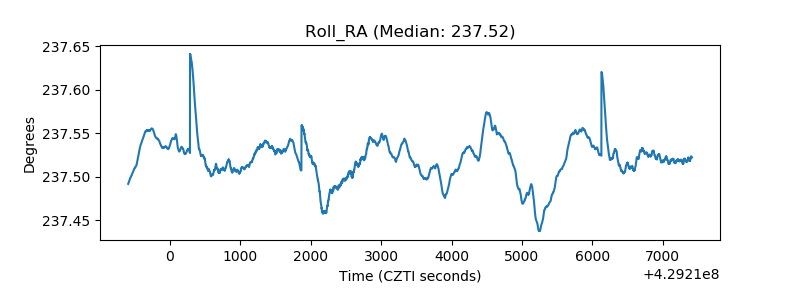 |
| Veto Counter | 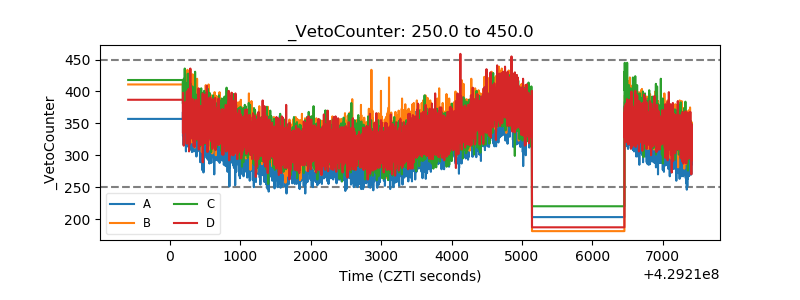 |