| Param | Original file | Final file |
|---|---|---|
| Filename | modeM0/AS1C07_001T10_9000005806_42511cztM0_level2.fits | modeM0/AS1C07_001T10_9000005806_42511cztM0_level2_quad_clean.evt |
| Size (bytes) | 624,896,640 | 106,280,640 |
| Size | 595.9 MB | 101.4 MB |
| Events in quadrant A | 3,639,681 | 751,566 |
| Events in quadrant B | 3,781,799 | 745,591 |
| Events in quadrant C | 9,689,717 | 598,301 |
| Events in quadrant D | 5,469,959 | 628,217 |
| Mode M9 | |||
|---|---|---|---|
| Quadrant | BADHDUFLAG | Total packets | Discarded packets |
| A | 0 | 18 | 0 |
| B | 0 | 19 | 0 |
| C | 0 | 19 | 0 |
| D | 0 | 19 | 0 |
| Mode SS | |||
|---|---|---|---|
| Quadrant | BADHDUFLAG | Total packets | Discarded packets |
| A | 0 | 142 | 0 |
| B | 0 | 142 | 0 |
| C | 0 | 142 | 0 |
| D | 0 | 142 | 0 |
| Mode M0 | |||
|---|---|---|---|
| Quadrant | BADHDUFLAG | Total packets | Discarded packets |
| A | 0 | 15397 | 2 |
| B | 0 | 16387 | 2 |
| C | 0 | 33783 | 2 |
| D | 0 | 21370 | 2 |
| Quadrant | Total seconds | Saturated seconds | Saturation percentage |
|---|---|---|---|
| A | 7101 | 15 | 0.211238% |
| B | 7101 | 84 | 1.182932% |
| C | 7101 | 1505 | 21.194198% |
| D | 7101 | 718 | 10.111252% |
Noise dominated data is calculated using 1-second bins in cleaned event files. If a bin has >2000 counts, and if more than 50% of those come from <1% of pixels, then it is considered to be noise-dominated and hence unusable.
| Quadrant | # 1 sec bins | Bins with >0 counts | Bins with >2000 counts | High rate bins dominated by noise | Noise dominated (total time) | Noise dominated (detector-on time) | Marked lightcurve |
|---|---|---|---|---|---|---|---|
| A | 8443 | 7102 | 5 | 5 | 0.06% | 0.07% | 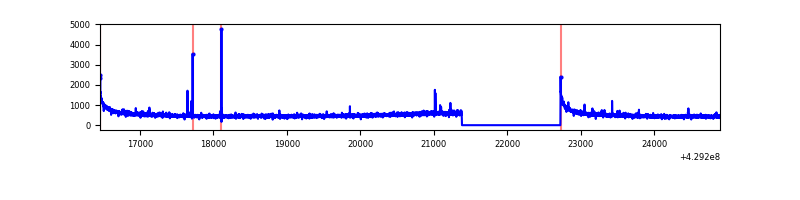 |
| B | 8443 | 7102 | 40 | 40 | 0.47% | 0.56% | 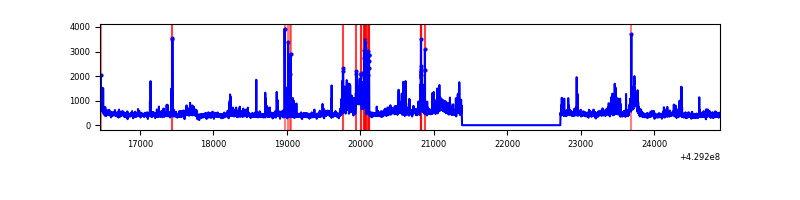 |
| C | 8443 | 7101 | 1452 | 1452 | 17.20% | 20.45% | 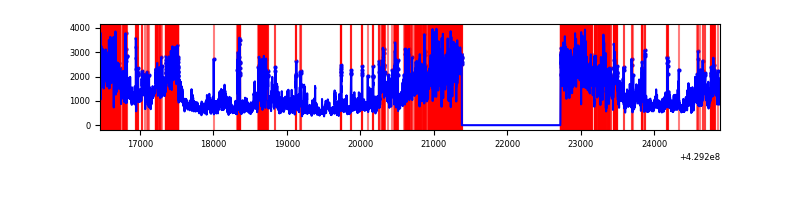 |
| D | 8443 | 7102 | 665 | 665 | 7.88% | 9.36% | 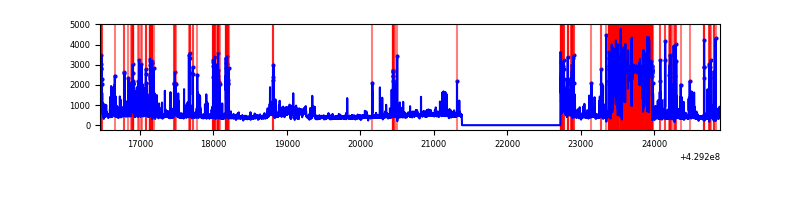 |
Top three noisy pixels from each quadrant. If the there are fewer than three noisy pixels in the level2.evt file, extra rows are filled as -1
| Pixel properties | Quadrant properties | ||||||
|---|---|---|---|---|---|---|---|
| Quadrant | DetID | PixID | Counts | Sigma | Mean | Median | Sigma |
| A | 10 | 83 | 693415 | 4551.1 | 736 | 720 | 152.2 |
| A | 13 | 248 | 32525 | 208.96 | 736 | 720 | 152.2 |
| A | 12 | 189 | 29819 | 191.18 | 736 | 720 | 152.2 |
| B | 0 | 229 | 749292 | 5336.34 | 729 | 707 | 140.3 |
| B | 0 | 245 | 47726 | 335.17 | 729 | 707 | 140.3 |
| B | 15 | 35 | 47199 | 331.42 | 729 | 707 | 140.3 |
| C | 0 | 239 | 6295157 | 40887.92 | 665 | 669 | 153.9 |
| C | 9 | 54 | 492740 | 3196.41 | 665 | 669 | 153.9 |
| C | 15 | 214 | 289095 | 1873.56 | 665 | 669 | 153.9 |
| D | 1 | 52 | 1623570 | 9589.02 | 683 | 663 | 169.2 |
| D | 12 | 233 | 295322 | 1741.01 | 683 | 663 | 169.2 |
| D | 2 | 16 | 259069 | 1526.8 | 683 | 663 | 169.2 |
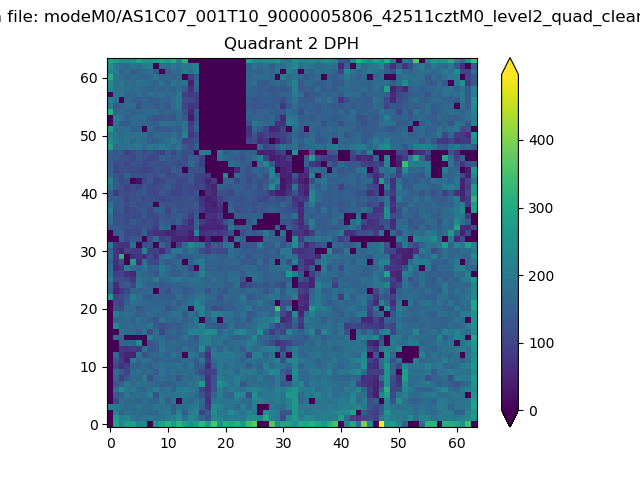
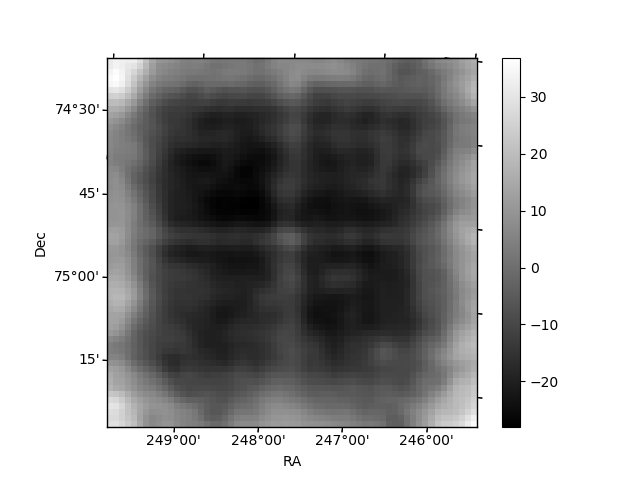
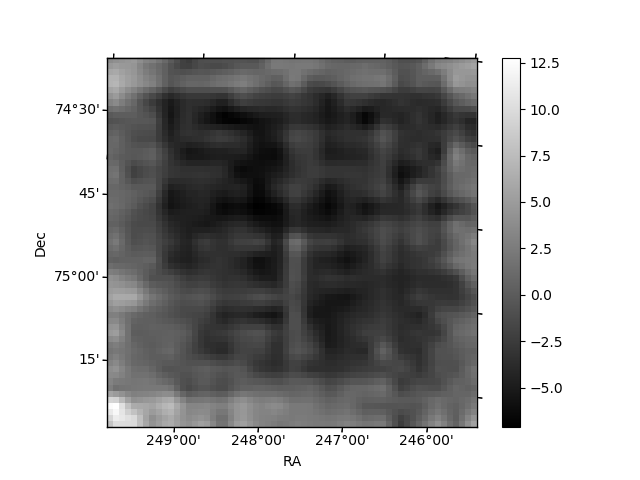
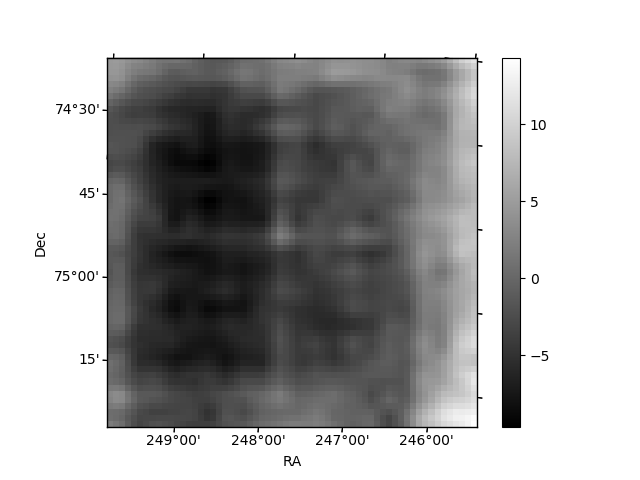
Histogram calculated using DETX and DETY for each event in the final _common_clean file
| Quadrant A | 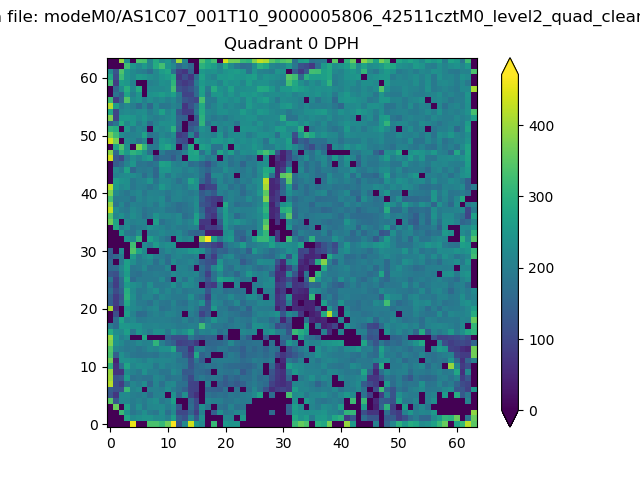 |
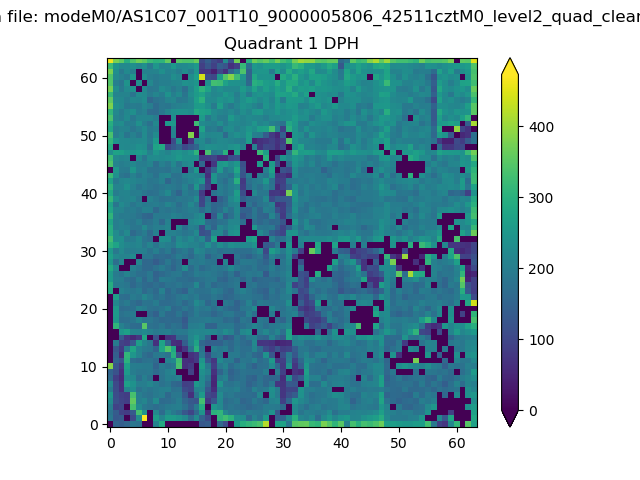 |
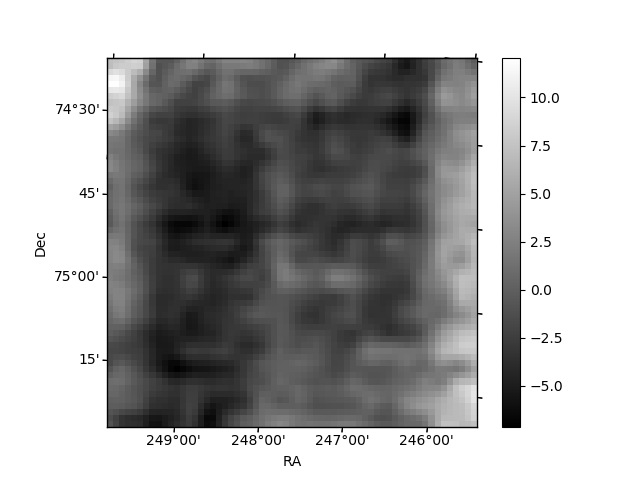
Quadrant B |
|---|---|---|---|
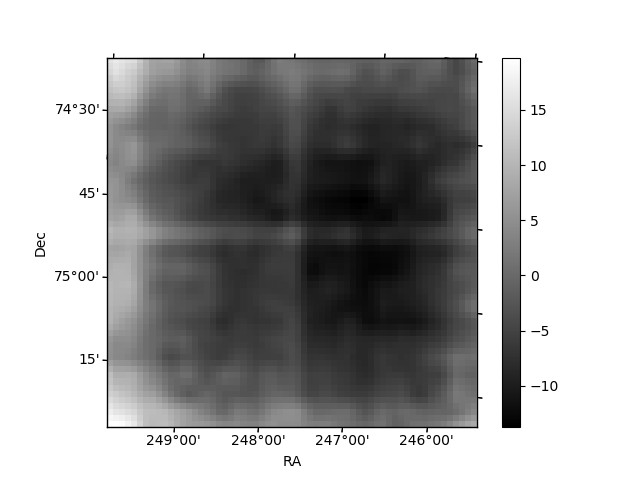
| Quadrant D | 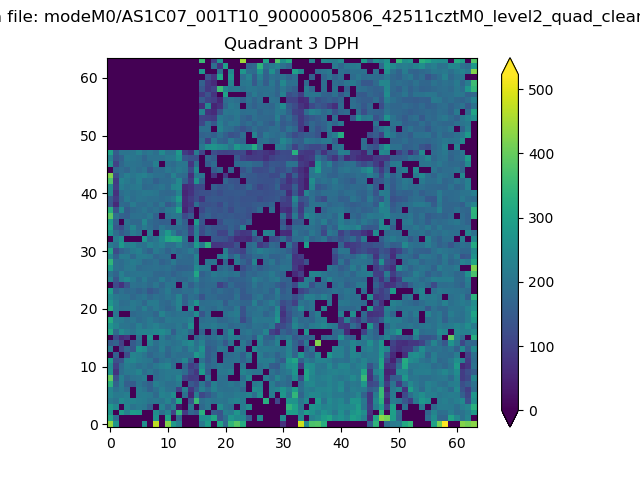 |
 |
Quadrant C |
| Plot type | Count rate plots | Images |
|---|---|---|
| Comparison with Poisson distribution Blue bars denote a histogram of data divided into 1 sec bins. Red curve is a Poisson curve with rate = median count rate of data. |
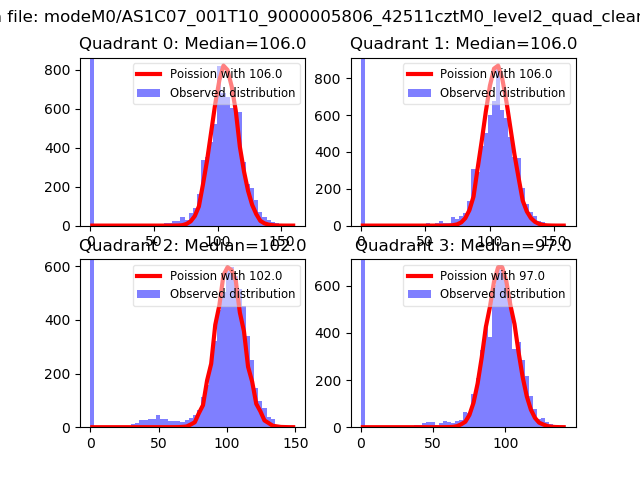 |
 |
| Quadrant-wise count rates Data is divided into 100 sec bins |
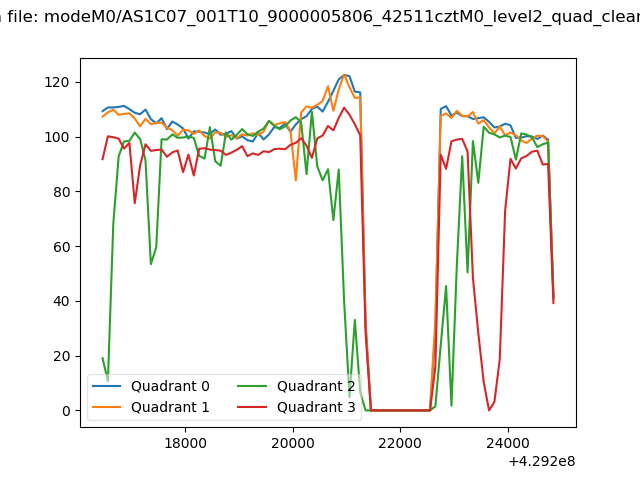 |
|
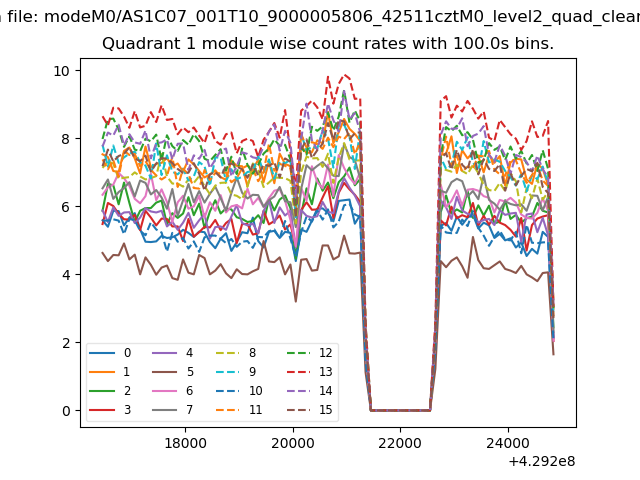
| Module-wise count rates for Quadrant A Data is divided into 100 sec bins |
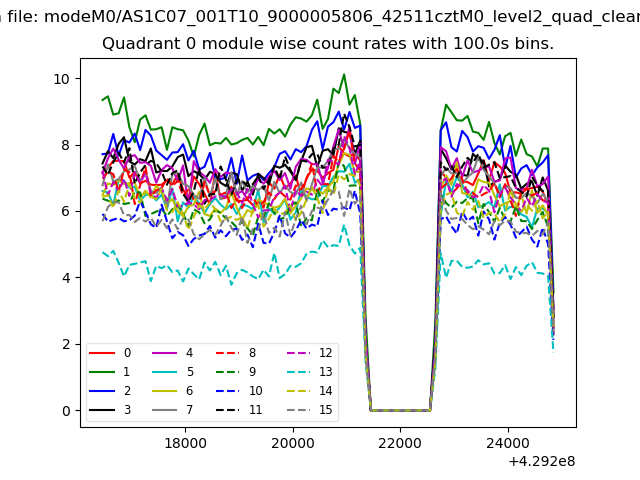 |
 |
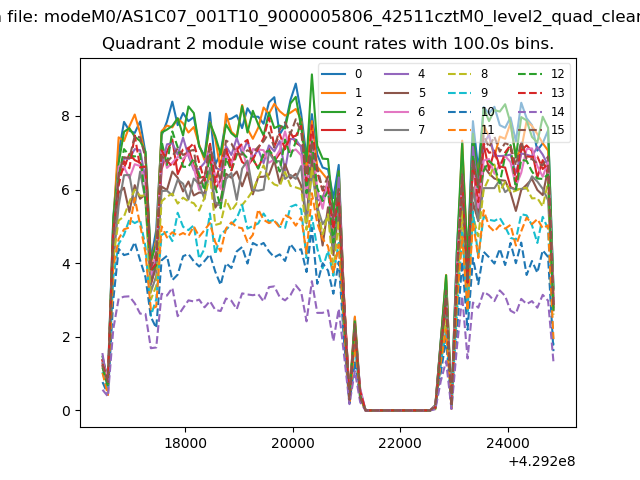
| Module-wise count rates for Quadrant B Data is divided into 100 sec bins |
 |
 |
| Module-wise count rates for Quadrant C Data is divided into 100 sec bins |
 |
 |
| Module-wise count rates for Quadrant D Data is divided into 100 sec bins |
 |
 |
| Parameter | Plot |
|---|---|
| CZT HV Monitor | 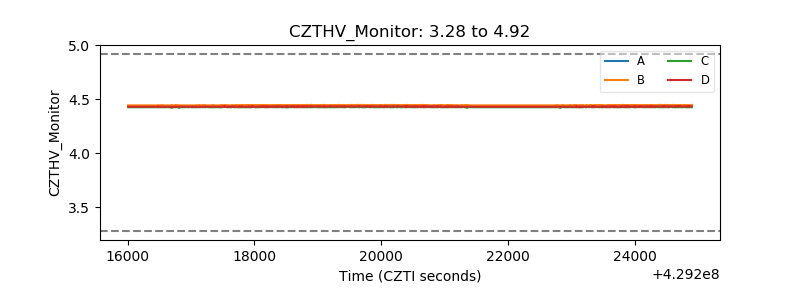 |
| D_VDD | 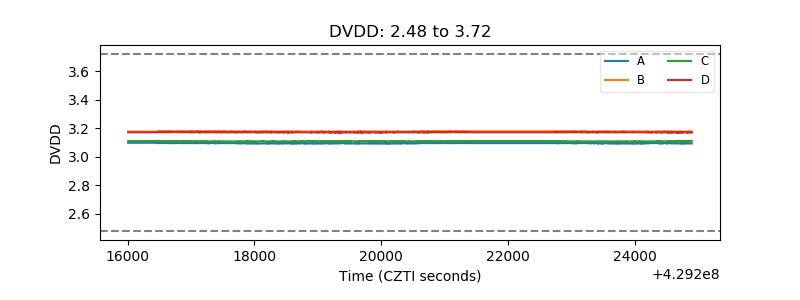 |
| Temperature 1 | 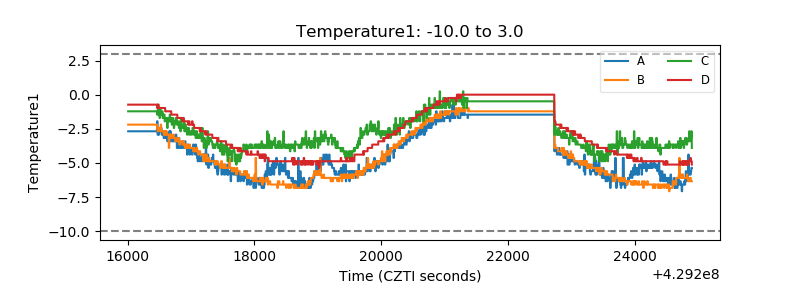 |
| Veto HV Monitor | 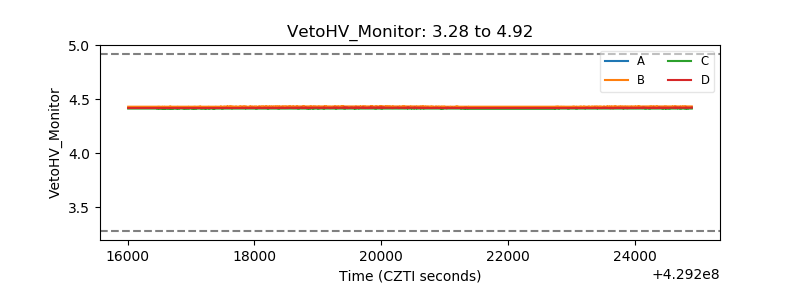 |
| Veto LLD | 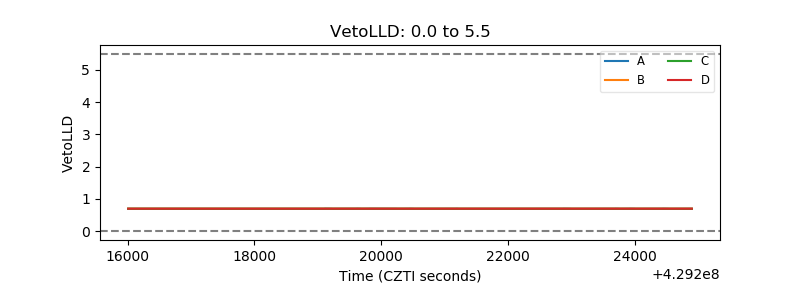 |
| Alpha Counter | 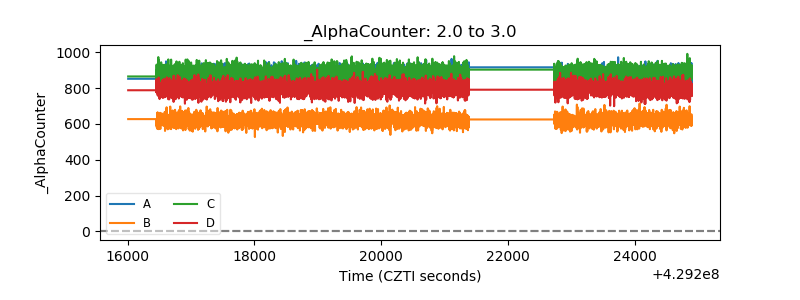 |
| _CPM_Rate | 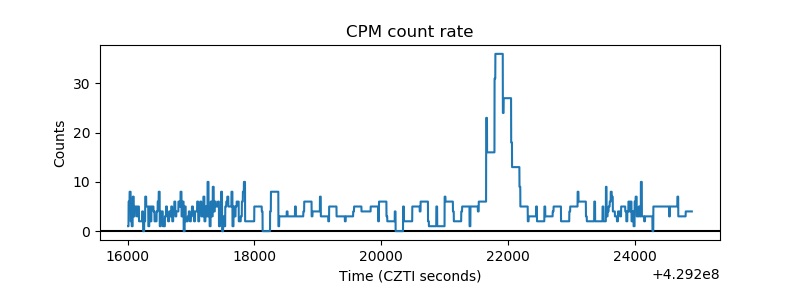 |
| CZT Counter | 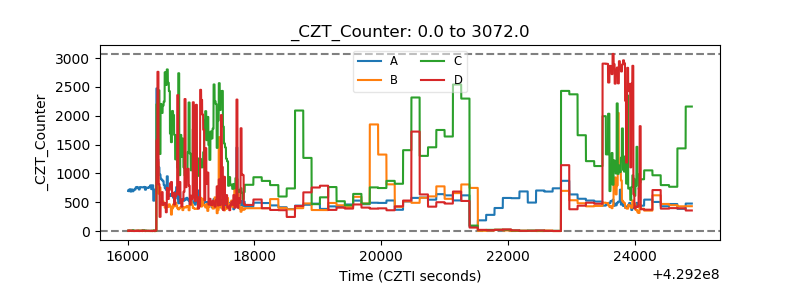 |
| +2.5 Volts monitor | 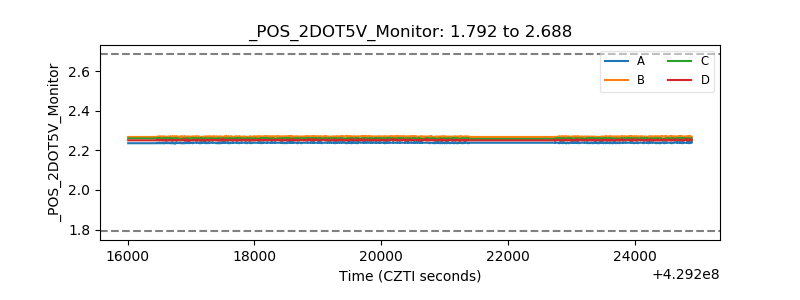 |
| +5 Volts monitor | 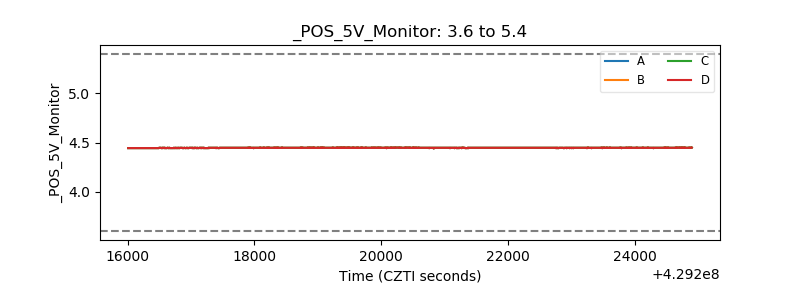 |
| _ROLL_ROT | 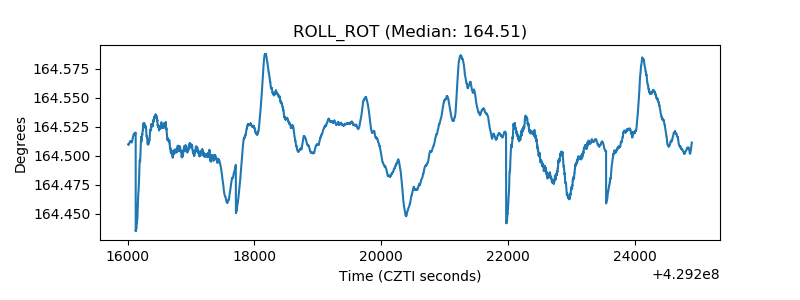 |
| _Roll_DEC | 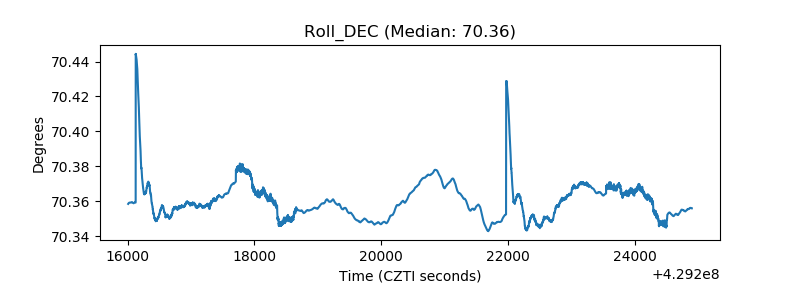 |
| _Roll_RA | 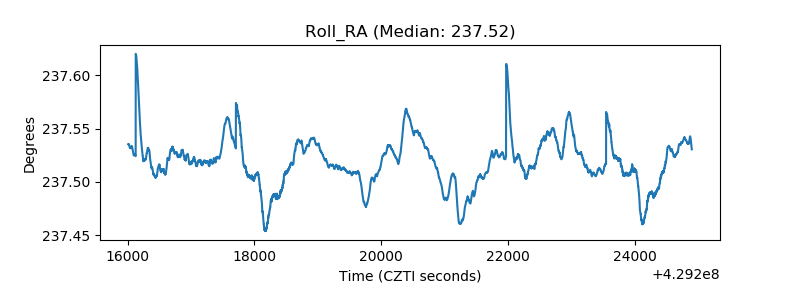 |
| Veto Counter | 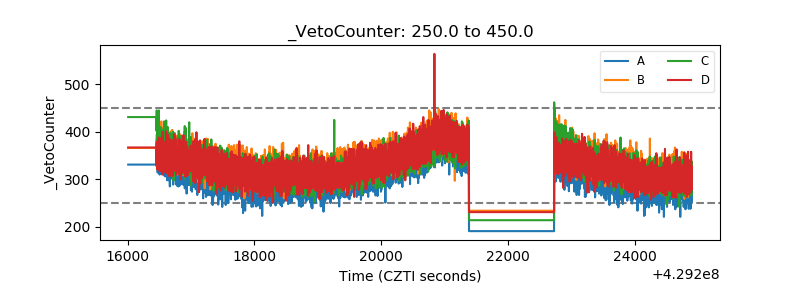 |