| Param | Original file | Final file |
|---|---|---|
| Filename | modeM0/AS1C07_001T10_9000005806_42513cztM0_level2.fits | modeM0/AS1C07_001T10_9000005806_42513cztM0_level2_quad_clean.evt |
| Size (bytes) | 376,850,880 | 96,629,760 |
| Size | 359.4 MB | 92.2 MB |
| Events in quadrant A | 3,309,035 | 645,375 |
| Events in quadrant B | 3,509,133 | 643,633 |
| Events in quadrant C | 3,584,761 | 632,523 |
| Events in quadrant D | 3,081,461 | 586,487 |
| Mode M9 | |||
|---|---|---|---|
| Quadrant | BADHDUFLAG | Total packets | Discarded packets |
| A | 0 | 31 | 0 |
| B | 0 | 31 | 0 |
| C | 0 | 31 | 0 |
| D | 0 | 31 | 0 |
| Mode SS | |||
|---|---|---|---|
| Quadrant | BADHDUFLAG | Total packets | Discarded packets |
| A | 0 | 124 | 0 |
| B | 0 | 124 | 0 |
| C | 0 | 124 | 0 |
| D | 0 | 124 | 0 |
| Mode M0 | |||
|---|---|---|---|
| Quadrant | BADHDUFLAG | Total packets | Discarded packets |
| A | 0 | 13661 | 2 |
| B | 0 | 14411 | 3 |
| C | 0 | 14574 | 2 |
| D | 0 | 13709 | 2 |
| Quadrant | Total seconds | Saturated seconds | Saturation percentage |
|---|---|---|---|
| A | 5982 | 13 | 0.217319% |
| B | 5981 | 118 | 1.972914% |
| C | 5982 | 12 | 0.200602% |
| D | 5982 | 108 | 1.805416% |
Noise dominated data is calculated using 1-second bins in cleaned event files. If a bin has >2000 counts, and if more than 50% of those come from <1% of pixels, then it is considered to be noise-dominated and hence unusable.
| Quadrant | # 1 sec bins | Bins with >0 counts | Bins with >2000 counts | High rate bins dominated by noise | Noise dominated (total time) | Noise dominated (detector-on time) | Marked lightcurve |
|---|---|---|---|---|---|---|---|
| A | 9177 | 5984 | 6 | 6 | 0.07% | 0.10% | 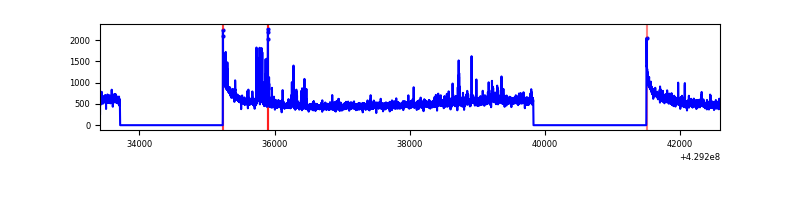 |
| B | 9176 | 5983 | 93 | 93 | 1.01% | 1.55% | 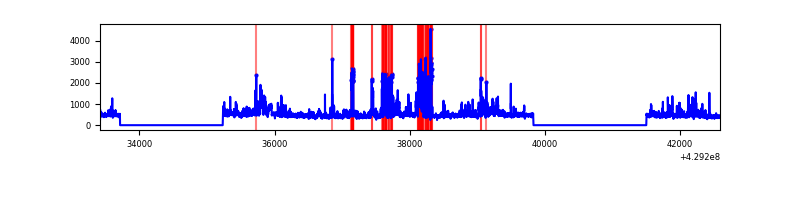 |
| C | 9177 | 5984 | 6 | 6 | 0.07% | 0.10% | 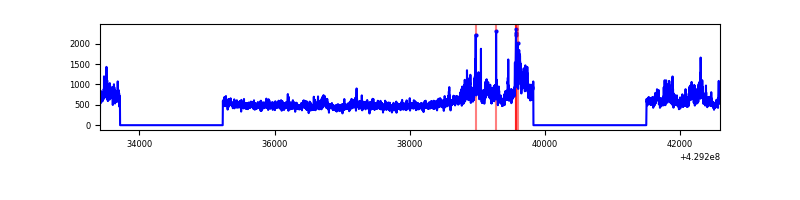 |
| D | 9177 | 5984 | 93 | 93 | 1.01% | 1.55% | 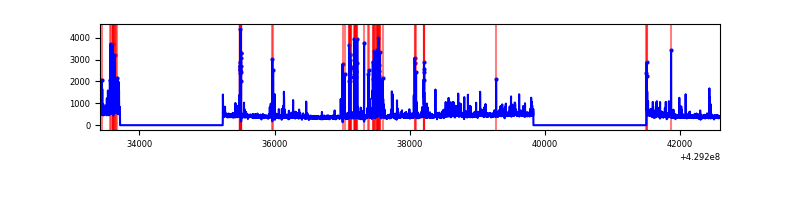 |
Top three noisy pixels from each quadrant. If the there are fewer than three noisy pixels in the level2.evt file, extra rows are filled as -1
| Pixel properties | Quadrant properties | ||||||
|---|---|---|---|---|---|---|---|
| Quadrant | DetID | PixID | Counts | Sigma | Mean | Median | Sigma |
| A | 10 | 83 | 617563 | 4731.41 | 637 | 623 | 130.4 |
| A | 13 | 248 | 104925 | 799.91 | 637 | 623 | 130.4 |
| A | 12 | 189 | 75691 | 575.71 | 637 | 623 | 130.4 |
| B | 0 | 229 | 873121 | 7148.24 | 627 | 609 | 122.1 |
| B | 0 | 245 | 137426 | 1120.9 | 627 | 609 | 122.1 |
| B | 5 | 255 | 22759 | 181.47 | 627 | 609 | 122.1 |
| C | 0 | 239 | 874984 | 6040.68 | 619 | 621 | 144.7 |
| C | 15 | 214 | 265335 | 1828.82 | 619 | 621 | 144.7 |
| C | 7 | 220 | 23948 | 161.16 | 619 | 621 | 144.7 |
| D | 12 | 6 | 165332 | 1089.03 | 620 | 602 | 151.3 |
| D | 2 | 249 | 158066 | 1040.99 | 620 | 602 | 151.3 |
| D | 13 | 249 | 129291 | 850.76 | 620 | 602 | 151.3 |
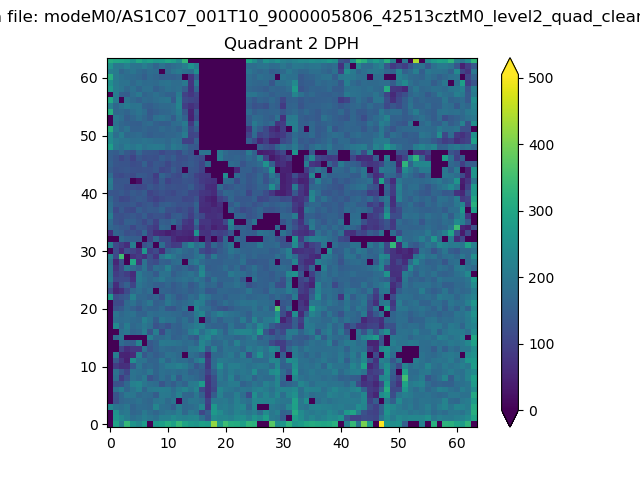
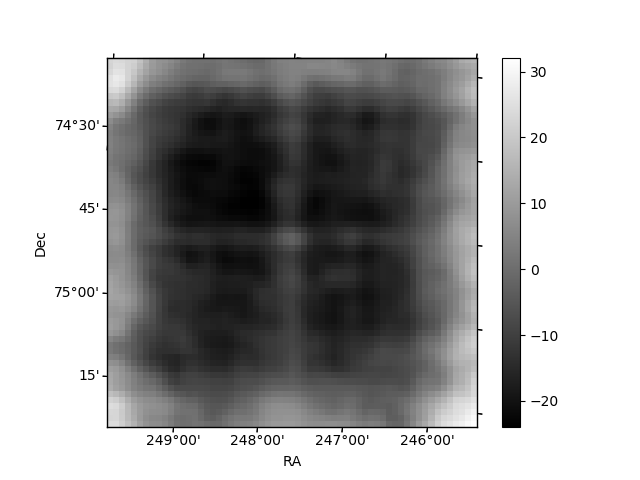
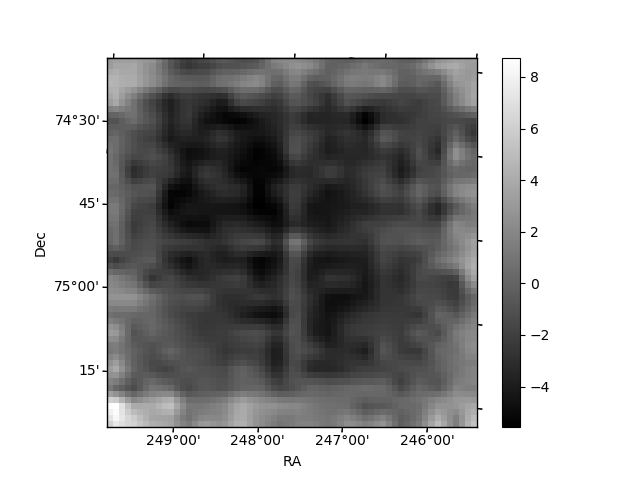
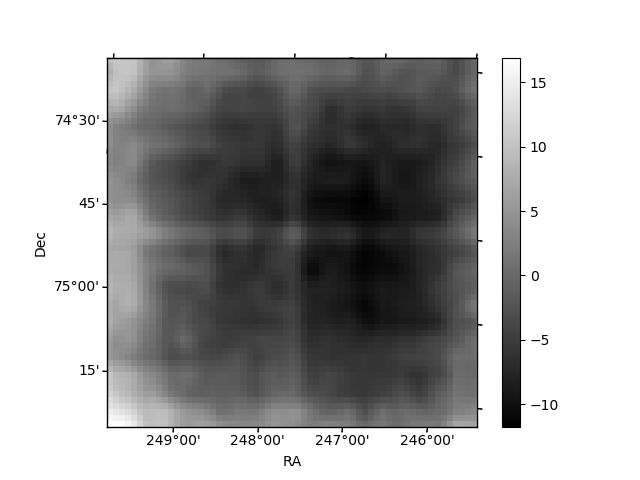
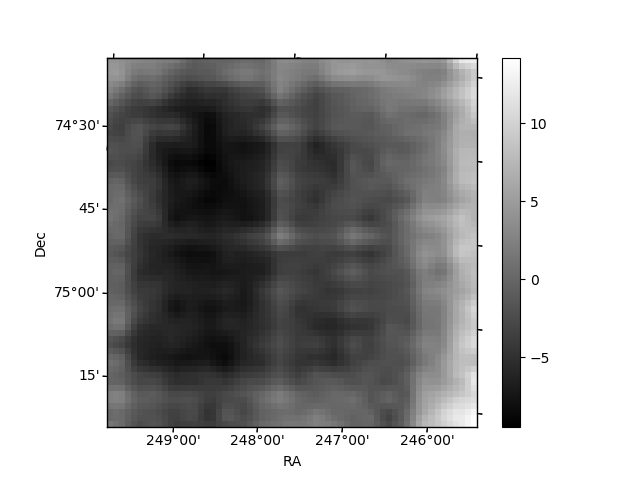
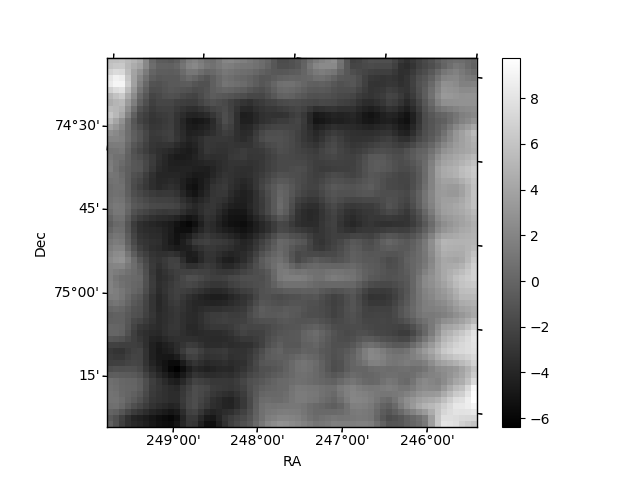
Histogram calculated using DETX and DETY for each event in the final _common_clean file
| Quadrant A | 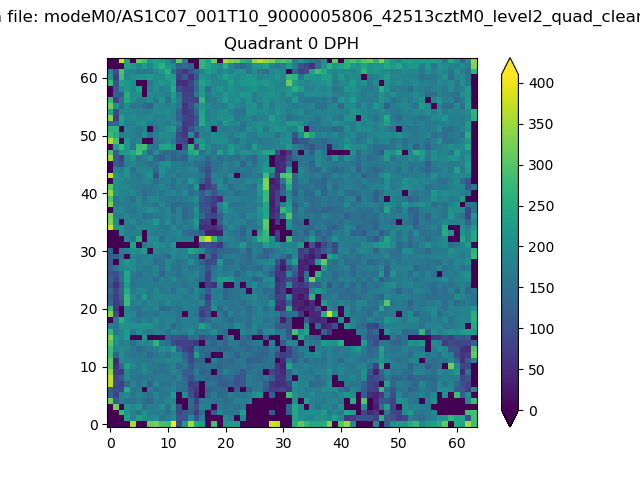 |
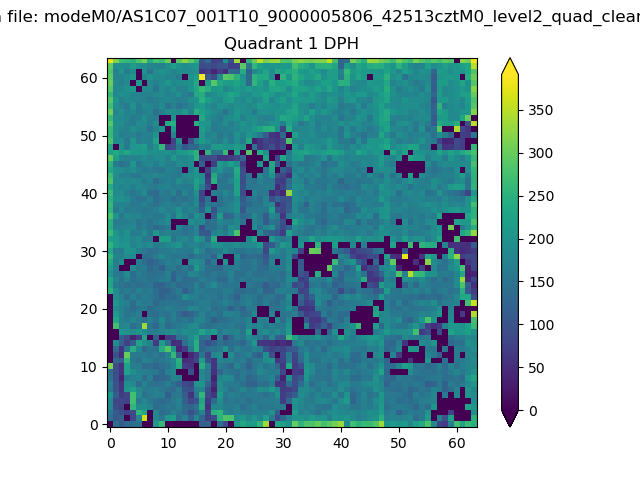 |
Quadrant B |
|---|---|---|---|
| Quadrant D | 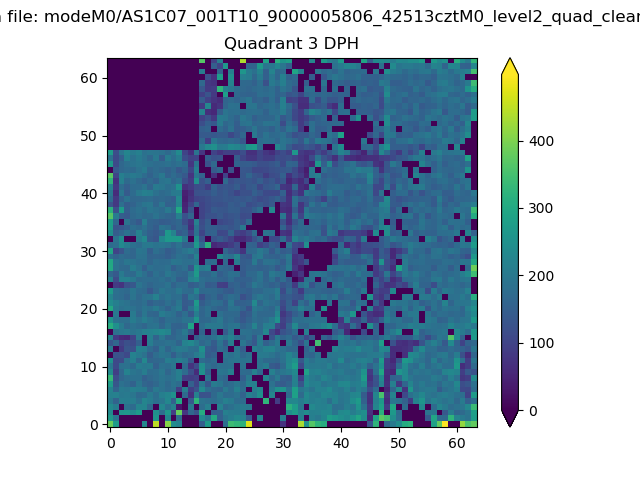 |
 |
Quadrant C |
| Plot type | Count rate plots | Images |
|---|---|---|
| Comparison with Poisson distribution Blue bars denote a histogram of data divided into 1 sec bins. Red curve is a Poisson curve with rate = median count rate of data. |
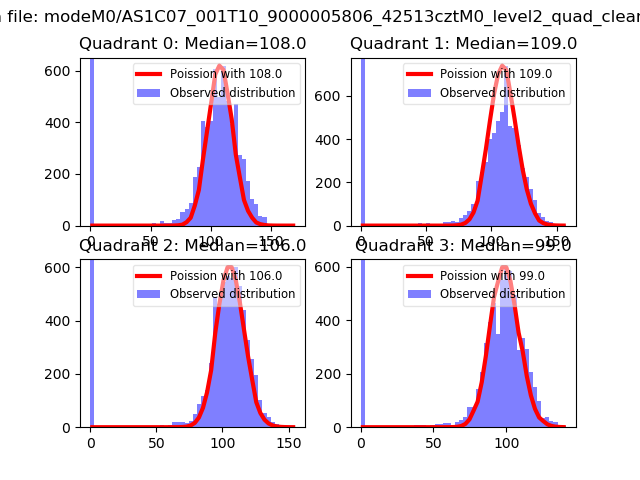 |
 |
| Quadrant-wise count rates Data is divided into 100 sec bins |
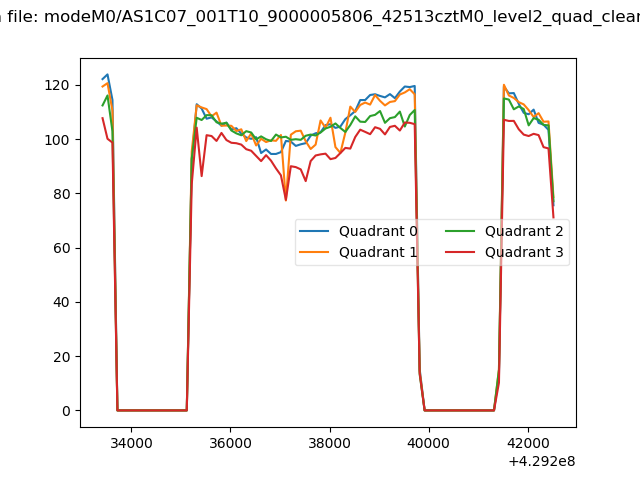 |
|
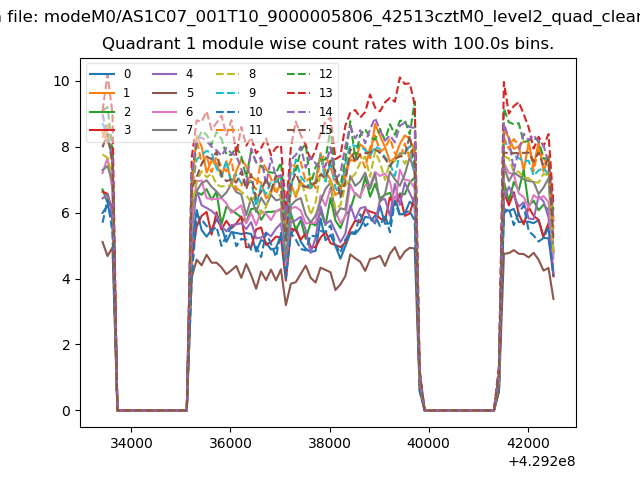
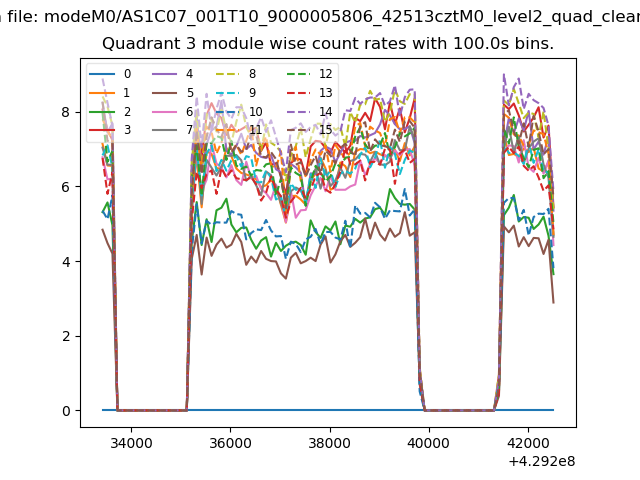
| Module-wise count rates for Quadrant A Data is divided into 100 sec bins |
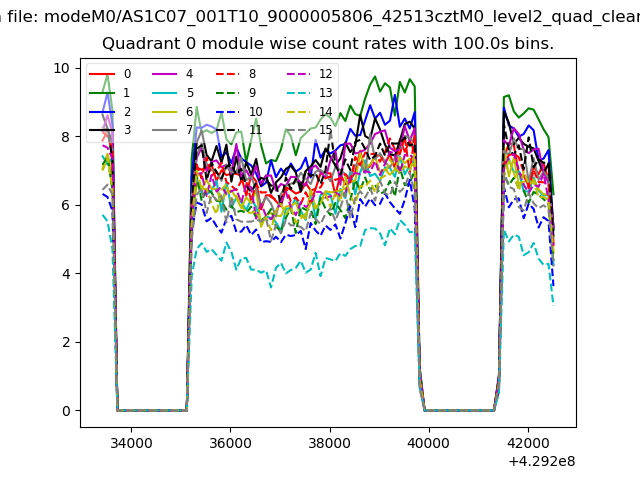 |
 |
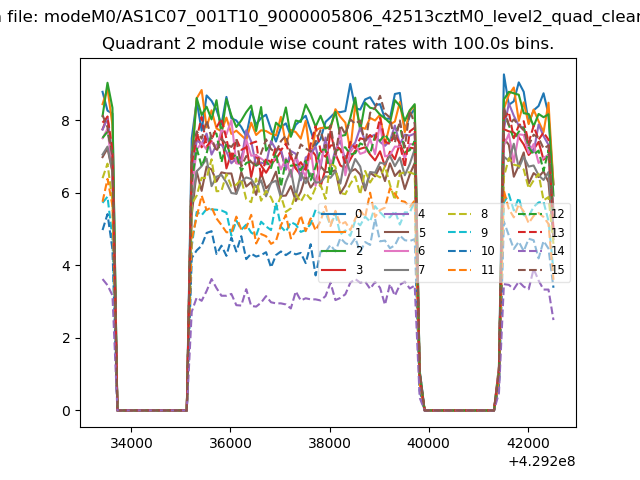
| Module-wise count rates for Quadrant B Data is divided into 100 sec bins |
 |
 |
| Module-wise count rates for Quadrant C Data is divided into 100 sec bins |
 |
 |
| Module-wise count rates for Quadrant D Data is divided into 100 sec bins |
 |
 |
| Parameter | Plot |
|---|---|
| CZT HV Monitor | 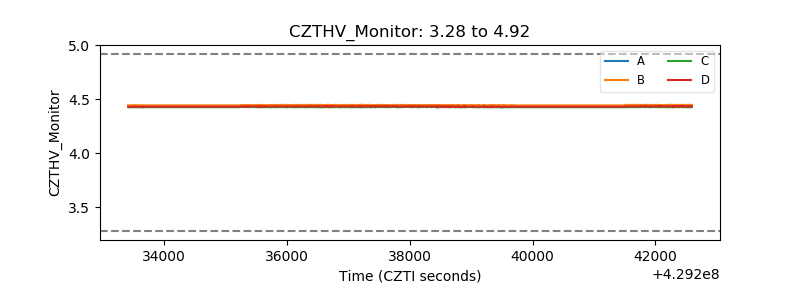 |
| D_VDD |  |
| Temperature 1 | 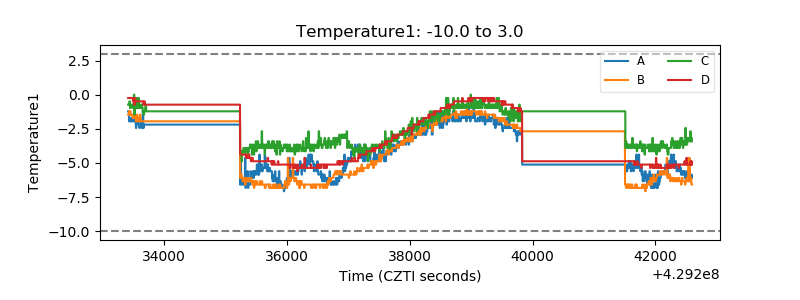 |
| Veto HV Monitor | 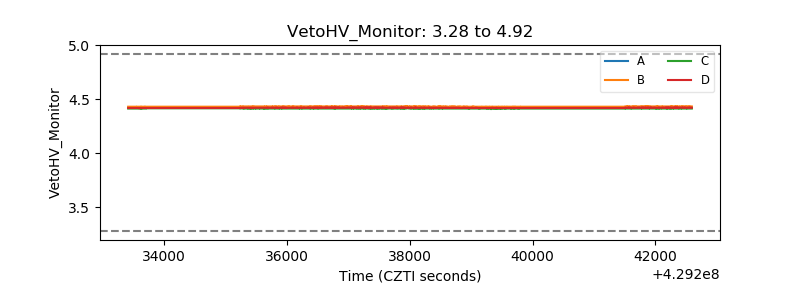 |
| Veto LLD | 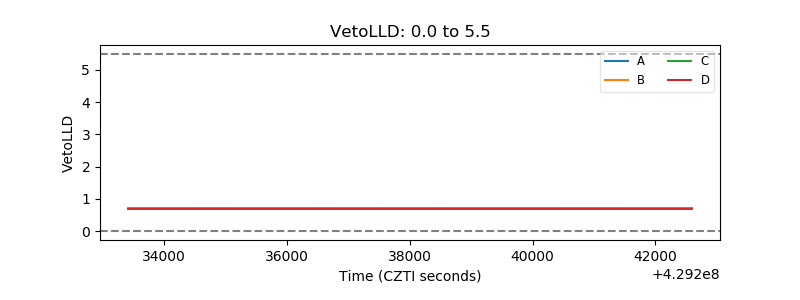 |
| Alpha Counter | 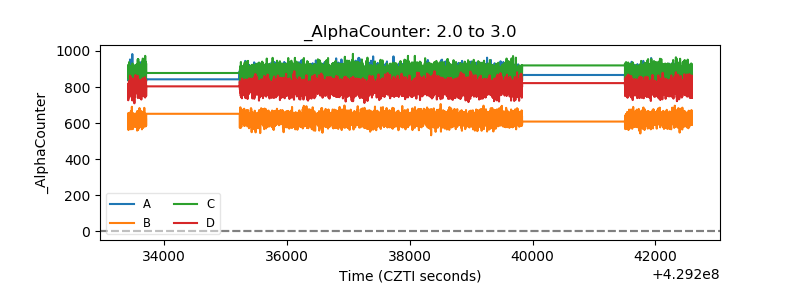 |
| _CPM_Rate | 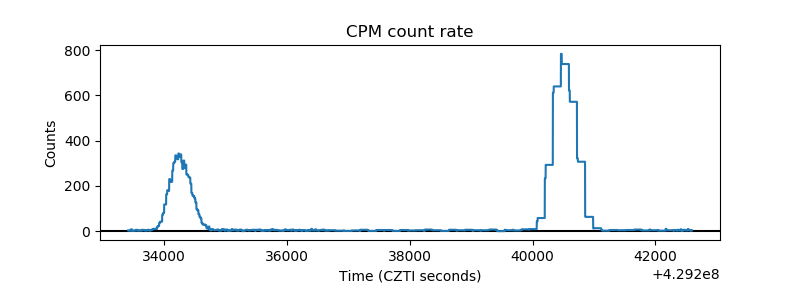 |
| CZT Counter |  |
| +2.5 Volts monitor | 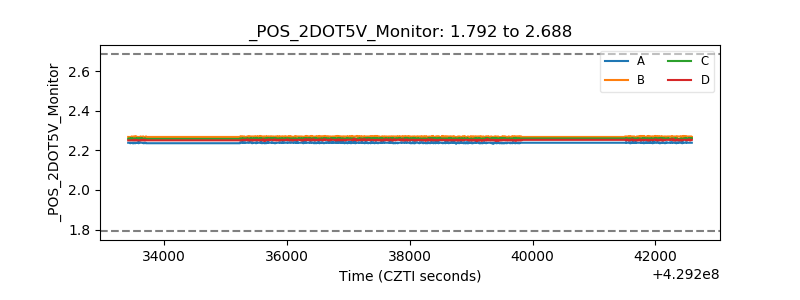 |
| +5 Volts monitor | 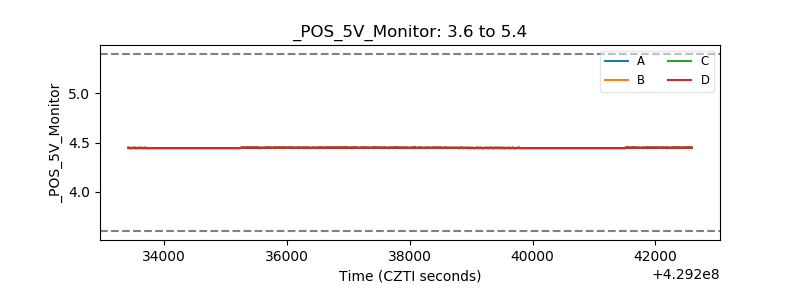 |
| _ROLL_ROT | 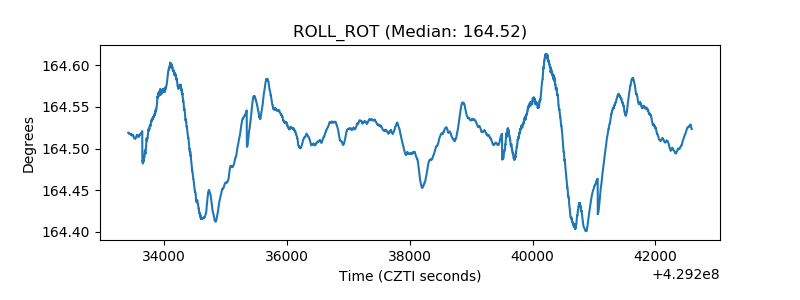 |
| _Roll_DEC | 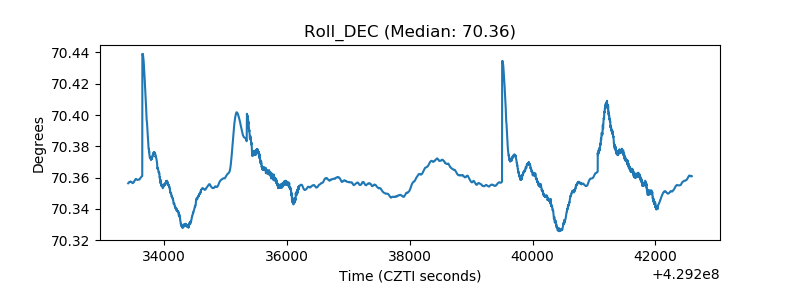 |
| _Roll_RA | 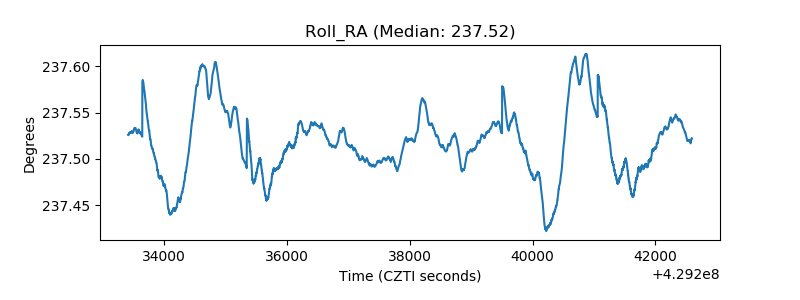 |
| Veto Counter | 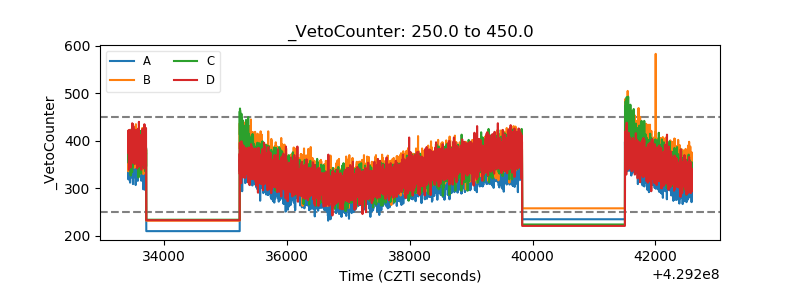 |