| Param | Original file | Final file |
|---|---|---|
| Filename | modeM0/AS1C07_001T10_9000005806_42515cztM0_level2.fits | modeM0/AS1C07_001T10_9000005806_42515cztM0_level2_quad_clean.evt |
| Size (bytes) | 325,892,160 | 89,455,680 |
| Size | 310.8 MB | 85.3 MB |
| Events in quadrant A | 2,991,618 | 596,170 |
| Events in quadrant B | 2,615,999 | 605,608 |
| Events in quadrant C | 3,459,432 | 583,622 |
| Events in quadrant D | 2,573,122 | 542,562 |
| Mode M9 | |||
|---|---|---|---|
| Quadrant | BADHDUFLAG | Total packets | Discarded packets |
| A | 0 | 26 | 0 |
| B | 0 | 27 | 0 |
| C | 0 | 27 | 0 |
| D | 0 | 27 | 0 |
| Mode SS | |||
|---|---|---|---|
| Quadrant | BADHDUFLAG | Total packets | Discarded packets |
| A | 0 | 112 | 0 |
| B | 0 | 112 | 0 |
| C | 0 | 112 | 0 |
| D | 0 | 112 | 0 |
| Mode M0 | |||
|---|---|---|---|
| Quadrant | BADHDUFLAG | Total packets | Discarded packets |
| A | 0 | 12267 | 2 |
| B | 0 | 11582 | 2 |
| C | 0 | 13792 | 2 |
| D | 0 | 11747 | 2 |
| Quadrant | Total seconds | Saturated seconds | Saturation percentage |
|---|---|---|---|
| A | 5434 | 18 | 0.331248% |
| B | 5434 | 5 | 0.092013% |
| C | 5434 | 22 | 0.404858% |
| D | 5434 | 40 | 0.736106% |
Noise dominated data is calculated using 1-second bins in cleaned event files. If a bin has >2000 counts, and if more than 50% of those come from <1% of pixels, then it is considered to be noise-dominated and hence unusable.
| Quadrant | # 1 sec bins | Bins with >0 counts | Bins with >2000 counts | High rate bins dominated by noise | Noise dominated (total time) | Noise dominated (detector-on time) | Marked lightcurve |
|---|---|---|---|---|---|---|---|
| A | 7226 | 5435 | 6 | 6 | 0.08% | 0.11% | 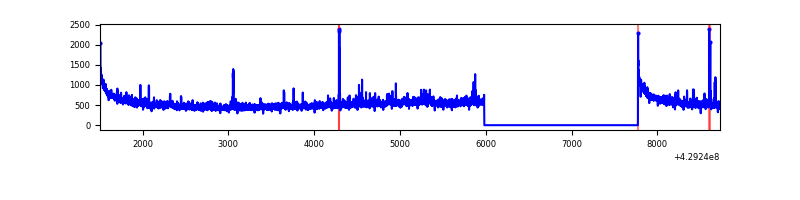 |
| B | 7226 | 5435 | 0 | 0 | 0.00% | 0.00% | 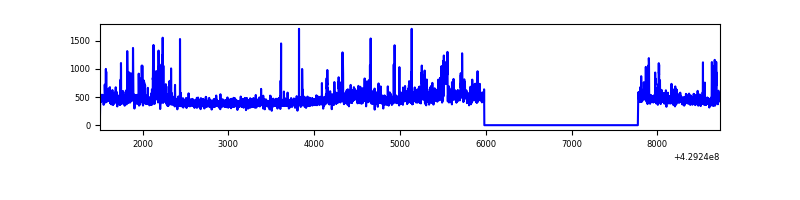 |
| C | 7226 | 5435 | 12 | 12 | 0.17% | 0.22% | 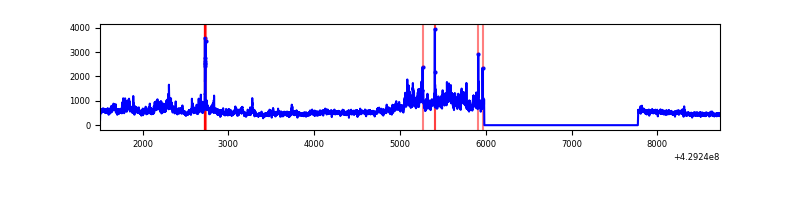 |
| D | 7226 | 5435 | 35 | 35 | 0.48% | 0.64% | 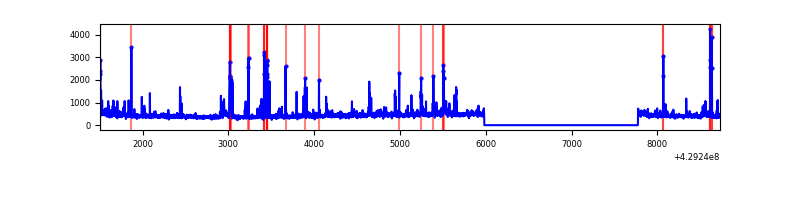 |
Top three noisy pixels from each quadrant. If the there are fewer than three noisy pixels in the level2.evt file, extra rows are filled as -1
| Pixel properties | Quadrant properties | ||||||
|---|---|---|---|---|---|---|---|
| Quadrant | DetID | PixID | Counts | Sigma | Mean | Median | Sigma |
| A | 10 | 83 | 567671 | 4777.0 | 580 | 568 | 118.7 |
| A | 12 | 189 | 100663 | 843.15 | 580 | 568 | 118.7 |
| A | 2 | 79 | 38164 | 316.69 | 580 | 568 | 118.7 |
| B | 0 | 229 | 235533 | 2116.05 | 576 | 559 | 111.0 |
| B | 0 | 245 | 67036 | 598.66 | 576 | 559 | 111.0 |
| B | 5 | 255 | 22298 | 195.77 | 576 | 559 | 111.0 |
| C | 0 | 239 | 966893 | 7325.21 | 562 | 566 | 131.9 |
| C | 15 | 214 | 244523 | 1849.31 | 562 | 566 | 131.9 |
| C | 7 | 220 | 26735 | 198.37 | 562 | 566 | 131.9 |
| D | 12 | 6 | 91330 | 659.02 | 565 | 549 | 137.8 |
| D | 1 | 47 | 57319 | 412.12 | 565 | 549 | 137.8 |
| D | 7 | 112 | 46795 | 335.72 | 565 | 549 | 137.8 |
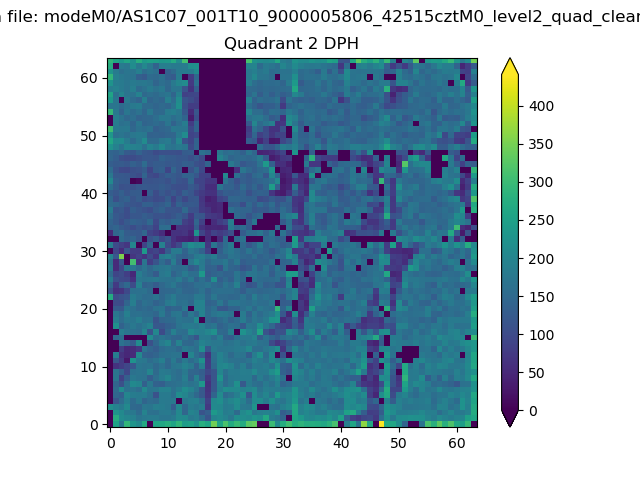
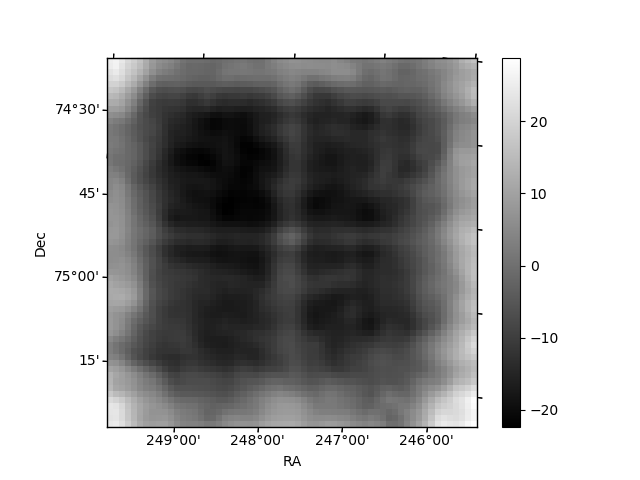
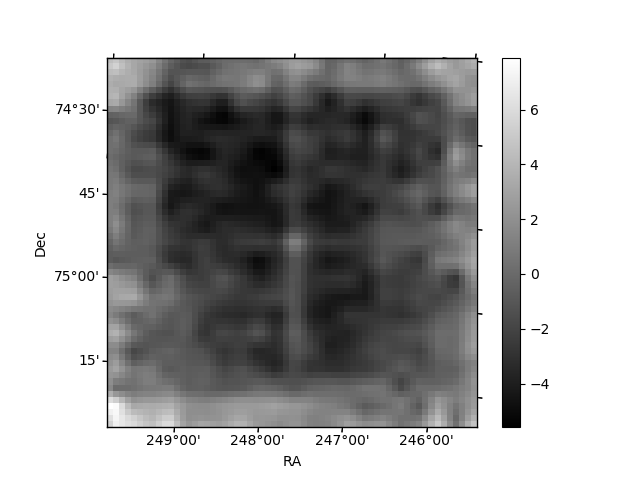
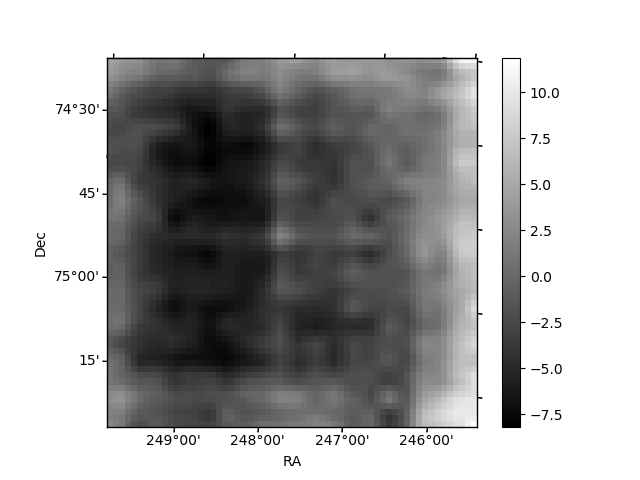
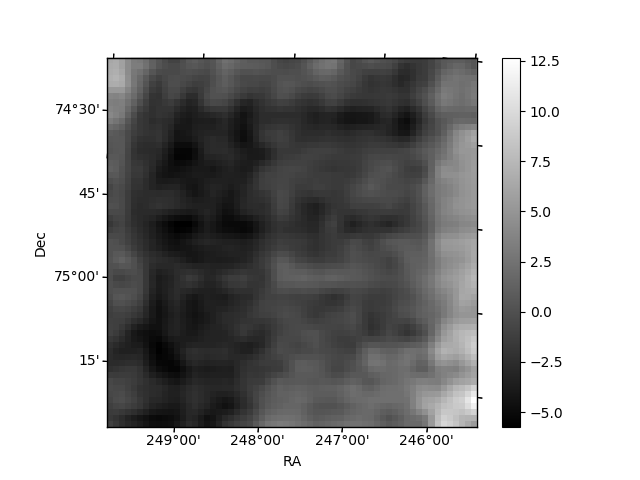
Histogram calculated using DETX and DETY for each event in the final _common_clean file
| Quadrant A | 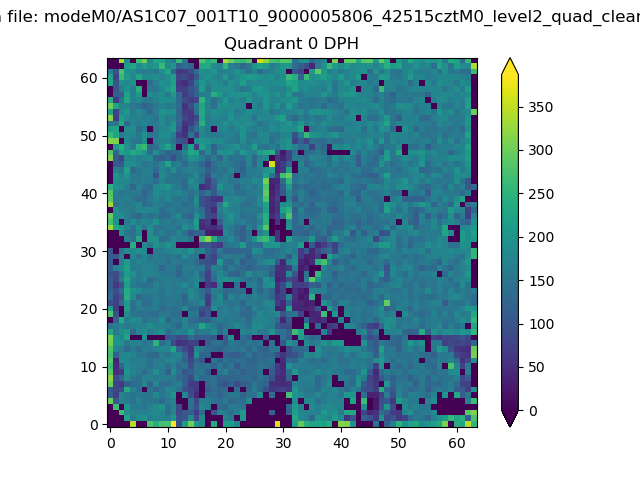 |
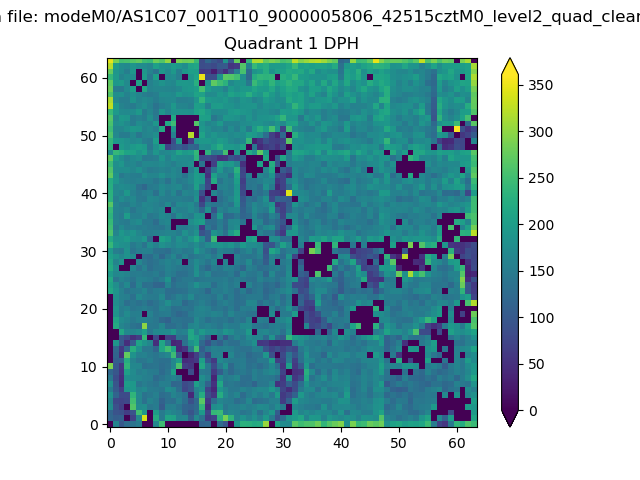 |
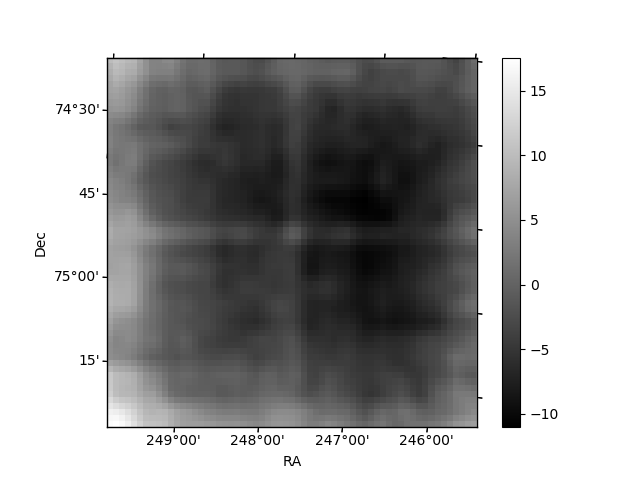
Quadrant B |
|---|---|---|---|
| Quadrant D | 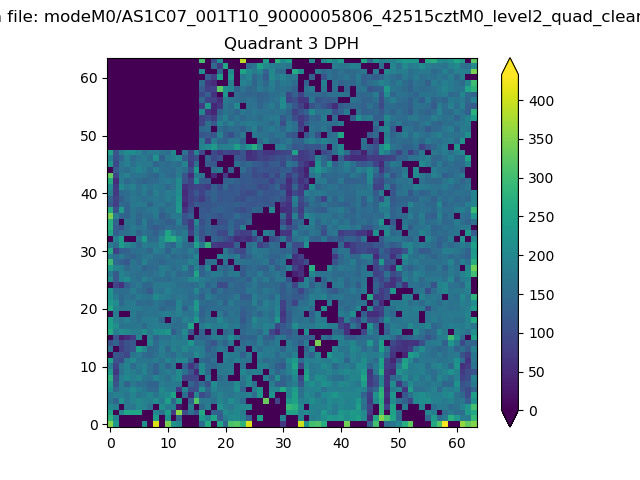 |
 |
Quadrant C |
| Plot type | Count rate plots | Images |
|---|---|---|
| Comparison with Poisson distribution Blue bars denote a histogram of data divided into 1 sec bins. Red curve is a Poisson curve with rate = median count rate of data. |
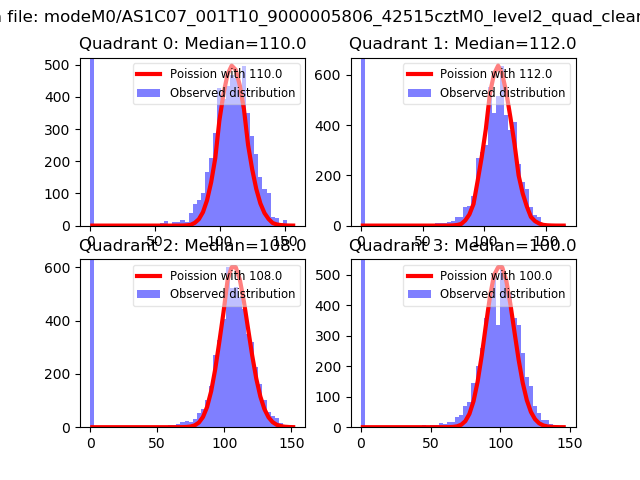 |
 |
| Quadrant-wise count rates Data is divided into 100 sec bins |
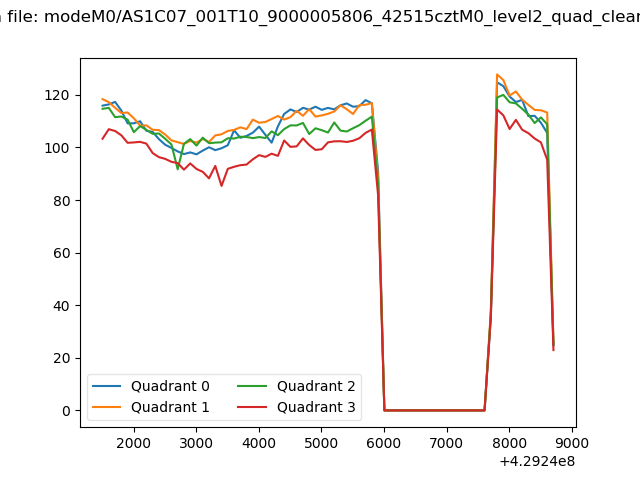 |
|
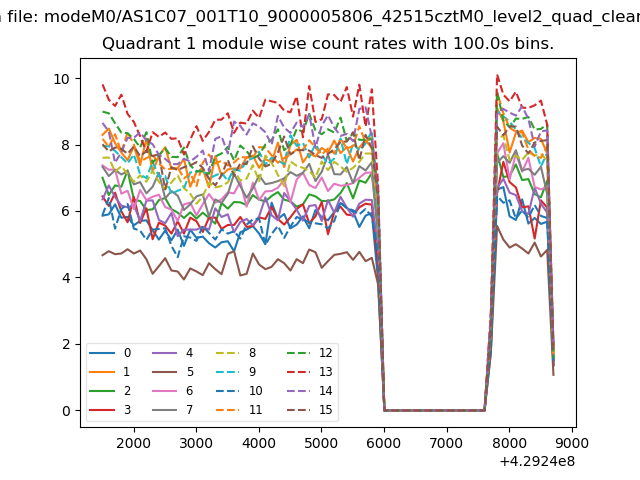
| Module-wise count rates for Quadrant A Data is divided into 100 sec bins |
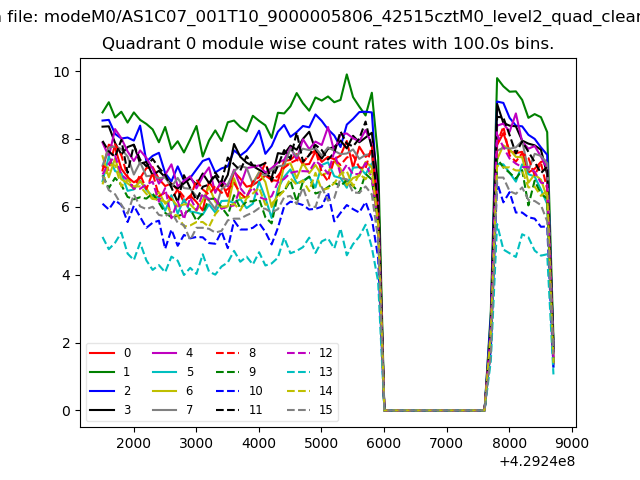 |
 |
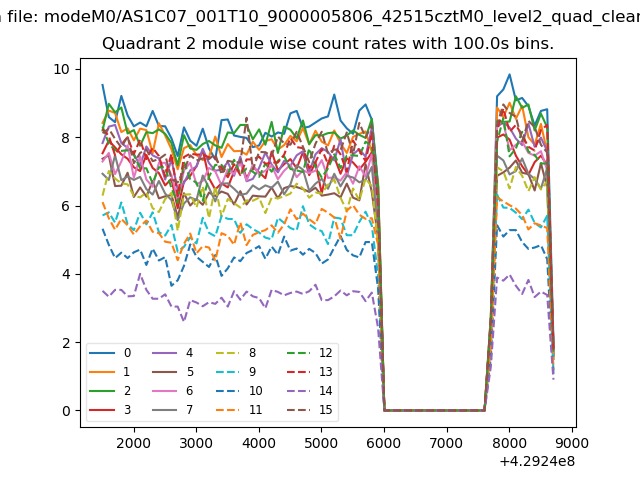
| Module-wise count rates for Quadrant B Data is divided into 100 sec bins |
 |
 |
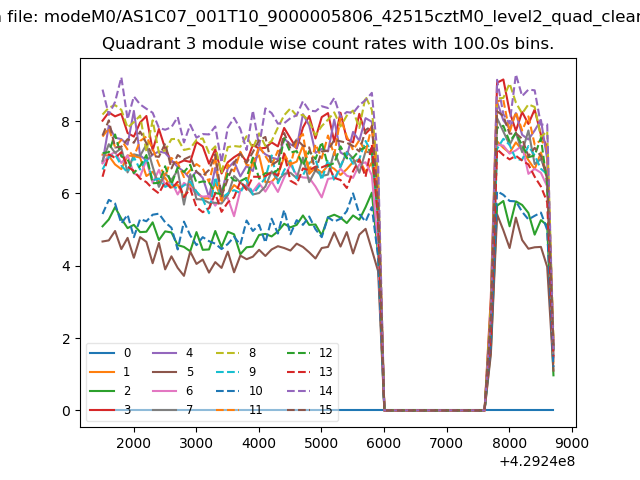
| Module-wise count rates for Quadrant C Data is divided into 100 sec bins |
 |
 |
| Module-wise count rates for Quadrant D Data is divided into 100 sec bins |
 |
 |
| Parameter | Plot |
|---|---|
| CZT HV Monitor | 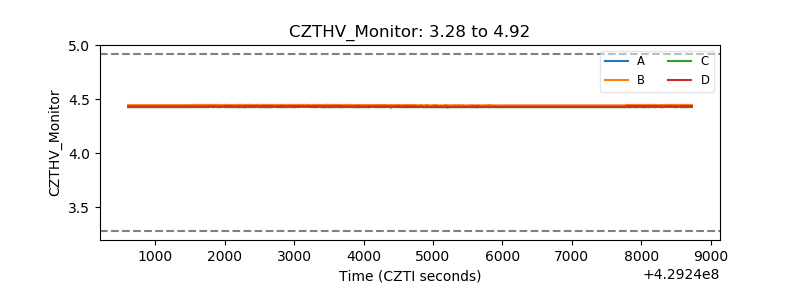 |
| D_VDD | 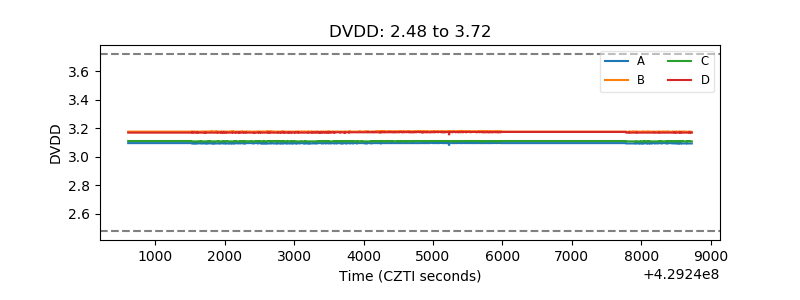 |
| Temperature 1 | 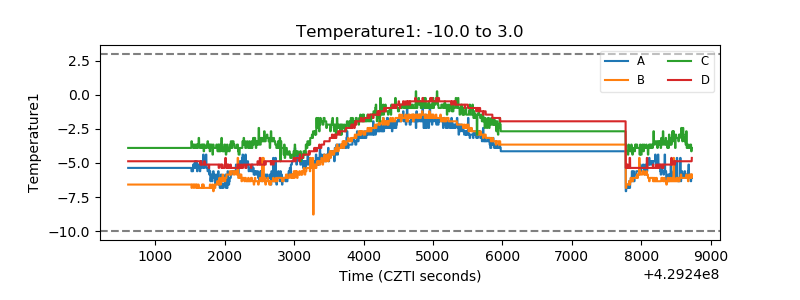 |
| Veto HV Monitor | 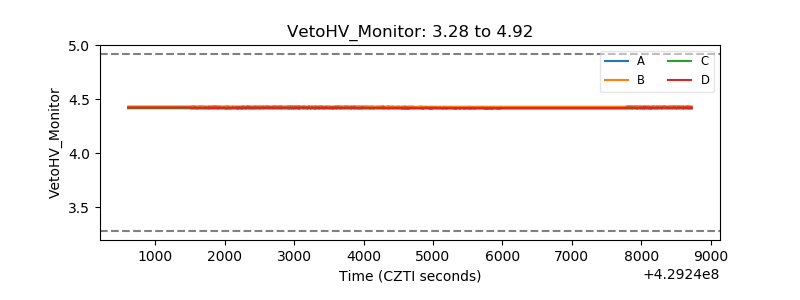 |
| Veto LLD | 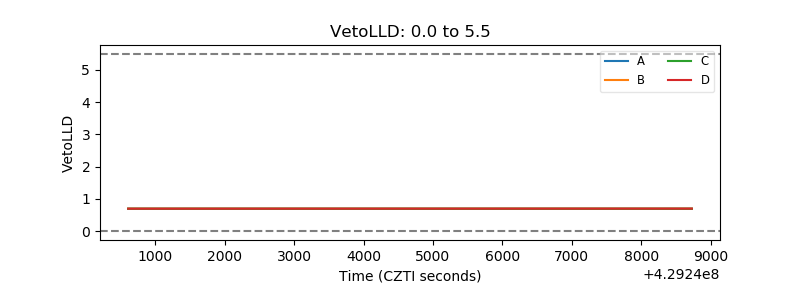 |
| Alpha Counter | 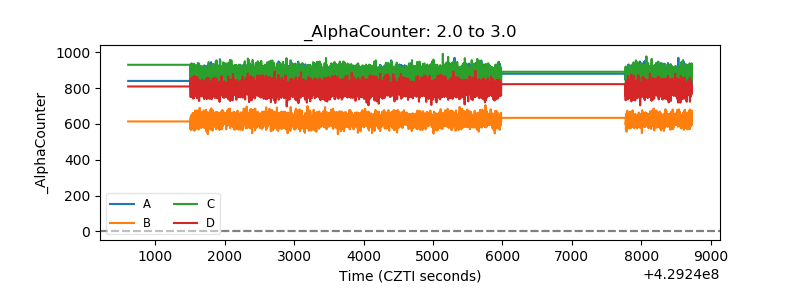 |
| _CPM_Rate | 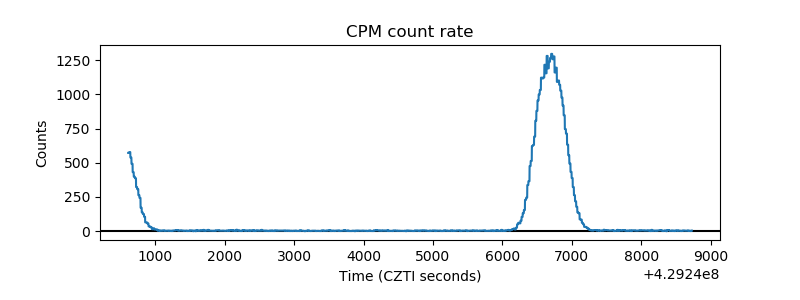 |
| CZT Counter | 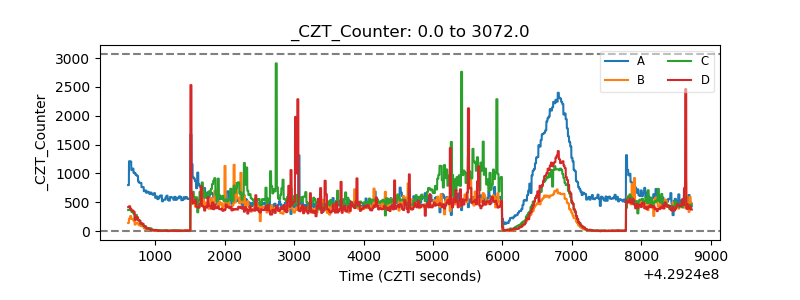 |
| +2.5 Volts monitor | 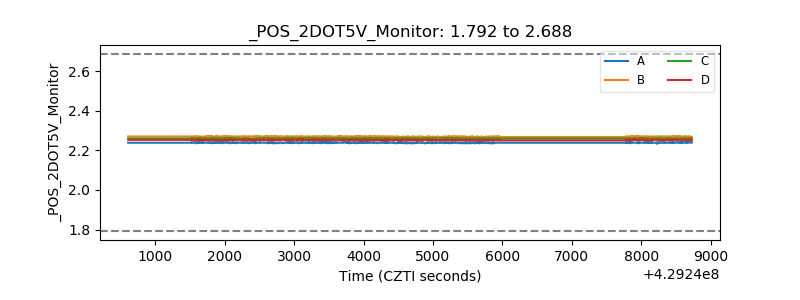 |
| +5 Volts monitor | 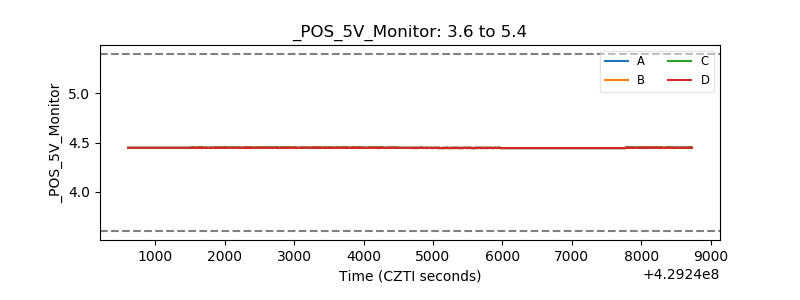 |
| _ROLL_ROT | 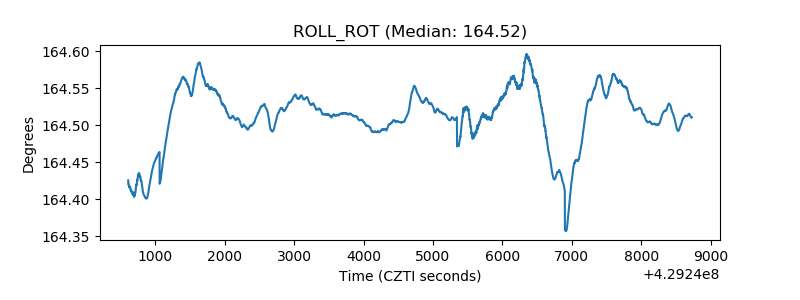 |
| _Roll_DEC | 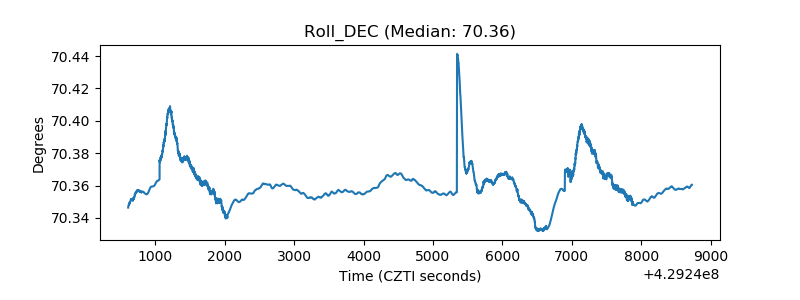 |
| _Roll_RA |  |
| Veto Counter | 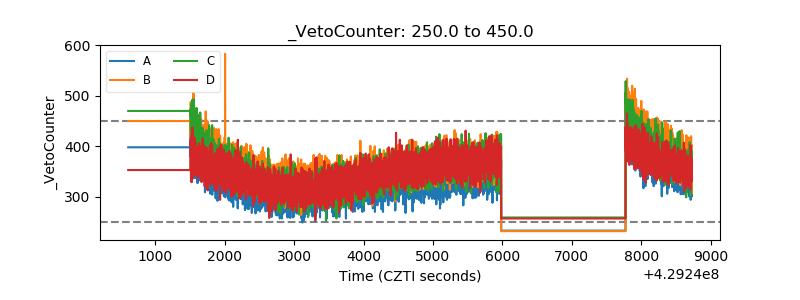 |