| Param | Original file | Final file |
|---|---|---|
| Filename | modeM0/AS1C07_001T10_9000005806_42516cztM0_level2.fits | modeM0/AS1C07_001T10_9000005806_42516cztM0_level2_quad_clean.evt |
| Size (bytes) | 300,205,440 | 87,491,520 |
| Size | 286.3 MB | 83.4 MB |
| Events in quadrant A | 2,909,178 | 591,838 |
| Events in quadrant B | 2,496,608 | 602,089 |
| Events in quadrant C | 2,405,566 | 574,476 |
| Events in quadrant D | 2,899,385 | 520,064 |
| Mode M9 | |||
|---|---|---|---|
| Quadrant | BADHDUFLAG | Total packets | Discarded packets |
| A | 0 | 31 | 0 |
| B | 0 | 32 | 0 |
| C | 0 | 32 | 0 |
| D | 0 | 32 | 0 |
| Mode SS | |||
|---|---|---|---|
| Quadrant | BADHDUFLAG | Total packets | Discarded packets |
| A | 0 | 104 | 0 |
| B | 0 | 104 | 0 |
| C | 0 | 104 | 0 |
| D | 0 | 104 | 0 |
| Mode M0 | |||
|---|---|---|---|
| Quadrant | BADHDUFLAG | Total packets | Discarded packets |
| A | 0 | 11830 | 2 |
| B | 0 | 10864 | 2 |
| C | 0 | 10430 | 3 |
| D | 0 | 12292 | 2 |
| Quadrant | Total seconds | Saturated seconds | Saturation percentage |
|---|---|---|---|
| A | 5153 | 15 | 0.291093% |
| B | 5153 | 11 | 0.213468% |
| C | 5152 | 4 | 0.077640% |
| D | 5152 | 181 | 3.513199% |
Noise dominated data is calculated using 1-second bins in cleaned event files. If a bin has >2000 counts, and if more than 50% of those come from <1% of pixels, then it is considered to be noise-dominated and hence unusable.
| Quadrant | # 1 sec bins | Bins with >0 counts | Bins with >2000 counts | High rate bins dominated by noise | Noise dominated (total time) | Noise dominated (detector-on time) | Marked lightcurve |
|---|---|---|---|---|---|---|---|
| A | 7095 | 5154 | 6 | 6 | 0.08% | 0.12% | 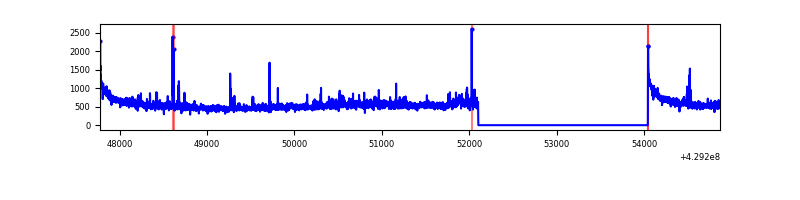 |
| B | 7095 | 5154 | 3 | 3 | 0.04% | 0.06% | 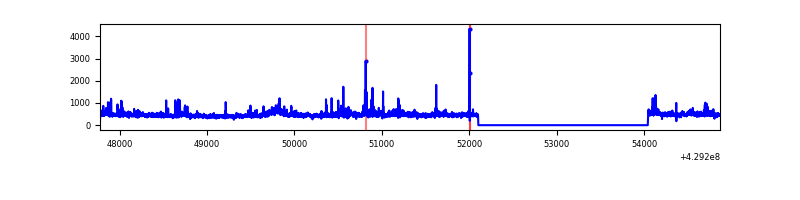 |
| C | 7094 | 5153 | 0 | 0 | 0.00% | 0.00% | 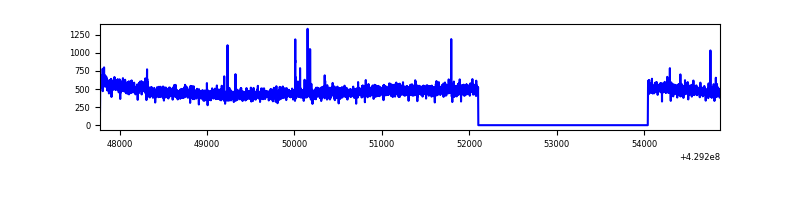 |
| D | 7094 | 5153 | 149 | 149 | 2.10% | 2.89% | 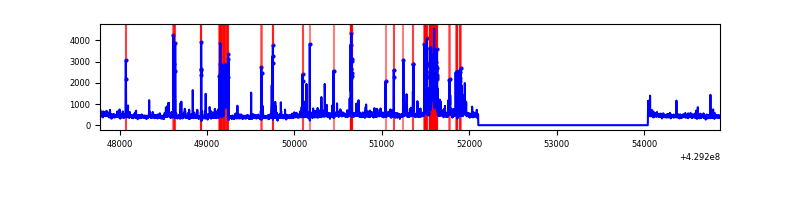 |
Top three noisy pixels from each quadrant. If the there are fewer than three noisy pixels in the level2.evt file, extra rows are filled as -1
| Pixel properties | Quadrant properties | ||||||
|---|---|---|---|---|---|---|---|
| Quadrant | DetID | PixID | Counts | Sigma | Mean | Median | Sigma |
| A | 10 | 83 | 546575 | 4723.65 | 566 | 555 | 115.6 |
| A | 12 | 189 | 89766 | 771.77 | 566 | 555 | 115.6 |
| A | 2 | 79 | 51508 | 440.8 | 566 | 555 | 115.6 |
| B | 0 | 229 | 160353 | 1494.3 | 560 | 545 | 106.9 |
| B | 0 | 245 | 62144 | 575.99 | 560 | 545 | 106.9 |
| B | 5 | 255 | 44640 | 412.31 | 560 | 545 | 106.9 |
| C | 15 | 214 | 234888 | 1863.65 | 544 | 549 | 125.7 |
| C | 0 | 239 | 32211 | 251.8 | 544 | 549 | 125.7 |
| C | 12 | 249 | 14499 | 110.94 | 544 | 549 | 125.7 |
| D | 1 | 47 | 297889 | 2263.06 | 540 | 523 | 131.4 |
| D | 13 | 249 | 90904 | 687.83 | 540 | 523 | 131.4 |
| D | 12 | 6 | 88022 | 665.9 | 540 | 523 | 131.4 |
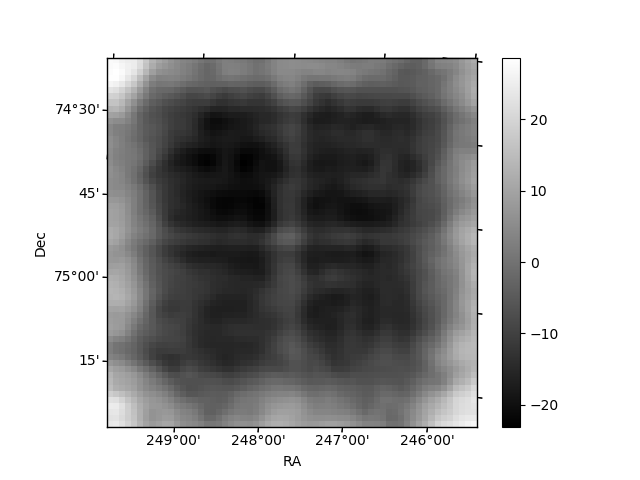
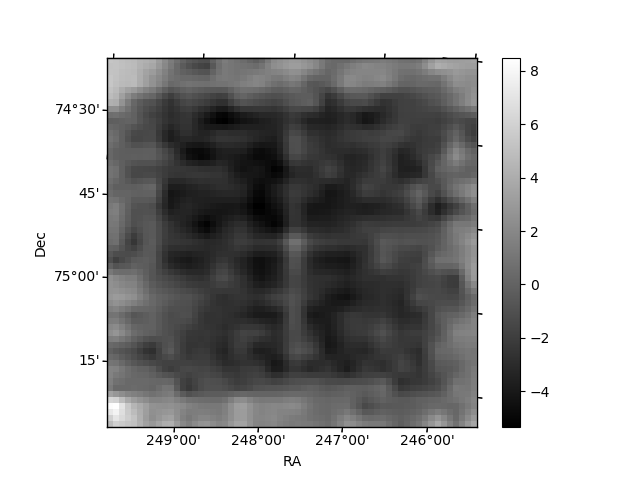
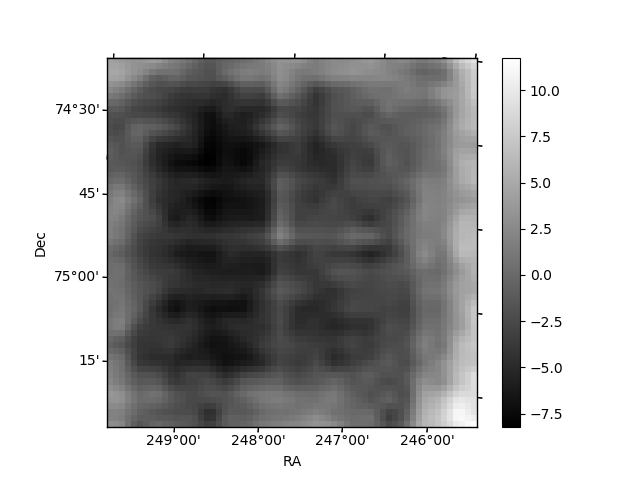
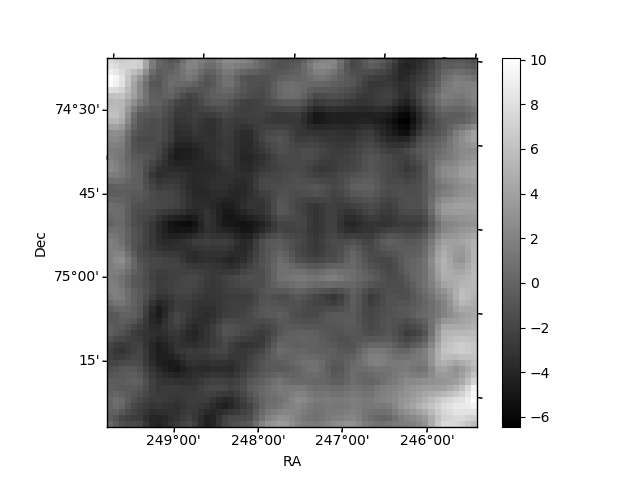
Histogram calculated using DETX and DETY for each event in the final _common_clean file
| Quadrant A | 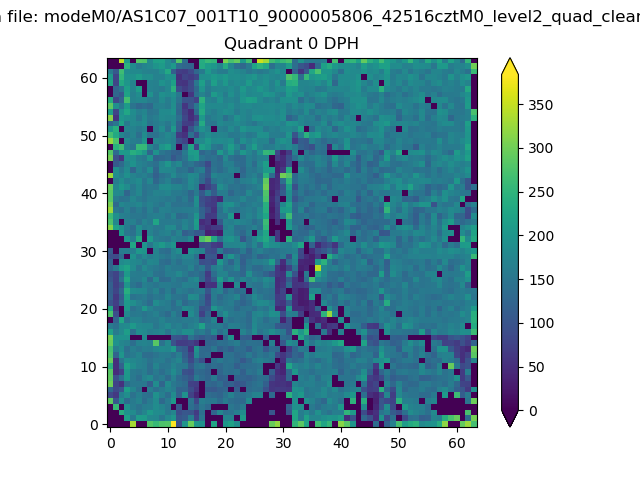 |
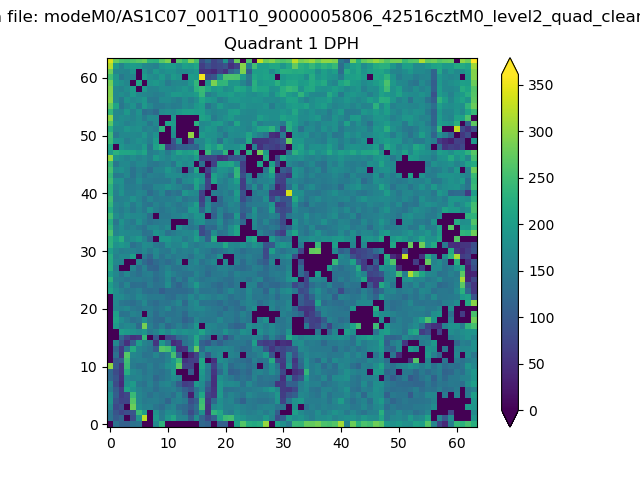 |
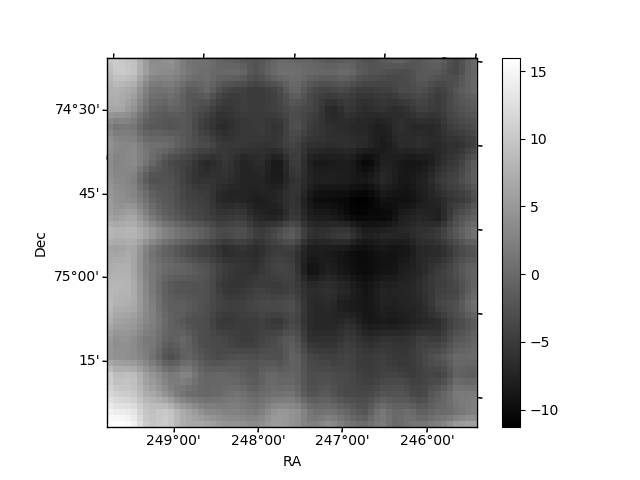
Quadrant B |
|---|---|---|---|
| Quadrant D | 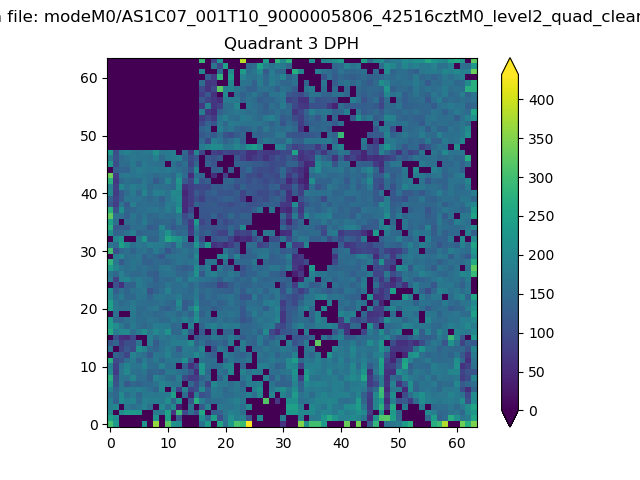 |
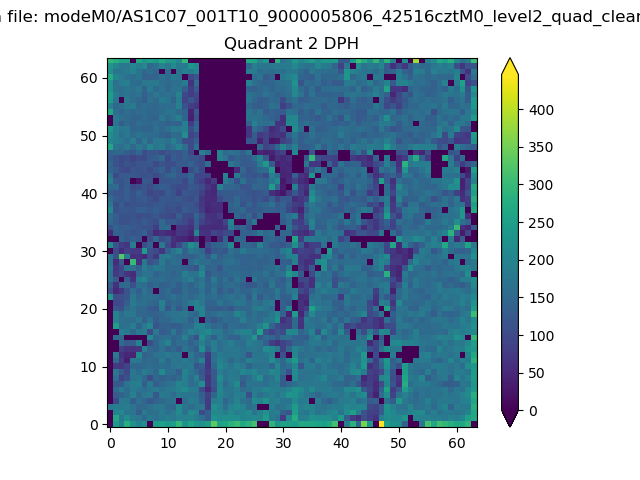 |
Quadrant C |
| Plot type | Count rate plots | Images |
|---|---|---|
| Comparison with Poisson distribution Blue bars denote a histogram of data divided into 1 sec bins. Red curve is a Poisson curve with rate = median count rate of data. |
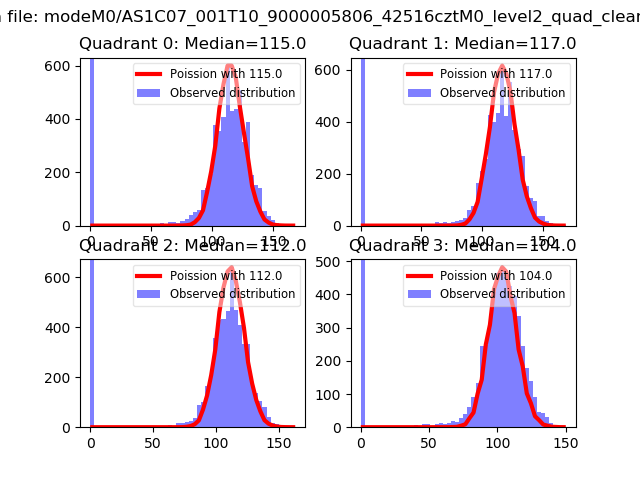 |
 |
| Quadrant-wise count rates Data is divided into 100 sec bins |
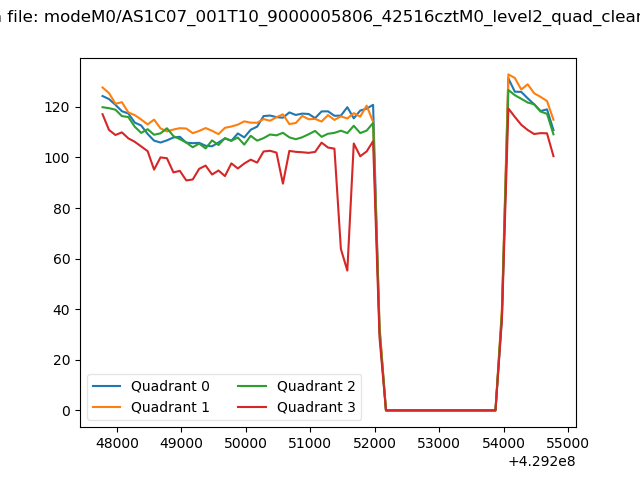 |
|
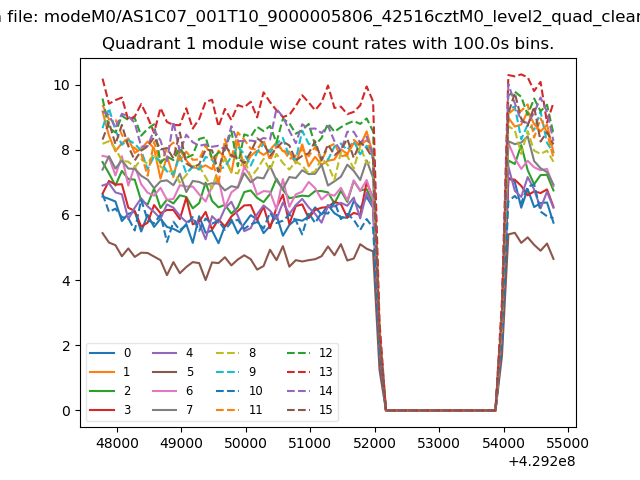
| Module-wise count rates for Quadrant A Data is divided into 100 sec bins |
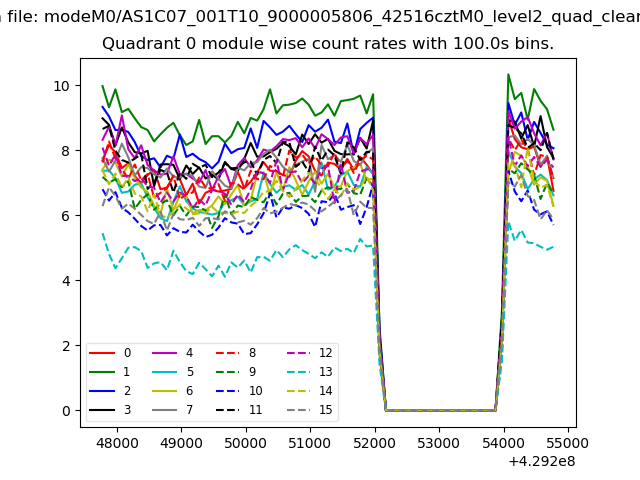 |
 |
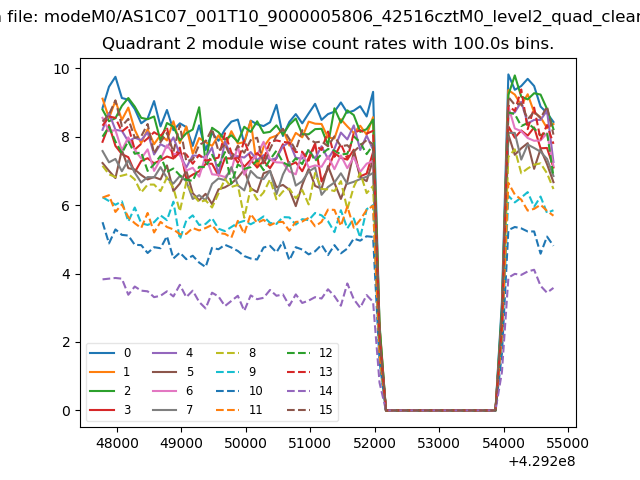
| Module-wise count rates for Quadrant B Data is divided into 100 sec bins |
 |
 |
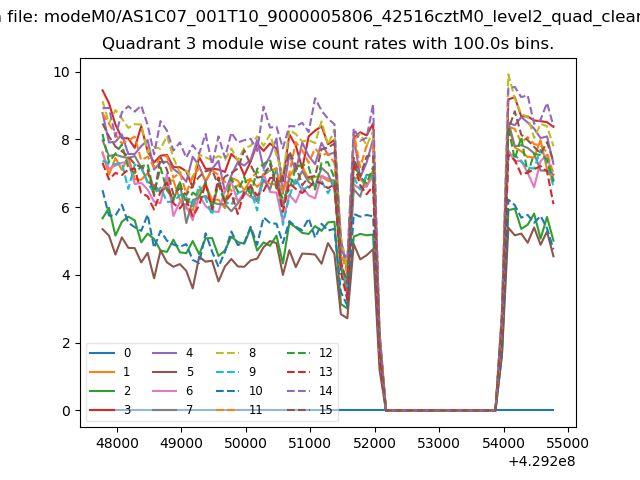
| Module-wise count rates for Quadrant C Data is divided into 100 sec bins |
 |
 |
| Module-wise count rates for Quadrant D Data is divided into 100 sec bins |
 |
 |
| Parameter | Plot |
|---|---|
| CZT HV Monitor | 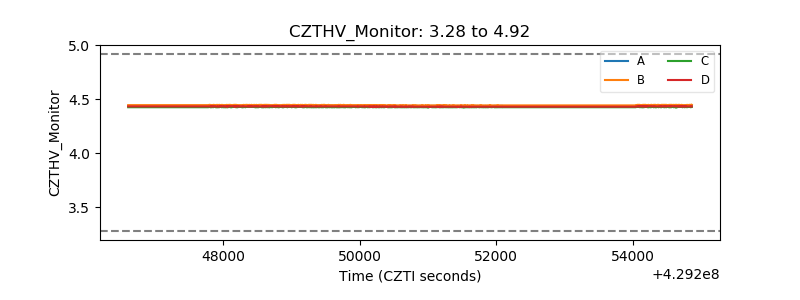 |
| D_VDD |  |
| Temperature 1 | 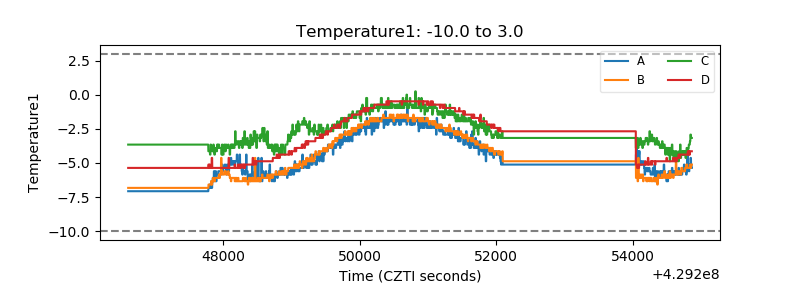 |
| Veto HV Monitor | 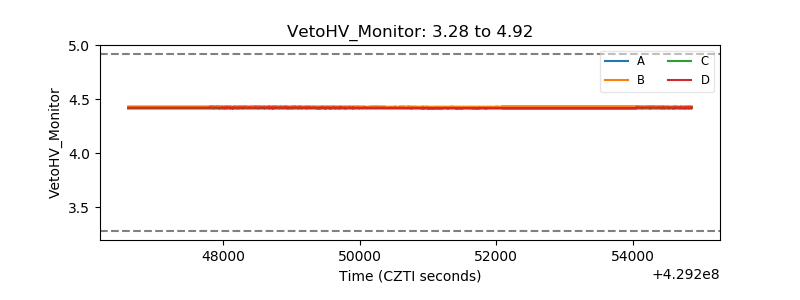 |
| Veto LLD | 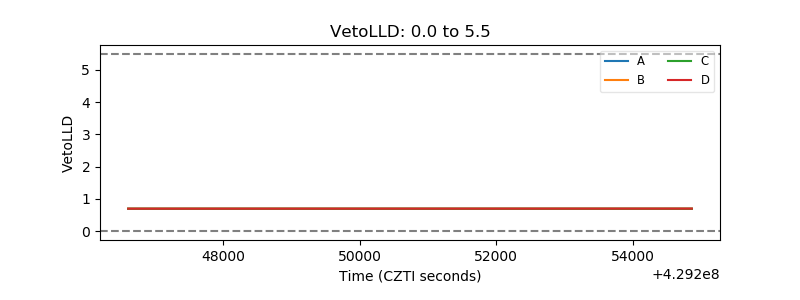 |
| Alpha Counter | 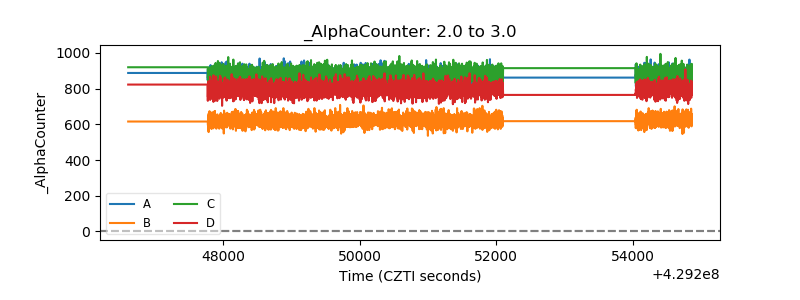 |
| _CPM_Rate | 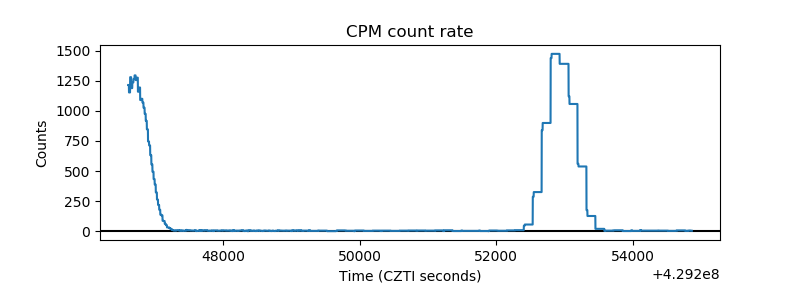 |
| CZT Counter | 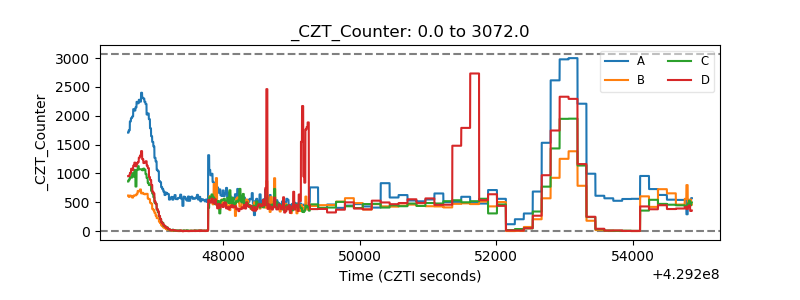 |
| +2.5 Volts monitor |  |
| +5 Volts monitor |  |
| _ROLL_ROT | 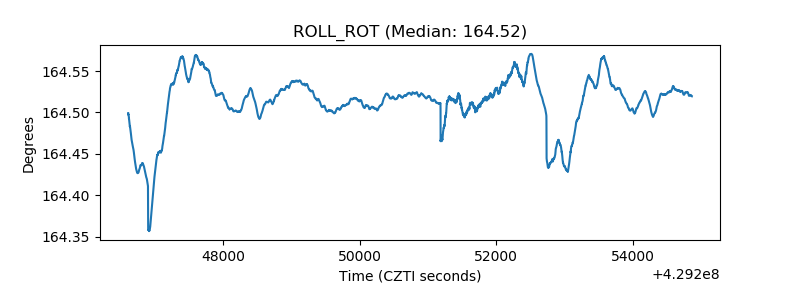 |
| _Roll_DEC | 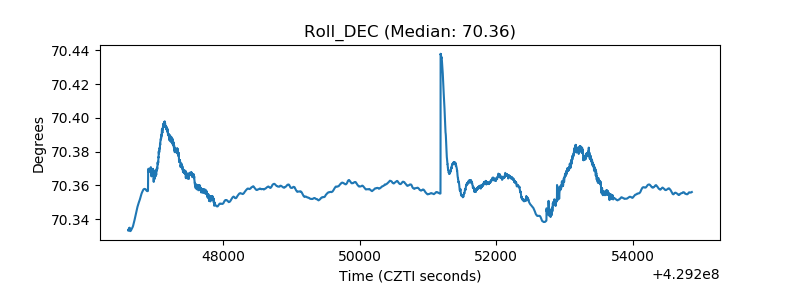 |
| _Roll_RA | 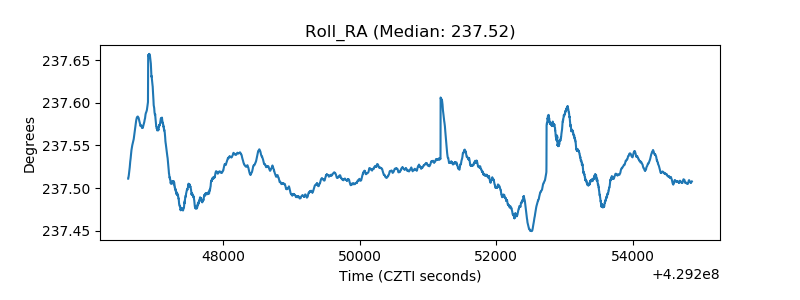 |
| Veto Counter | 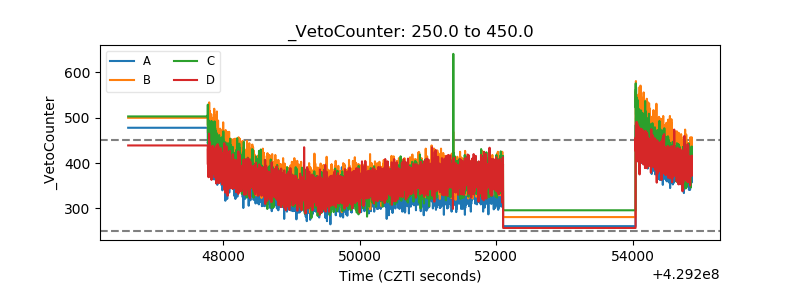 |