| Param | Original file | Final file |
|---|---|---|
| Filename | modeM0/AS1C07_001T10_9000005806_42517cztM0_level2.fits | modeM0/AS1C07_001T10_9000005806_42517cztM0_level2_quad_clean.evt |
| Size (bytes) | 301,723,200 | 88,632,000 |
| Size | 287.7 MB | 84.5 MB |
| Events in quadrant A | 2,885,752 | 607,636 |
| Events in quadrant B | 2,471,959 | 614,831 |
| Events in quadrant C | 2,367,286 | 579,917 |
| Events in quadrant D | 3,050,181 | 527,459 |
| Mode M9 | |||
|---|---|---|---|
| Quadrant | BADHDUFLAG | Total packets | Discarded packets |
| A | 0 | 21 | 0 |
| B | 0 | 22 | 0 |
| C | 0 | 22 | 0 |
| D | 0 | 22 | 0 |
| Mode SS | |||
|---|---|---|---|
| Quadrant | BADHDUFLAG | Total packets | Discarded packets |
| A | 0 | 104 | 0 |
| B | 0 | 104 | 0 |
| C | 0 | 104 | 0 |
| D | 0 | 104 | 0 |
| Mode M0 | |||
|---|---|---|---|
| Quadrant | BADHDUFLAG | Total packets | Discarded packets |
| A | 0 | 11535 | 2 |
| B | 0 | 10759 | 2 |
| C | 0 | 10139 | 2 |
| D | 0 | 12524 | 2 |
| Quadrant | Total seconds | Saturated seconds | Saturation percentage |
|---|---|---|---|
| A | 5047 | 16 | 0.317020% |
| B | 5047 | 26 | 0.515158% |
| C | 5047 | 6 | 0.118883% |
| D | 5047 | 151 | 2.991876% |
Noise dominated data is calculated using 1-second bins in cleaned event files. If a bin has >2000 counts, and if more than 50% of those come from <1% of pixels, then it is considered to be noise-dominated and hence unusable.
| Quadrant | # 1 sec bins | Bins with >0 counts | Bins with >2000 counts | High rate bins dominated by noise | Noise dominated (total time) | Noise dominated (detector-on time) | Marked lightcurve |
|---|---|---|---|---|---|---|---|
| A | 7078 | 5048 | 4 | 4 | 0.06% | 0.08% | 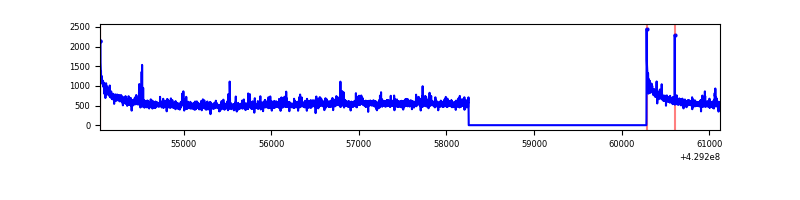 |
| B | 7078 | 5048 | 21 | 21 | 0.30% | 0.42% | 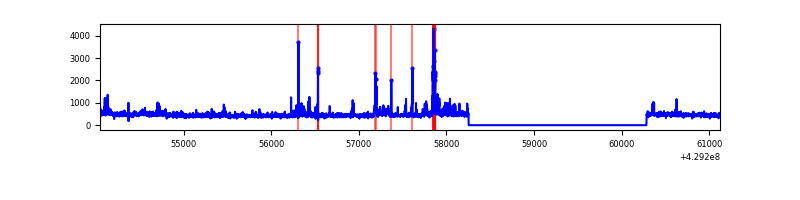 |
| C | 7078 | 5048 | 0 | 0 | 0.00% | 0.00% | 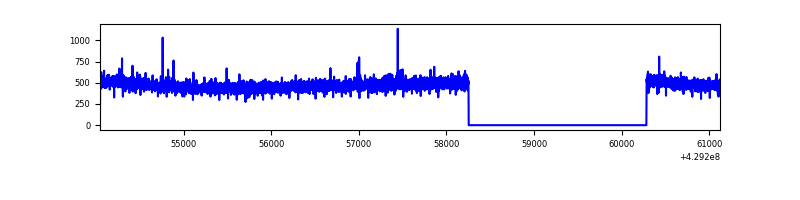 |
| D | 7078 | 5048 | 121 | 121 | 1.71% | 2.40% | 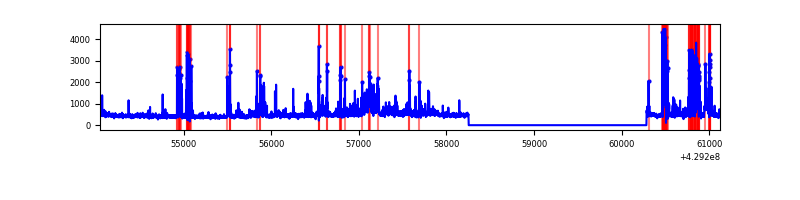 |
Top three noisy pixels from each quadrant. If the there are fewer than three noisy pixels in the level2.evt file, extra rows are filled as -1
| Pixel properties | Quadrant properties | ||||||
|---|---|---|---|---|---|---|---|
| Quadrant | DetID | PixID | Counts | Sigma | Mean | Median | Sigma |
| A | 10 | 83 | 555103 | 4775.33 | 570 | 559 | 116.1 |
| A | 12 | 189 | 75337 | 643.93 | 570 | 559 | 116.1 |
| A | 13 | 248 | 21654 | 181.65 | 570 | 559 | 116.1 |
| B | 5 | 255 | 170242 | 1591.36 | 560 | 544 | 106.6 |
| B | 0 | 229 | 79707 | 742.36 | 560 | 544 | 106.6 |
| B | 5 | 172 | 13649 | 122.89 | 560 | 544 | 106.6 |
| C | 15 | 214 | 231928 | 1840.52 | 544 | 546 | 125.7 |
| C | 12 | 249 | 4003 | 27.5 | 544 | 546 | 125.7 |
| C | 13 | 61 | 3725 | 25.29 | 544 | 546 | 125.7 |
| D | 12 | 233 | 269191 | 2028.29 | 545 | 528 | 132.5 |
| D | 13 | 249 | 220925 | 1663.9 | 545 | 528 | 132.5 |
| D | 12 | 6 | 187955 | 1414.99 | 545 | 528 | 132.5 |
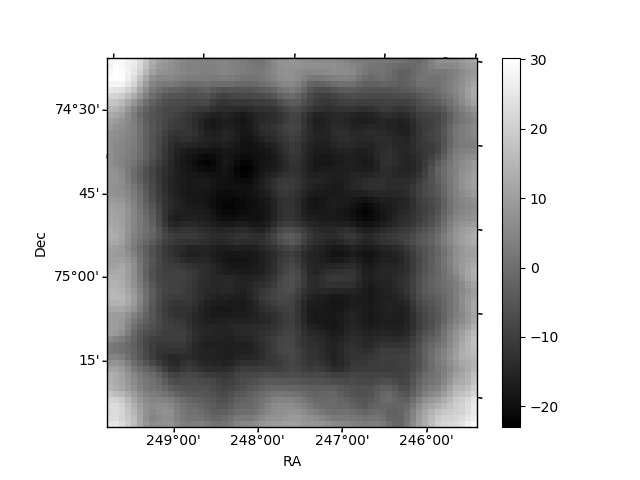
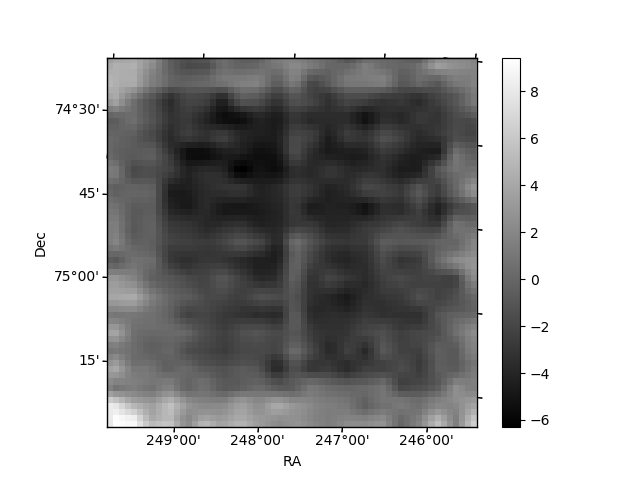
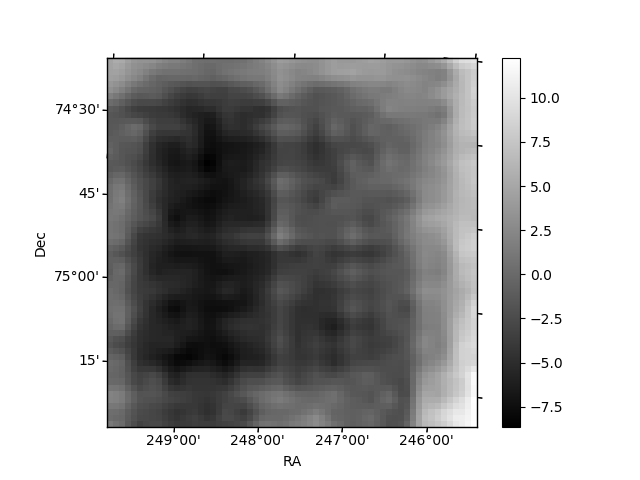
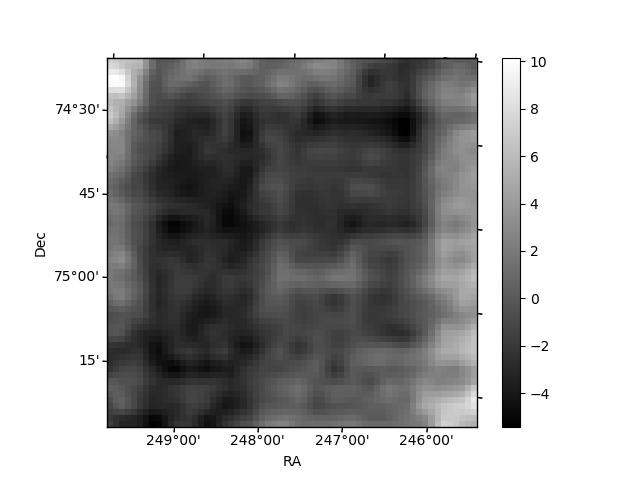
Histogram calculated using DETX and DETY for each event in the final _common_clean file
| Quadrant A | 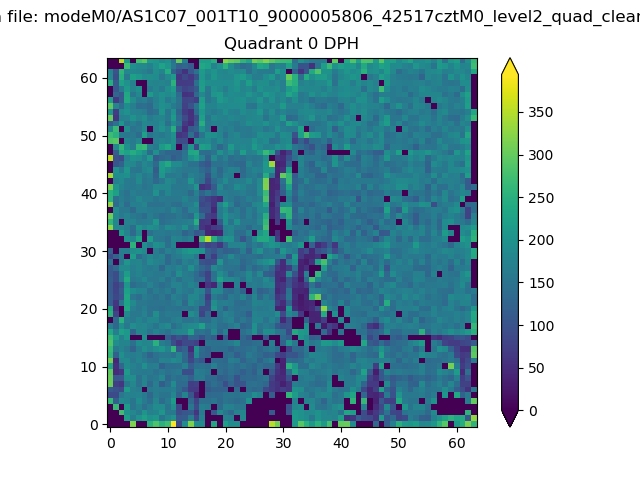 |
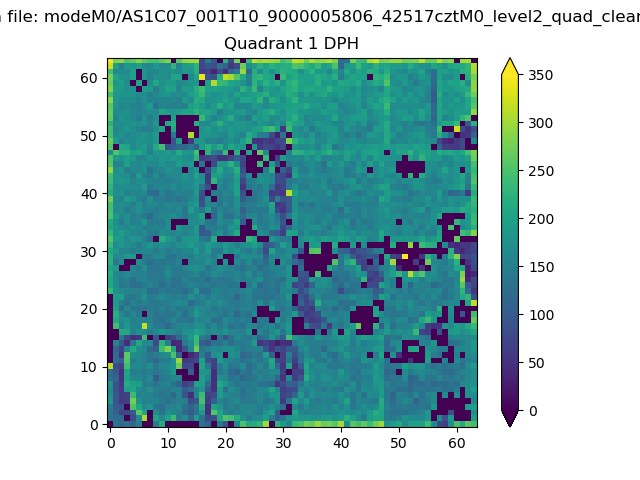 |
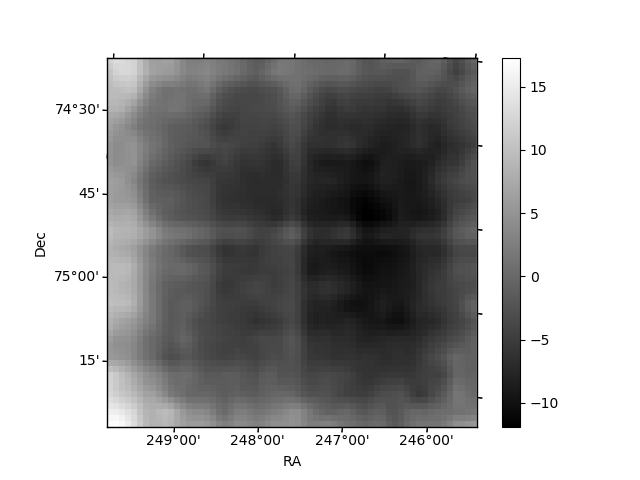
Quadrant B |
|---|---|---|---|
| Quadrant D | 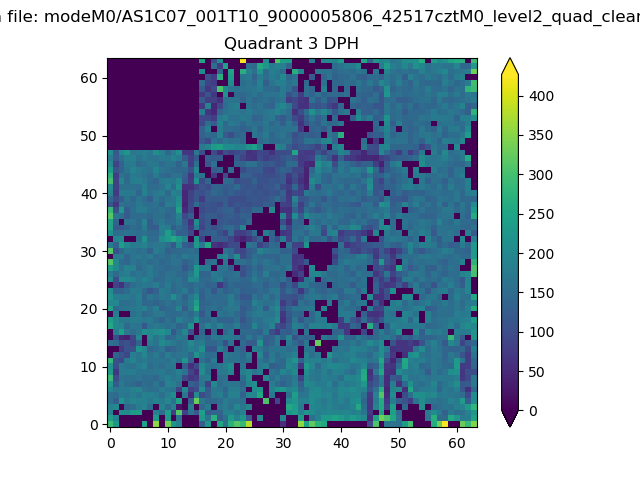 |
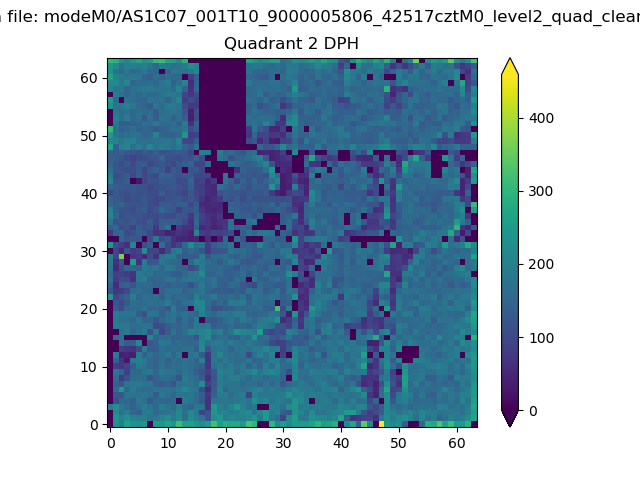 |
Quadrant C |
| Plot type | Count rate plots | Images |
|---|---|---|
| Comparison with Poisson distribution Blue bars denote a histogram of data divided into 1 sec bins. Red curve is a Poisson curve with rate = median count rate of data. |
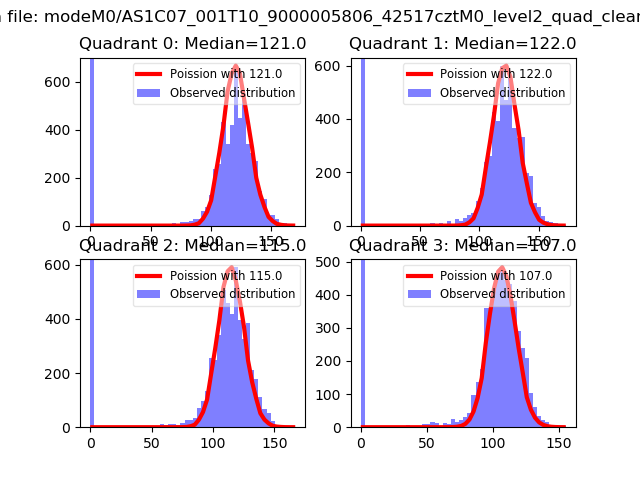 |
 |
| Quadrant-wise count rates Data is divided into 100 sec bins |
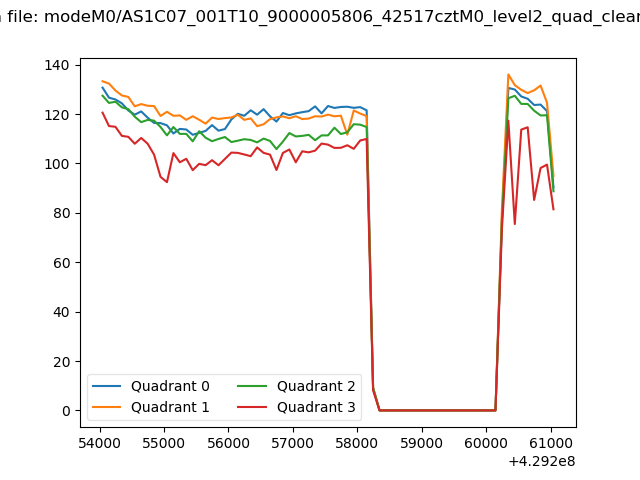 |
|
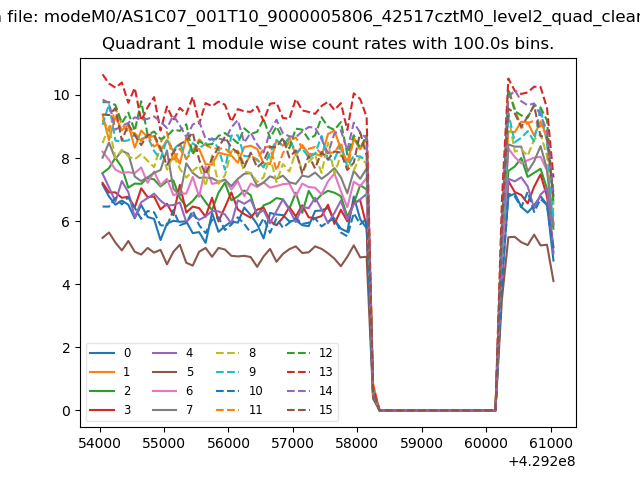
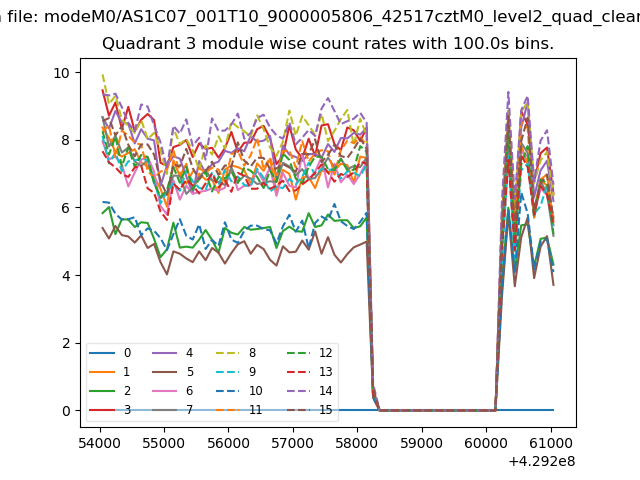
| Module-wise count rates for Quadrant A Data is divided into 100 sec bins |
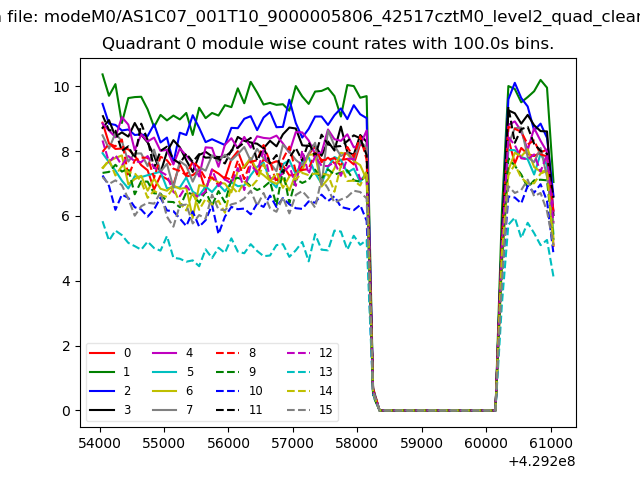 |
 |
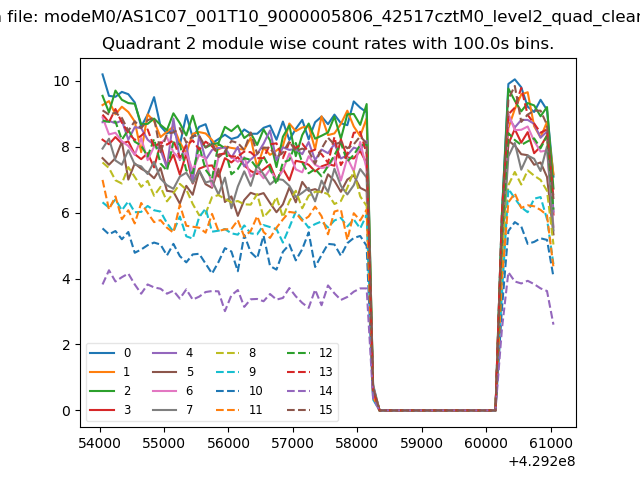
| Module-wise count rates for Quadrant B Data is divided into 100 sec bins |
 |
 |
| Module-wise count rates for Quadrant C Data is divided into 100 sec bins |
 |
 |
| Module-wise count rates for Quadrant D Data is divided into 100 sec bins |
 |
 |
| Parameter | Plot |
|---|---|
| CZT HV Monitor | 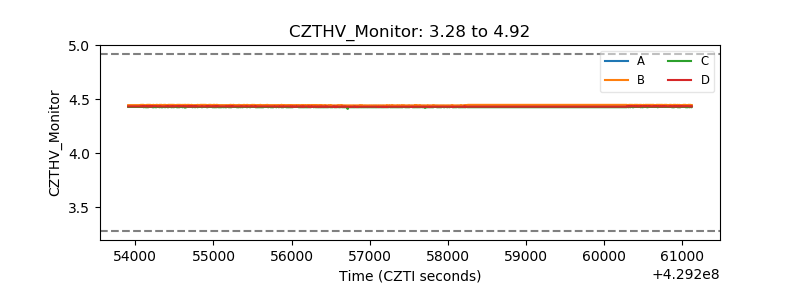 |
| D_VDD | 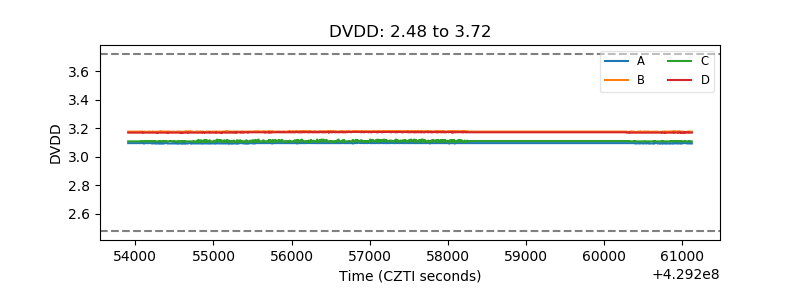 |
| Temperature 1 | 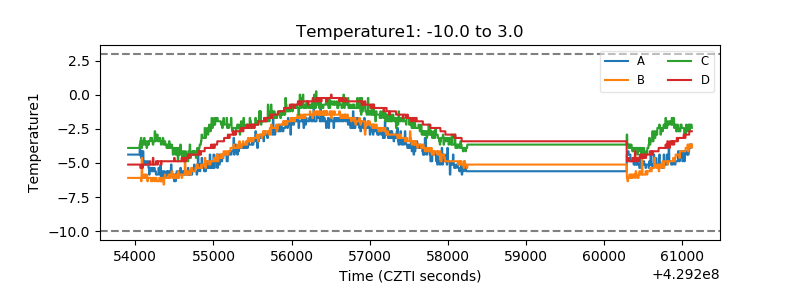 |
| Veto HV Monitor | 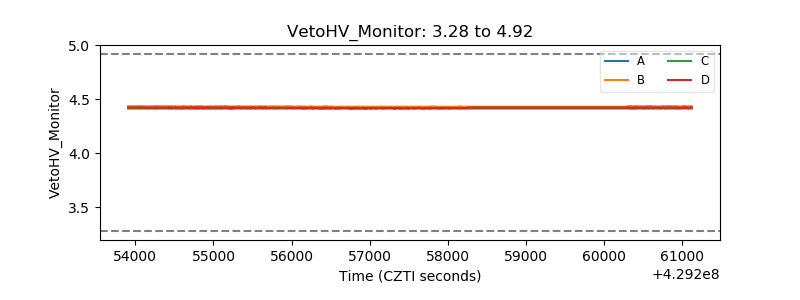 |
| Veto LLD | 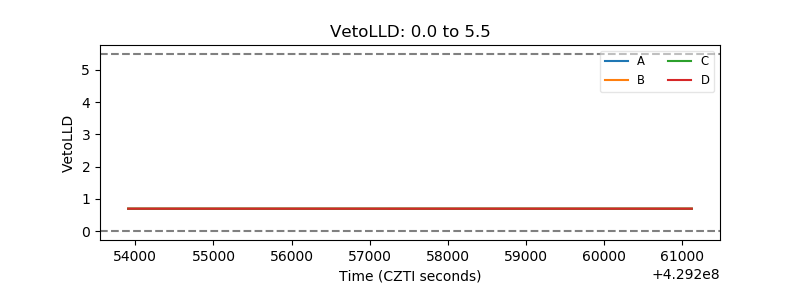 |
| Alpha Counter | 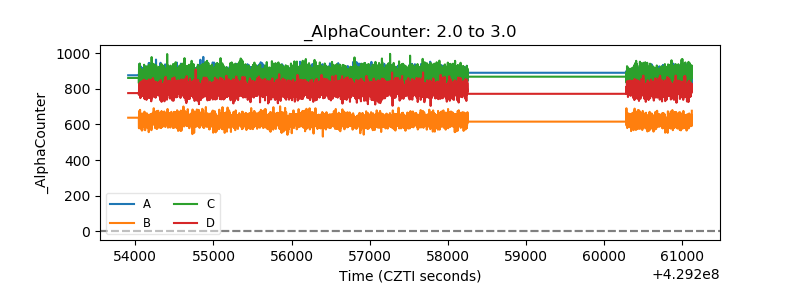 |
| _CPM_Rate | 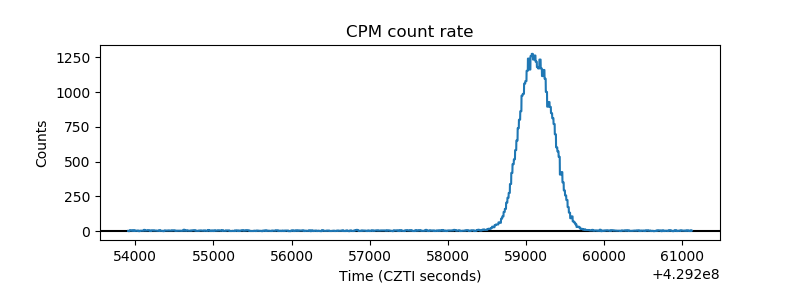 |
| CZT Counter | 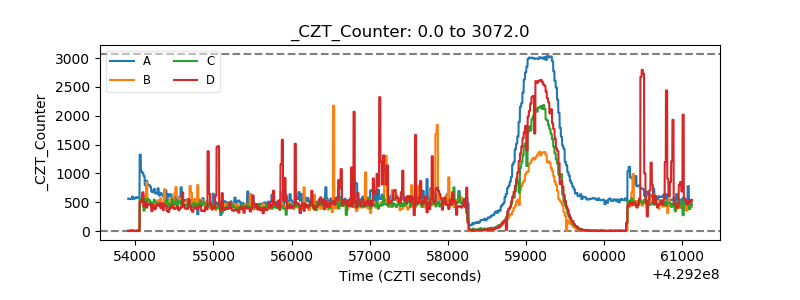 |
| +2.5 Volts monitor | 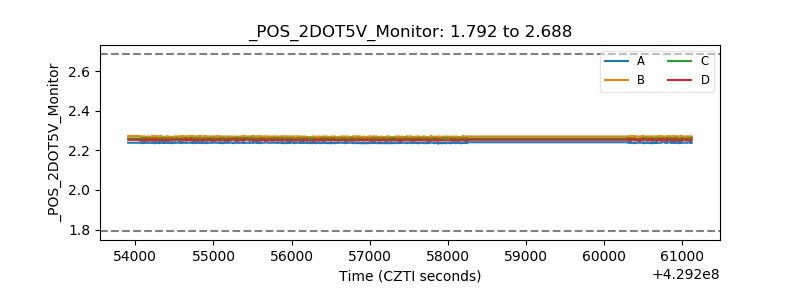 |
| +5 Volts monitor | 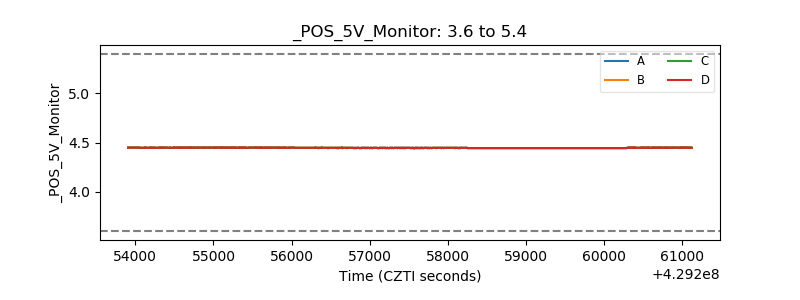 |
| _ROLL_ROT | 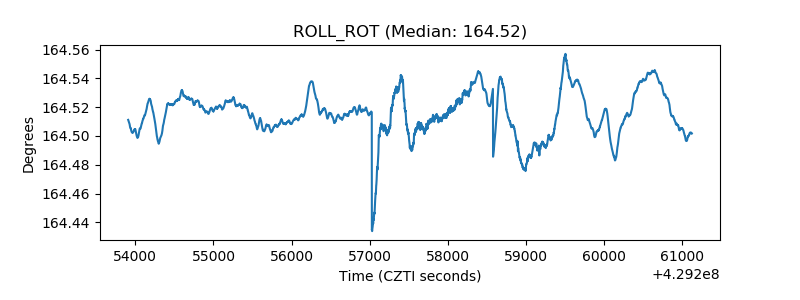 |
| _Roll_DEC | 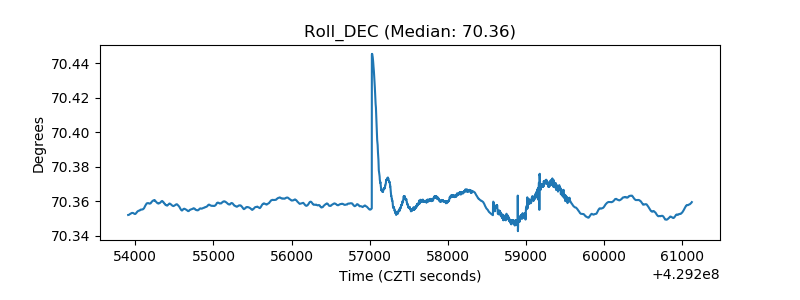 |
| _Roll_RA | 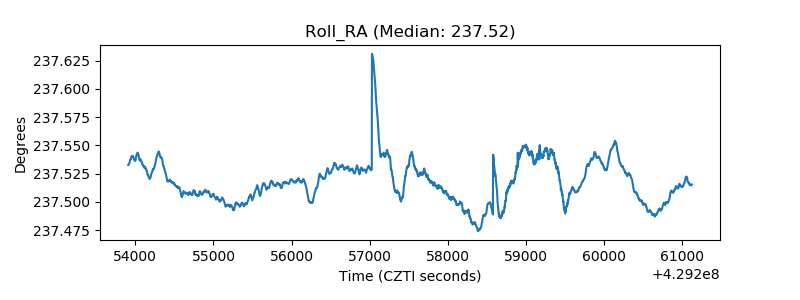 |
| Veto Counter | 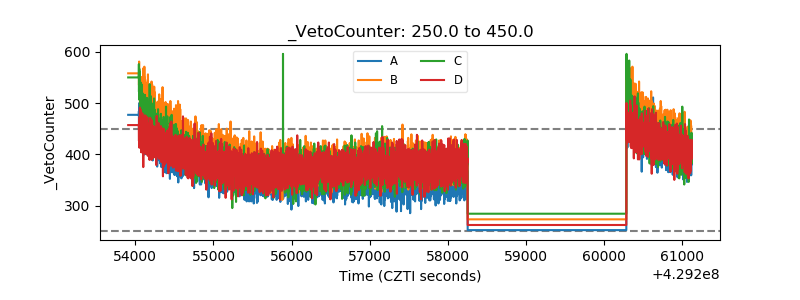 |