| Param | Original file | Final file |
|---|---|---|
| Filename | modeM0/AS1A07_041T01_9000005808_42519cztM0_level2.fits | modeM0/AS1A07_041T01_9000005808_42519cztM0_level2_quad_clean.evt |
| Size (bytes) | 282,579,840 | 86,031,360 |
| Size | 269.5 MB | 82.0 MB |
| Events in quadrant A | 2,722,584 | 576,743 |
| Events in quadrant B | 2,321,452 | 590,505 |
| Events in quadrant C | 2,605,461 | 568,029 |
| Events in quadrant D | 2,424,700 | 523,238 |
| Mode M0 | |||
|---|---|---|---|
| Quadrant | BADHDUFLAG | Total packets | Discarded packets |
| A | 0 | 10992 | 2 |
| B | 0 | 10284 | 2 |
| C | 0 | 10712 | 2 |
| D | 0 | 10788 | 2 |
| Mode SS | |||
|---|---|---|---|
| Quadrant | BADHDUFLAG | Total packets | Discarded packets |
| A | 0 | 102 | 0 |
| B | 0 | 102 | 0 |
| C | 0 | 102 | 0 |
| D | 0 | 102 | 0 |
| Mode M9 | |||
|---|---|---|---|
| Quadrant | BADHDUFLAG | Total packets | Discarded packets |
| A | 0 | 43 | 0 |
| B | 0 | 43 | 0 |
| C | 0 | 43 | 0 |
| D | 0 | 43 | 0 |
| Quadrant | Total seconds | Saturated seconds | Saturation percentage |
|---|---|---|---|
| A | 4945 | 10 | 0.202224% |
| B | 4945 | 31 | 0.626896% |
| C | 4945 | 69 | 1.395349% |
| D | 4945 | 64 | 1.294237% |
Noise dominated data is calculated using 1-second bins in cleaned event files. If a bin has >2000 counts, and if more than 50% of those come from <1% of pixels, then it is considered to be noise-dominated and hence unusable.
| Quadrant | # 1 sec bins | Bins with >0 counts | Bins with >2000 counts | High rate bins dominated by noise | Noise dominated (total time) | Noise dominated (detector-on time) | Marked lightcurve |
|---|---|---|---|---|---|---|---|
| A | 9189 | 4947 | 1 | 1 | 0.01% | 0.02% | 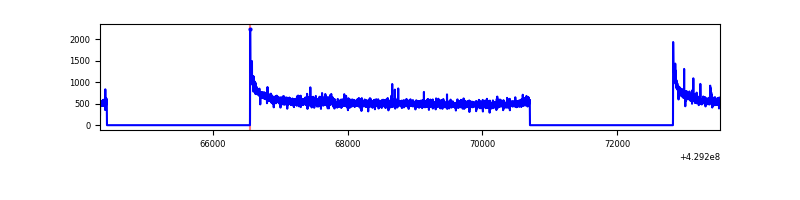 |
| B | 9189 | 4947 | 17 | 17 | 0.19% | 0.34% | 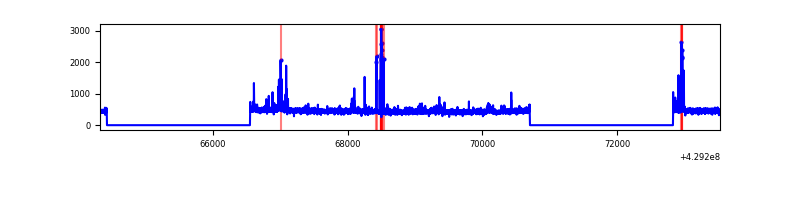 |
| C | 9189 | 4947 | 70 | 70 | 0.76% | 1.41% | 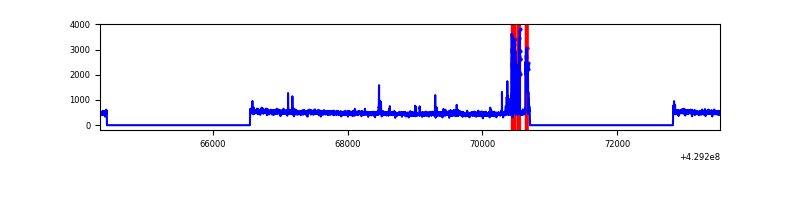 |
| D | 9189 | 4947 | 38 | 38 | 0.41% | 0.77% | 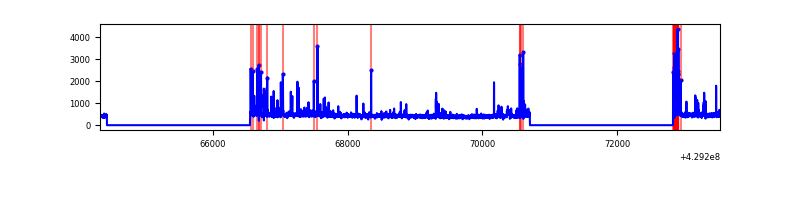 |
Top three noisy pixels from each quadrant. If the there are fewer than three noisy pixels in the level2.evt file, extra rows are filled as -1
| Pixel properties | Quadrant properties | ||||||
|---|---|---|---|---|---|---|---|
| Quadrant | DetID | PixID | Counts | Sigma | Mean | Median | Sigma |
| A | 10 | 83 | 512863 | 4541.06 | 554 | 544 | 112.8 |
| A | 12 | 189 | 39095 | 341.71 | 554 | 544 | 112.8 |
| A | 13 | 248 | 8623 | 71.61 | 554 | 544 | 112.8 |
| B | 0 | 245 | 111055 | 1036.4 | 549 | 533 | 106.6 |
| B | 5 | 255 | 32562 | 300.35 | 549 | 533 | 106.6 |
| B | 5 | 252 | 14064 | 126.88 | 549 | 533 | 106.6 |
| C | 0 | 239 | 273654 | 2193.24 | 539 | 543 | 124.5 |
| C | 15 | 214 | 224163 | 1795.8 | 539 | 543 | 124.5 |
| C | 14 | 254 | 3596 | 24.52 | 539 | 543 | 124.5 |
| D | 12 | 6 | 154816 | 1181.29 | 539 | 523 | 130.6 |
| D | 13 | 249 | 72730 | 552.83 | 539 | 523 | 130.6 |
| D | 2 | 249 | 34076 | 256.89 | 539 | 523 | 130.6 |
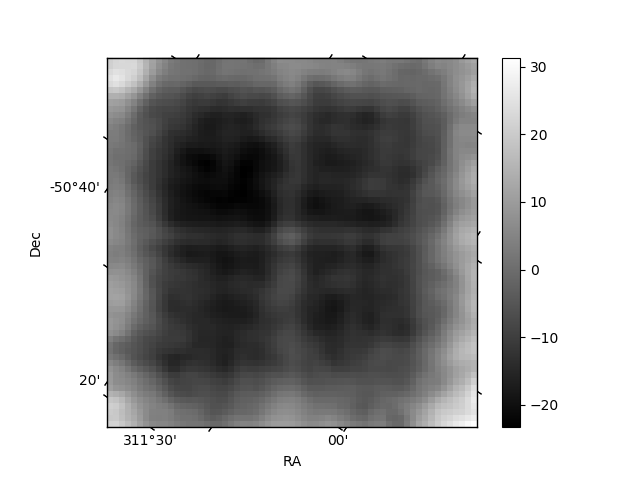
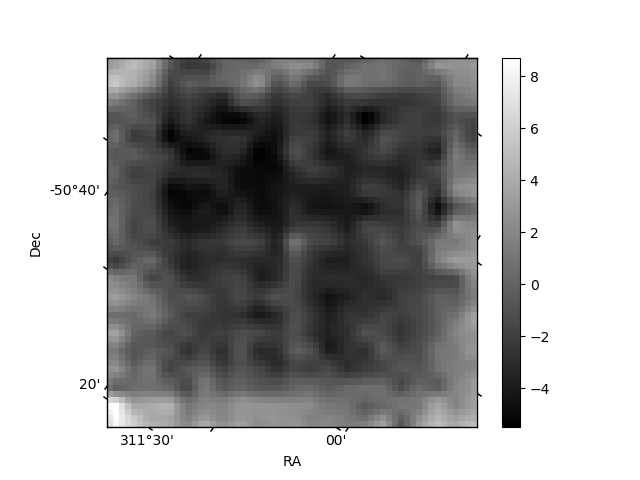
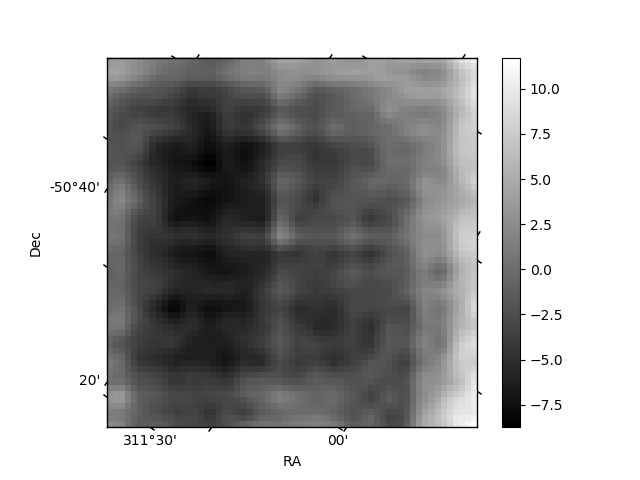
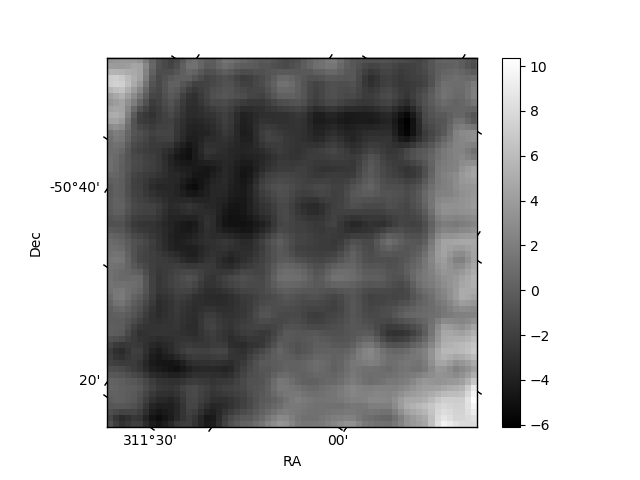
Histogram calculated using DETX and DETY for each event in the final _common_clean file
| Quadrant A | 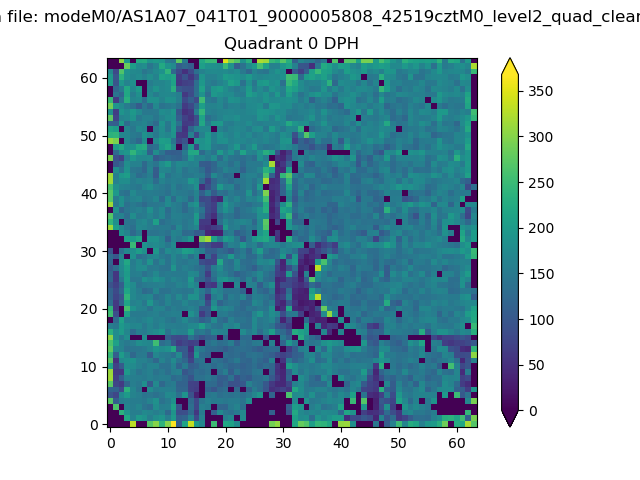 |
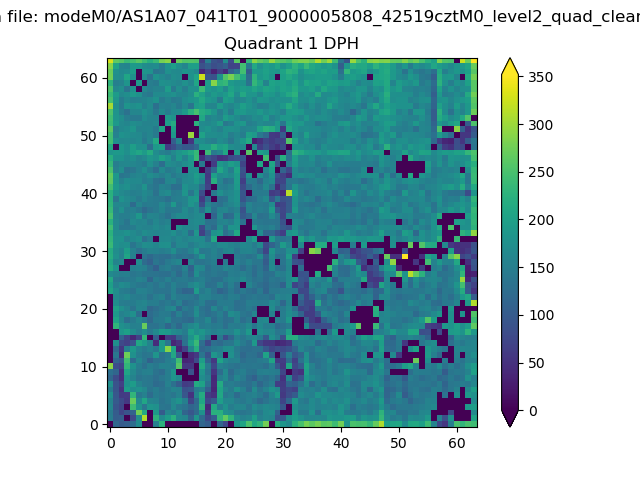 |
Quadrant B |
|---|---|---|---|
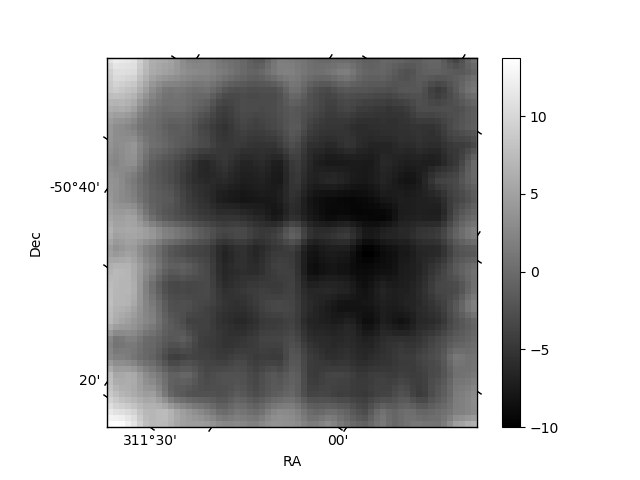
| Quadrant D | 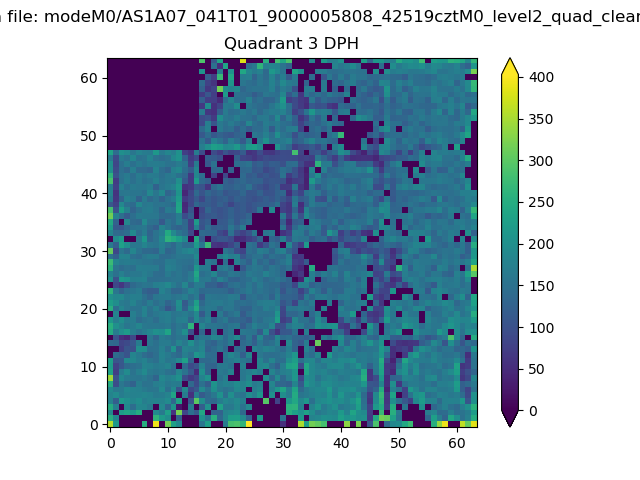 |
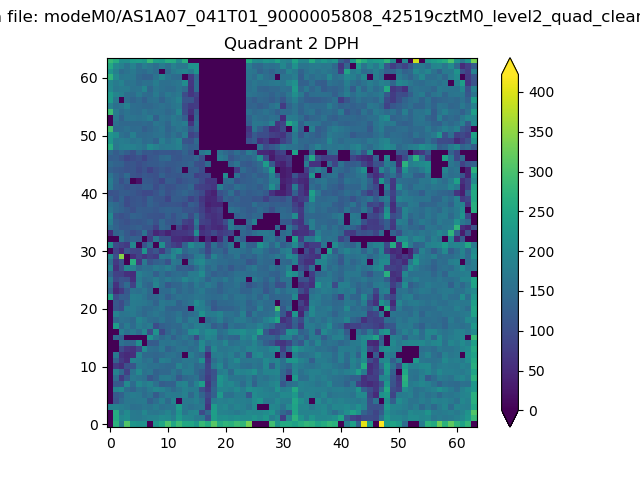 |
Quadrant C |
| Plot type | Count rate plots | Images |
|---|---|---|
| Comparison with Poisson distribution Blue bars denote a histogram of data divided into 1 sec bins. Red curve is a Poisson curve with rate = median count rate of data. |
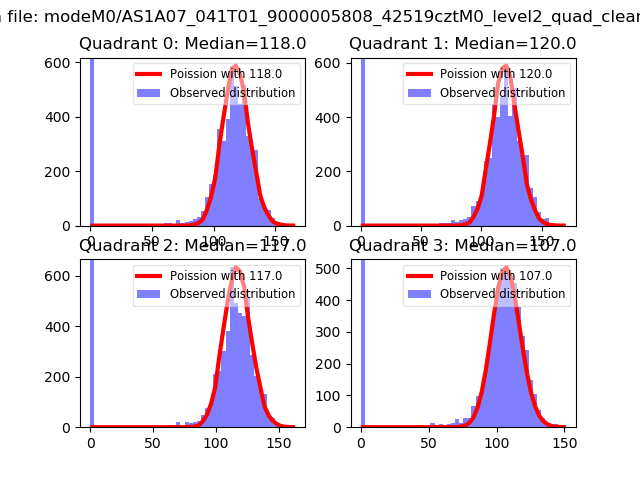 |
 |
| Quadrant-wise count rates Data is divided into 100 sec bins |
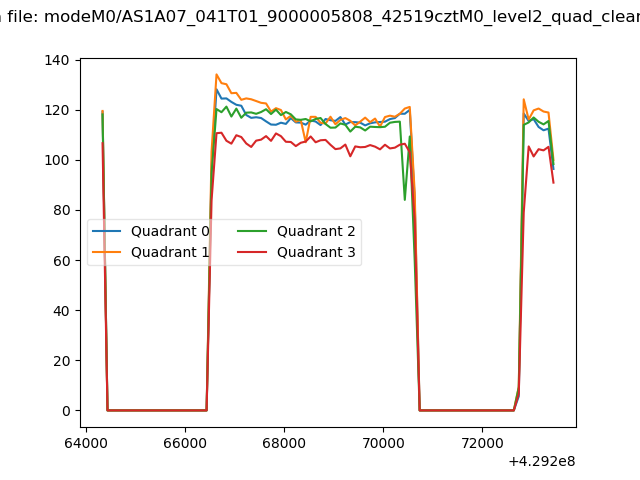 |
|
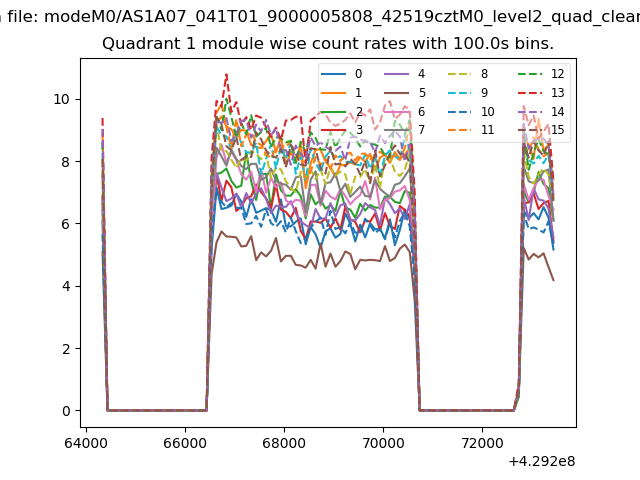
| Module-wise count rates for Quadrant A Data is divided into 100 sec bins |
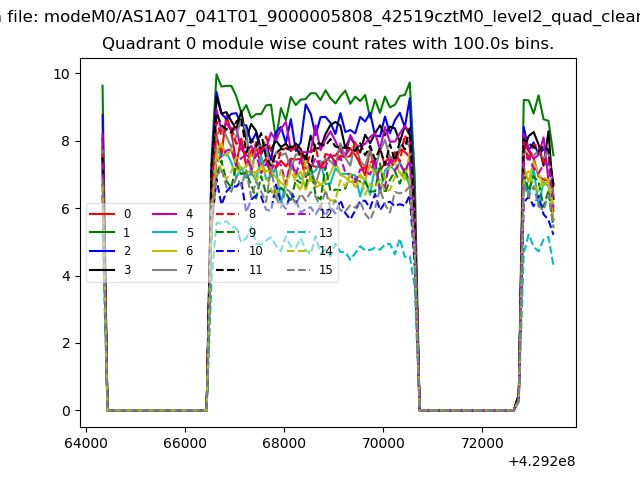 |
 |
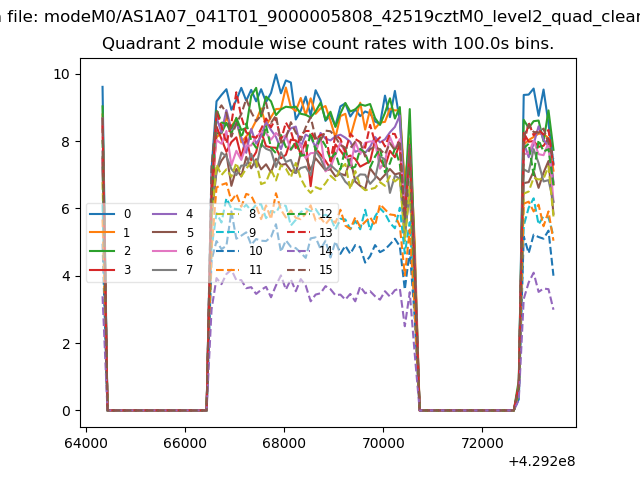
| Module-wise count rates for Quadrant B Data is divided into 100 sec bins |
 |
 |
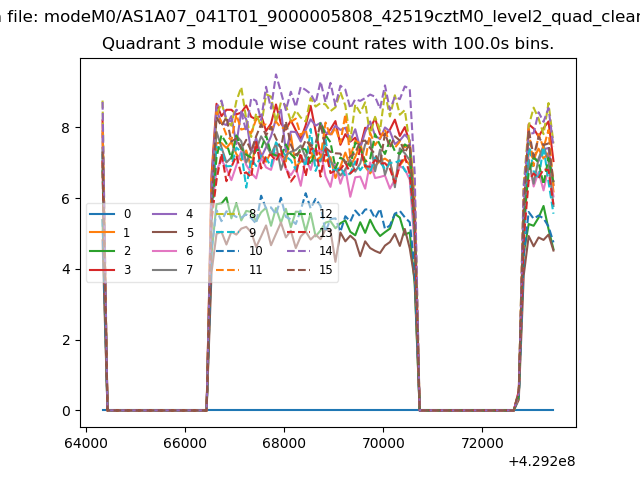
| Module-wise count rates for Quadrant C Data is divided into 100 sec bins |
 |
 |
| Module-wise count rates for Quadrant D Data is divided into 100 sec bins |
 |
 |
| Parameter | Plot |
|---|---|
| CZT HV Monitor | 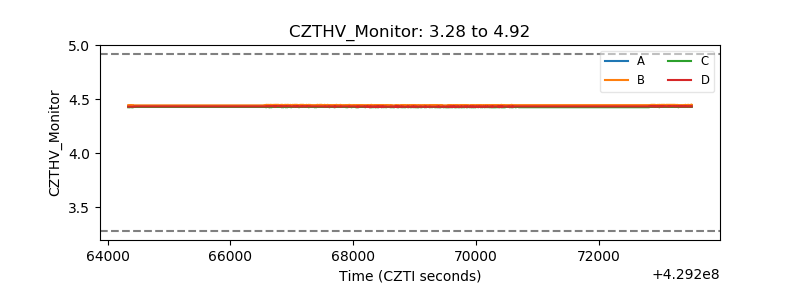 |
| D_VDD | 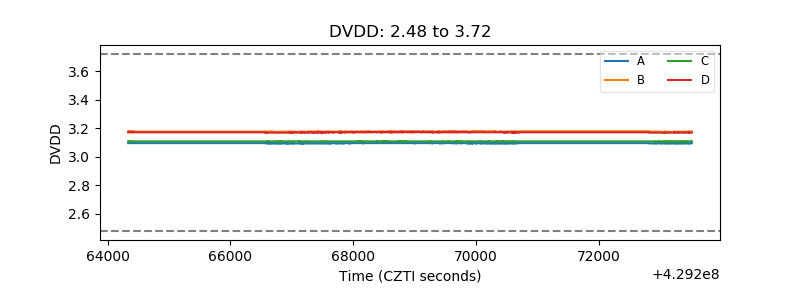 |
| Temperature 1 | 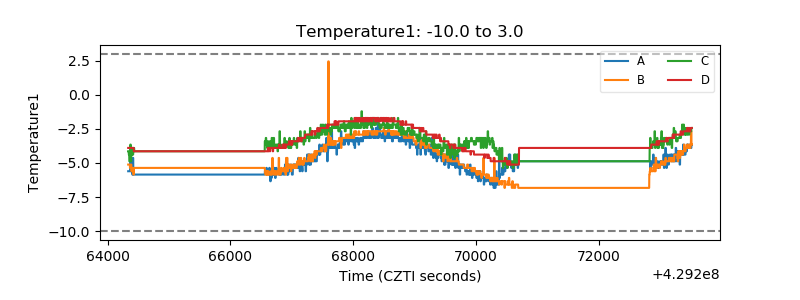 |
| Veto HV Monitor | 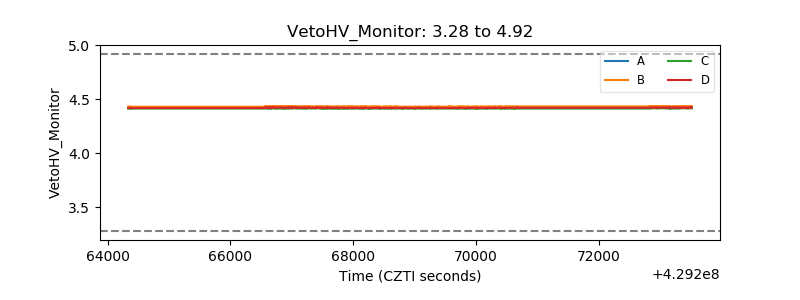 |
| Veto LLD | 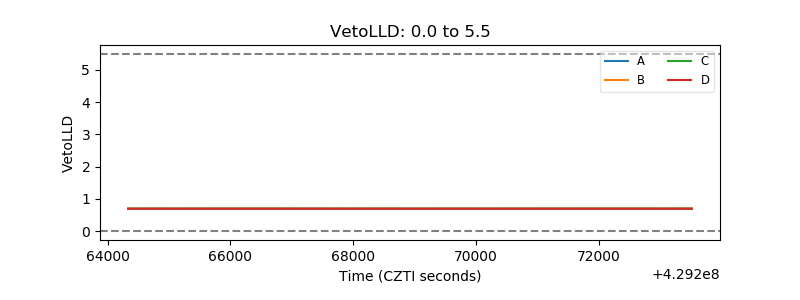 |
| Alpha Counter | 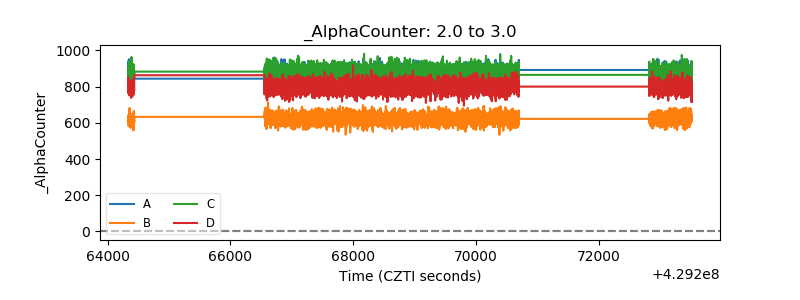 |
| _CPM_Rate | 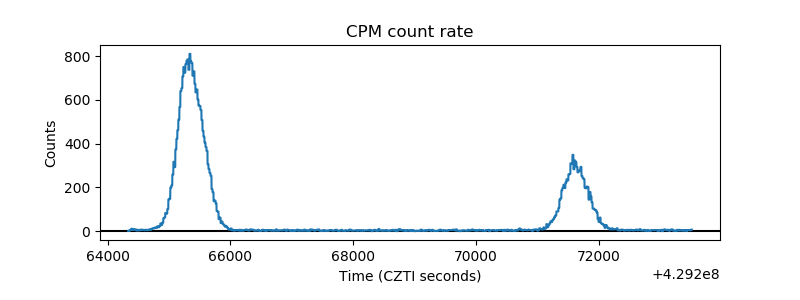 |
| CZT Counter | 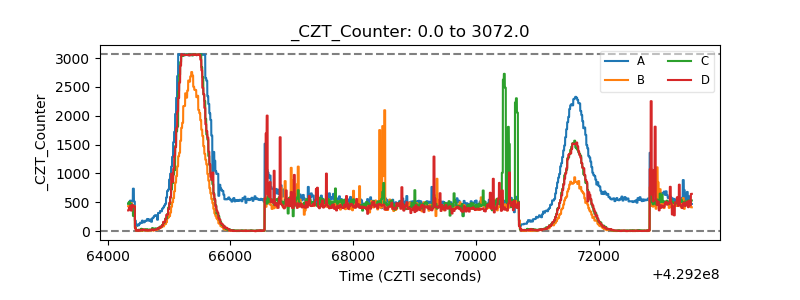 |
| +2.5 Volts monitor | 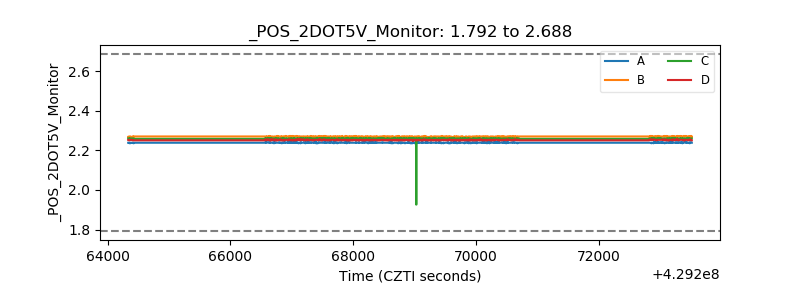 |
| +5 Volts monitor | 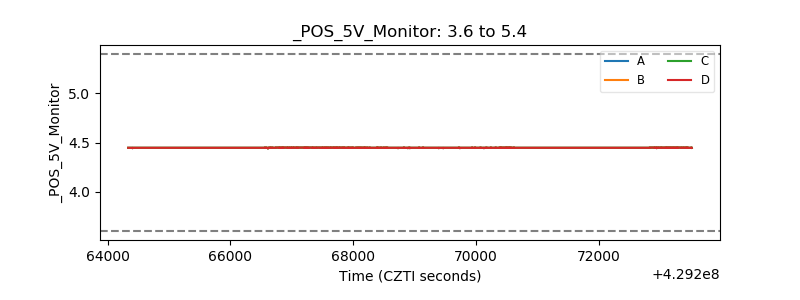 |
| _ROLL_ROT | 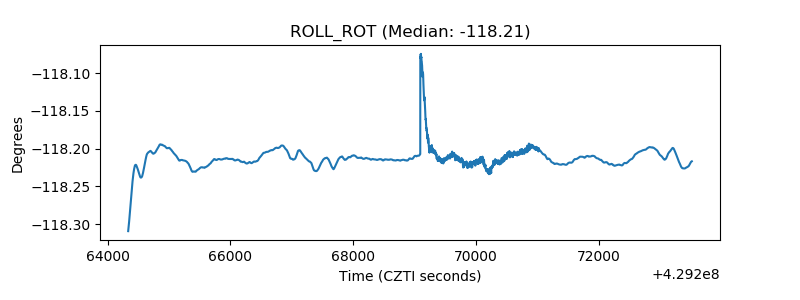 |
| _Roll_DEC | 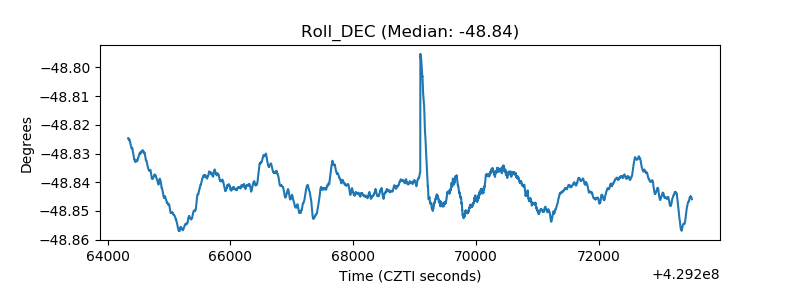 |
| _Roll_RA | 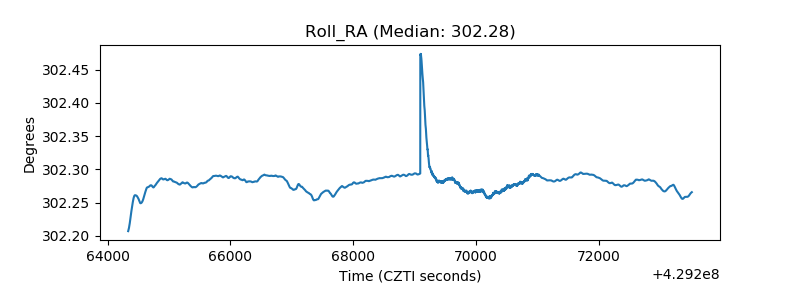 |
| Veto Counter |  |