| Param | Original file | Final file |
|---|---|---|
| Filename | modeM0/AS1A07_041T01_9000005808_42520cztM0_level2.fits | modeM0/AS1A07_041T01_9000005808_42520cztM0_level2_quad_clean.evt |
| Size (bytes) | 313,320,960 | 94,429,440 |
| Size | 298.8 MB | 90.1 MB |
| Events in quadrant A | 2,984,841 | 628,137 |
| Events in quadrant B | 2,605,660 | 642,598 |
| Events in quadrant C | 2,848,665 | 624,069 |
| Events in quadrant D | 2,722,183 | 572,804 |
| Mode M0 | |||
|---|---|---|---|
| Quadrant | BADHDUFLAG | Total packets | Discarded packets |
| A | 0 | 12273 | 3 |
| B | 0 | 11656 | 2 |
| C | 0 | 12084 | 2 |
| D | 0 | 12198 | 2 |
| Mode SS | |||
|---|---|---|---|
| Quadrant | BADHDUFLAG | Total packets | Discarded packets |
| A | 0 | 116 | 0 |
| B | 0 | 116 | 0 |
| C | 0 | 116 | 0 |
| D | 0 | 116 | 0 |
| Mode M9 | |||
|---|---|---|---|
| Quadrant | BADHDUFLAG | Total packets | Discarded packets |
| A | 0 | 42 | 0 |
| B | 0 | 42 | 0 |
| C | 0 | 42 | 0 |
| D | 0 | 42 | 0 |
| Quadrant | Total seconds | Saturated seconds | Saturation percentage |
|---|---|---|---|
| A | 5601 | 10 | 0.178540% |
| B | 5602 | 14 | 0.249911% |
| C | 5602 | 78 | 1.392360% |
| D | 5602 | 66 | 1.178151% |
Noise dominated data is calculated using 1-second bins in cleaned event files. If a bin has >2000 counts, and if more than 50% of those come from <1% of pixels, then it is considered to be noise-dominated and hence unusable.
| Quadrant | # 1 sec bins | Bins with >0 counts | Bins with >2000 counts | High rate bins dominated by noise | Noise dominated (total time) | Noise dominated (detector-on time) | Marked lightcurve |
|---|---|---|---|---|---|---|---|
| A | 9755 | 5603 | 5 | 5 | 0.05% | 0.09% | 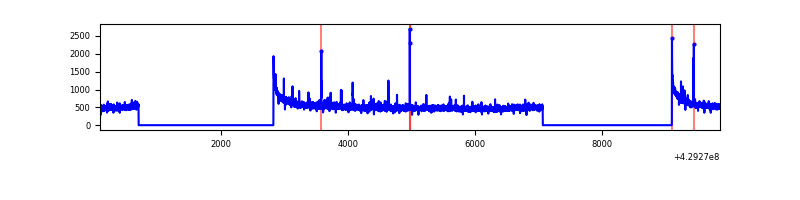 |
| B | 9756 | 5604 | 8 | 8 | 0.08% | 0.14% | 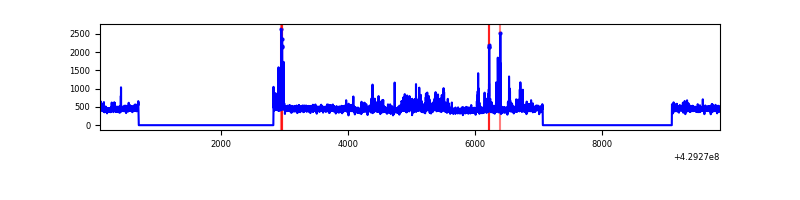 |
| C | 9756 | 5604 | 75 | 75 | 0.77% | 1.34% | 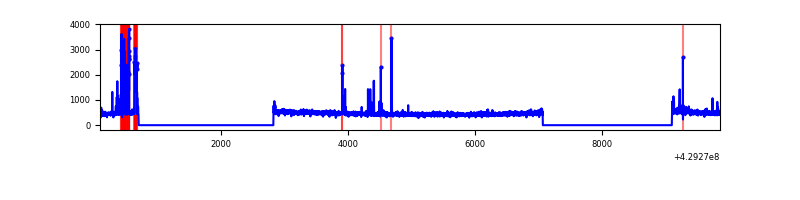 |
| D | 9756 | 5604 | 41 | 41 | 0.42% | 0.73% | 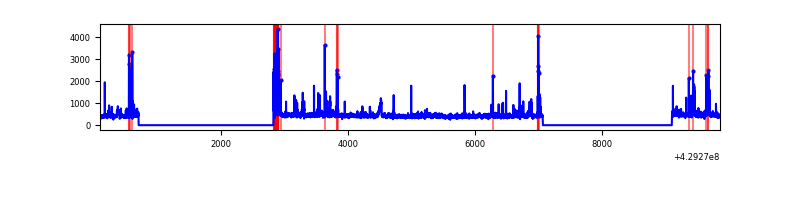 |
Top three noisy pixels from each quadrant. If the there are fewer than three noisy pixels in the level2.evt file, extra rows are filled as -1
| Pixel properties | Quadrant properties | ||||||
|---|---|---|---|---|---|---|---|
| Quadrant | DetID | PixID | Counts | Sigma | Mean | Median | Sigma |
| A | 10 | 83 | 551886 | 4429.85 | 607 | 598 | 124.4 |
| A | 12 | 189 | 45036 | 357.08 | 607 | 598 | 124.4 |
| A | 2 | 79 | 9973 | 75.33 | 607 | 598 | 124.4 |
| B | 0 | 245 | 159404 | 1354.9 | 604 | 588 | 117.2 |
| B | 5 | 255 | 75369 | 637.98 | 604 | 588 | 117.2 |
| B | 12 | 111 | 14713 | 120.5 | 604 | 588 | 117.2 |
| C | 0 | 239 | 263368 | 1898.64 | 592 | 597 | 138.4 |
| C | 15 | 214 | 252662 | 1821.29 | 592 | 597 | 138.4 |
| C | 14 | 254 | 18431 | 128.86 | 592 | 597 | 138.4 |
| D | 12 | 6 | 118006 | 821.86 | 591 | 576 | 142.9 |
| D | 1 | 52 | 77239 | 536.55 | 591 | 576 | 142.9 |
| D | 10 | 199 | 61507 | 426.44 | 591 | 576 | 142.9 |
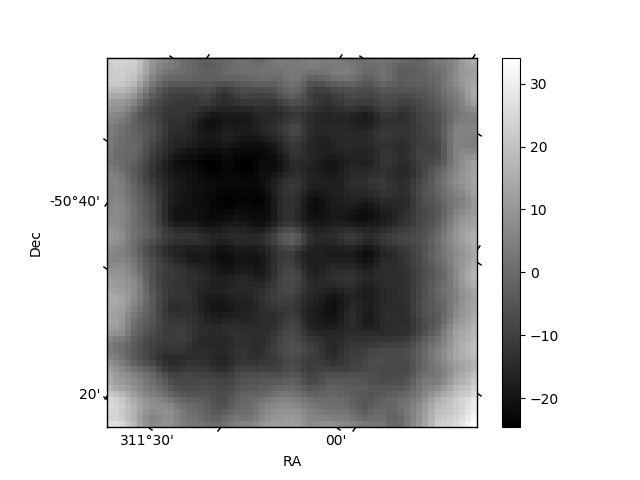
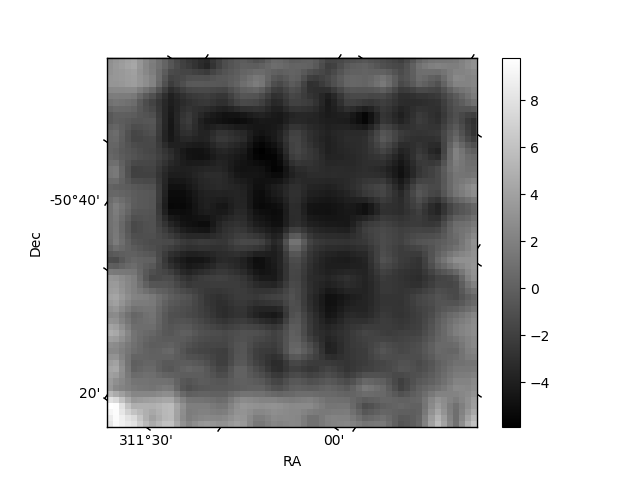
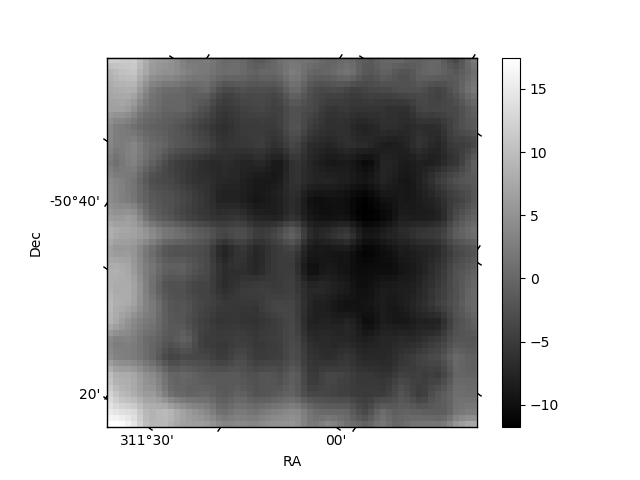
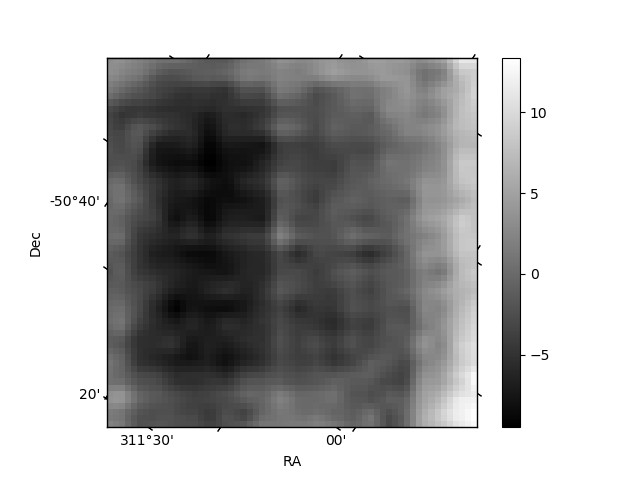
Histogram calculated using DETX and DETY for each event in the final _common_clean file
| Quadrant A | 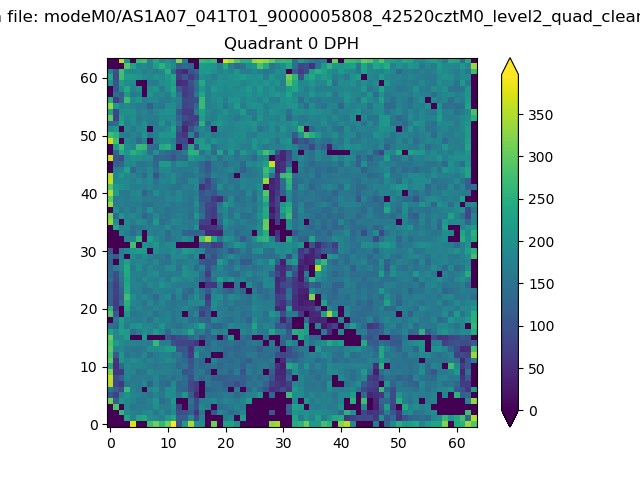 |
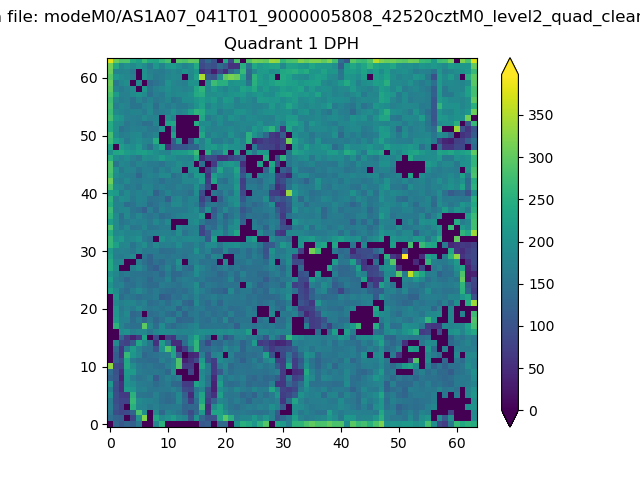 |
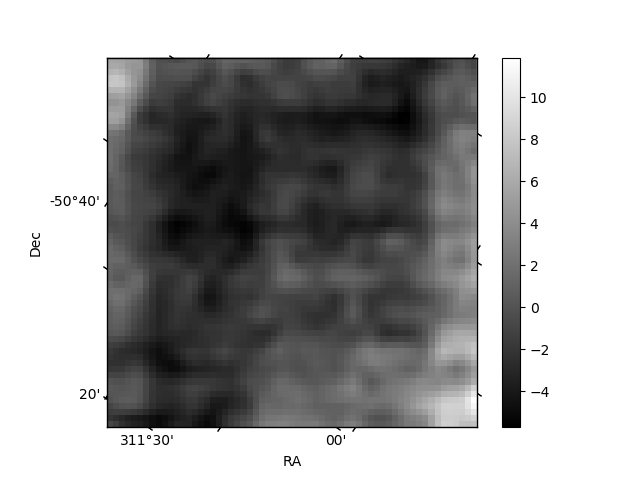
Quadrant B |
|---|---|---|---|
| Quadrant D | 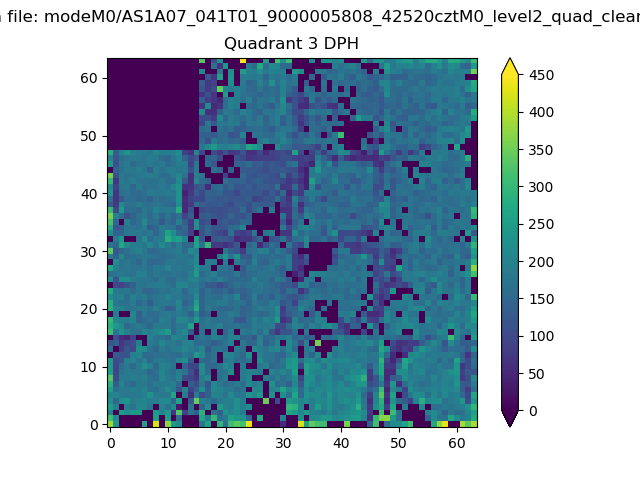 |
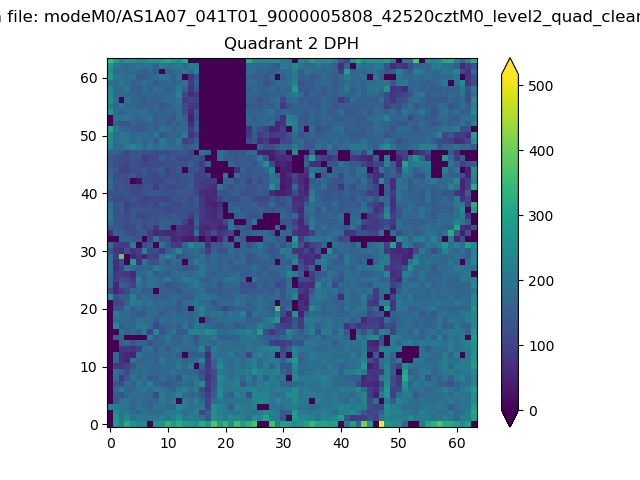 |
Quadrant C |
| Plot type | Count rate plots | Images |
|---|---|---|
| Comparison with Poisson distribution Blue bars denote a histogram of data divided into 1 sec bins. Red curve is a Poisson curve with rate = median count rate of data. |
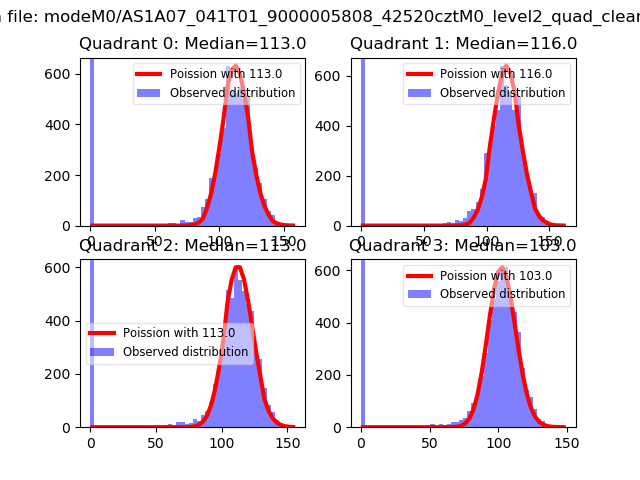 |
 |
| Quadrant-wise count rates Data is divided into 100 sec bins |
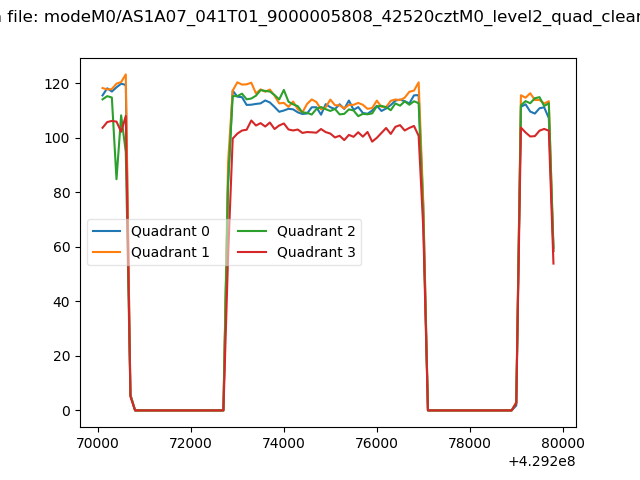 |
|
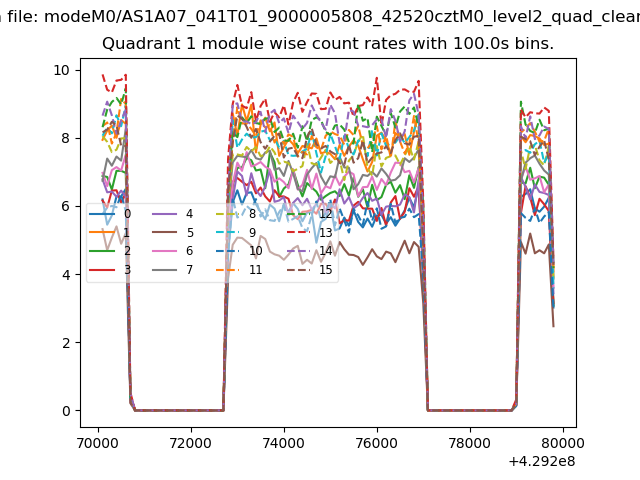
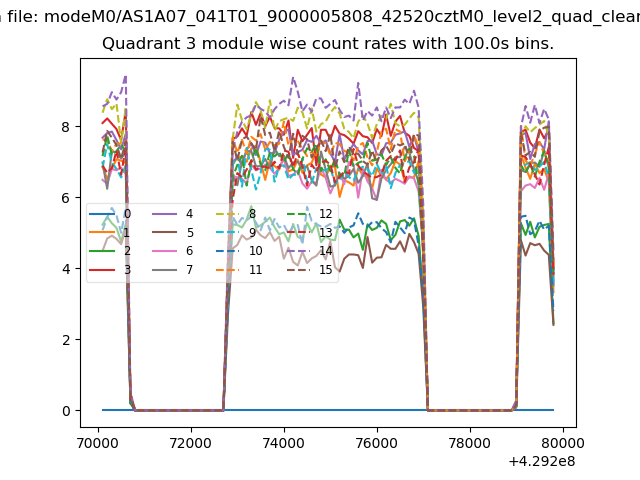
| Module-wise count rates for Quadrant A Data is divided into 100 sec bins |
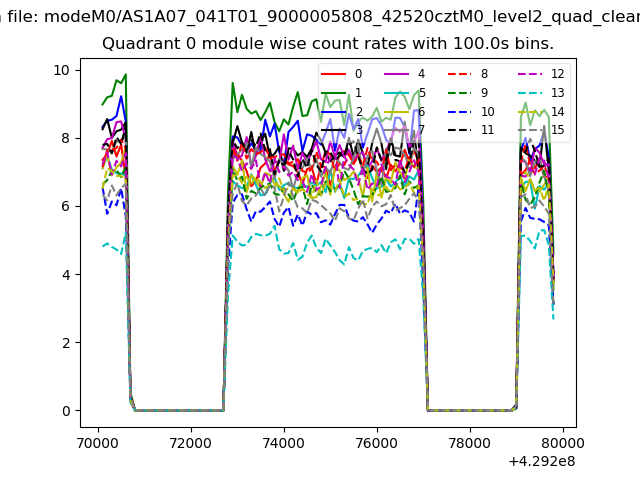 |
 |
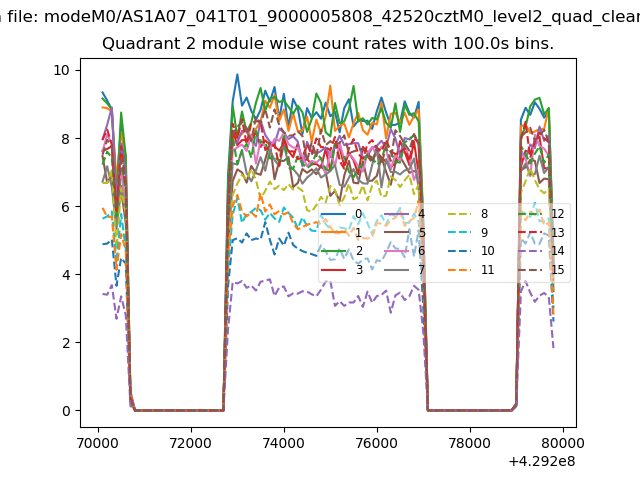
| Module-wise count rates for Quadrant B Data is divided into 100 sec bins |
 |
 |
| Module-wise count rates for Quadrant C Data is divided into 100 sec bins |
 |
 |
| Module-wise count rates for Quadrant D Data is divided into 100 sec bins |
 |
 |
| Parameter | Plot |
|---|---|
| CZT HV Monitor | 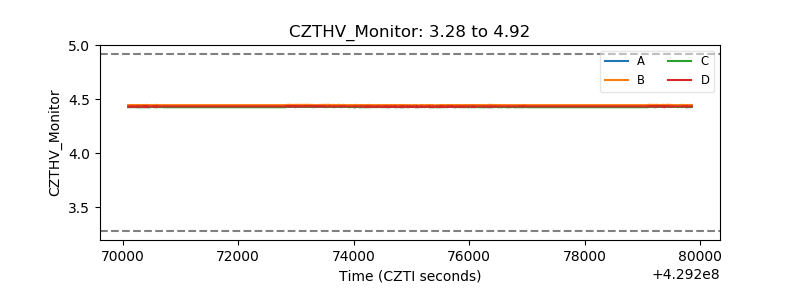 |
| D_VDD | 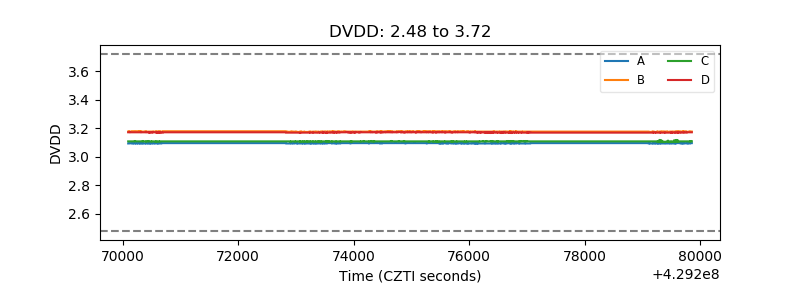 |
| Temperature 1 | 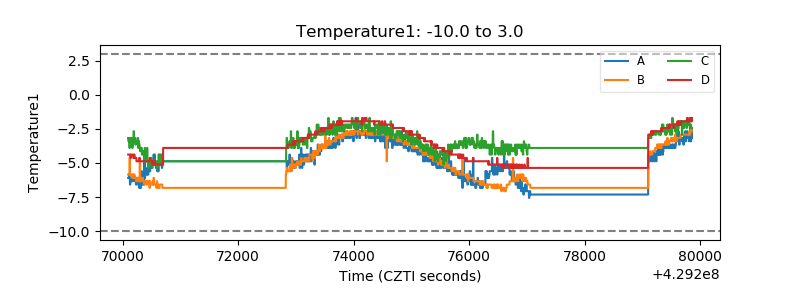 |
| Veto HV Monitor | 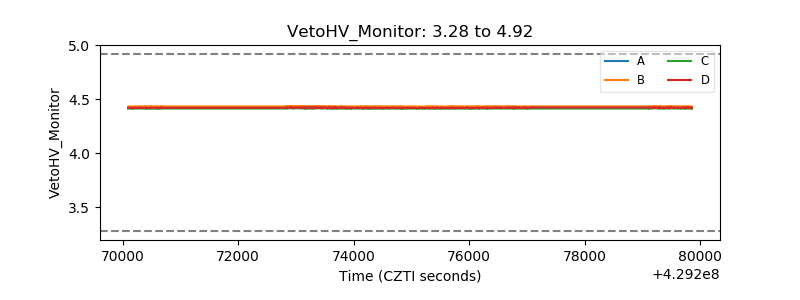 |
| Veto LLD | 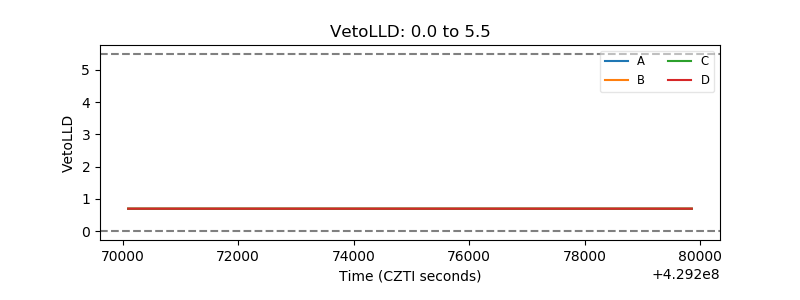 |
| Alpha Counter | 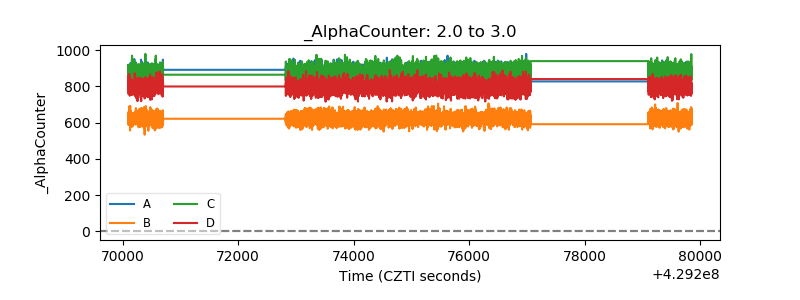 |
| _CPM_Rate | 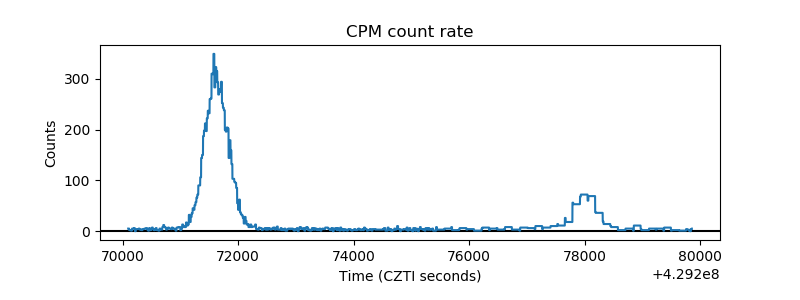 |
| CZT Counter | 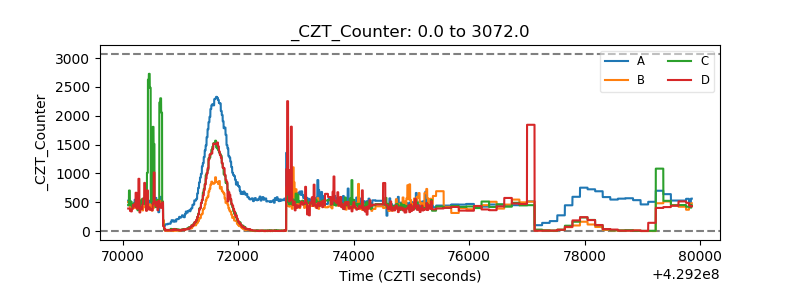 |
| +2.5 Volts monitor | 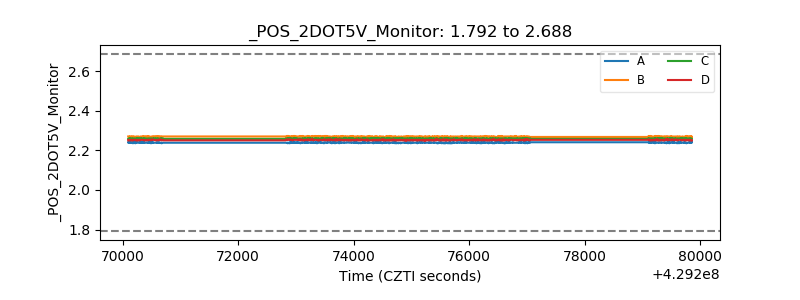 |
| +5 Volts monitor |  |
| _ROLL_ROT | 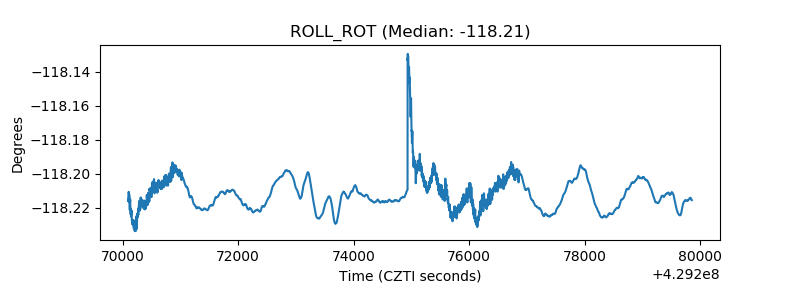 |
| _Roll_DEC | 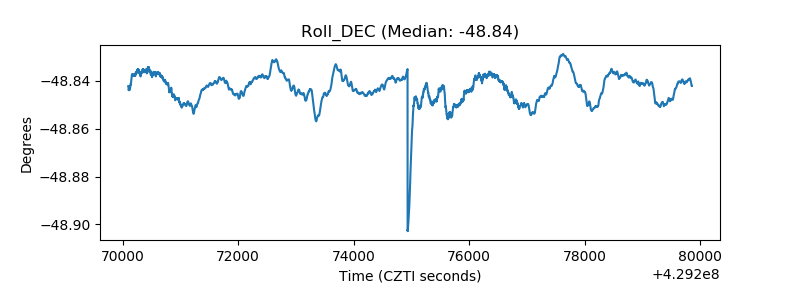 |
| _Roll_RA | 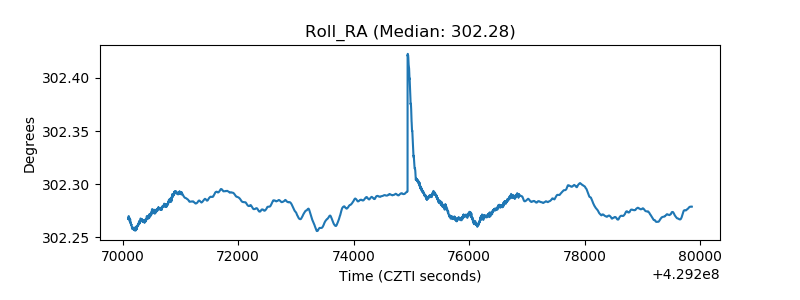 |
| Veto Counter | 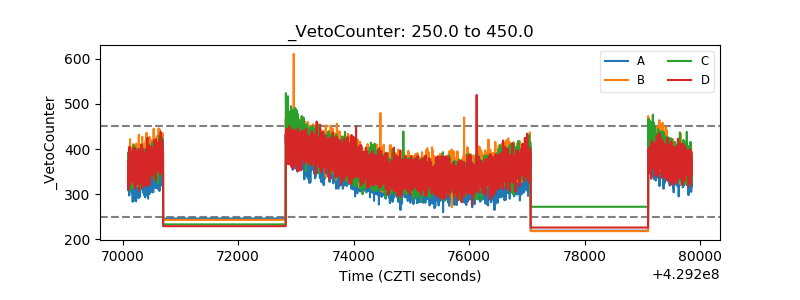 |