| Param | Original file | Final file |
|---|---|---|
| Filename | modeM0/AS1A07_041T01_9000005808_42521cztM0_level2.fits | modeM0/AS1A07_041T01_9000005808_42521cztM0_level2_quad_clean.evt |
| Size (bytes) | 281,822,400 | 87,629,760 |
| Size | 268.8 MB | 83.6 MB |
| Events in quadrant A | 2,823,947 | 578,066 |
| Events in quadrant B | 2,317,810 | 591,300 |
| Events in quadrant C | 2,429,190 | 576,364 |
| Events in quadrant D | 2,444,820 | 534,360 |
| Mode M0 | |||
|---|---|---|---|
| Quadrant | BADHDUFLAG | Total packets | Discarded packets |
| A | 0 | 11716 | 2 |
| B | 0 | 10820 | 2 |
| C | 0 | 10814 | 2 |
| D | 0 | 11186 | 2 |
| Mode SS | |||
|---|---|---|---|
| Quadrant | BADHDUFLAG | Total packets | Discarded packets |
| A | 0 | 108 | 0 |
| B | 0 | 108 | 0 |
| C | 0 | 108 | 0 |
| D | 0 | 108 | 0 |
| Mode M9 | |||
|---|---|---|---|
| Quadrant | BADHDUFLAG | Total packets | Discarded packets |
| A | 0 | 30 | 0 |
| B | 0 | 31 | 0 |
| C | 0 | 31 | 0 |
| D | 0 | 31 | 0 |
| Quadrant | Total seconds | Saturated seconds | Saturation percentage |
|---|---|---|---|
| A | 5334 | 15 | 0.281215% |
| B | 5334 | 7 | 0.131234% |
| C | 5334 | 5 | 0.093738% |
| D | 5334 | 24 | 0.449944% |
Noise dominated data is calculated using 1-second bins in cleaned event files. If a bin has >2000 counts, and if more than 50% of those come from <1% of pixels, then it is considered to be noise-dominated and hence unusable.
| Quadrant | # 1 sec bins | Bins with >0 counts | Bins with >2000 counts | High rate bins dominated by noise | Noise dominated (total time) | Noise dominated (detector-on time) | Marked lightcurve |
|---|---|---|---|---|---|---|---|
| A | 7097 | 5335 | 8 | 8 | 0.11% | 0.15% | 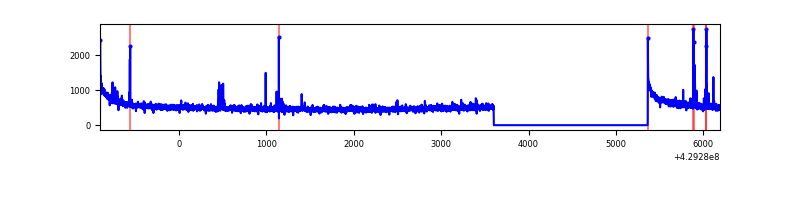 |
| B | 7097 | 5335 | 1 | 1 | 0.01% | 0.02% | 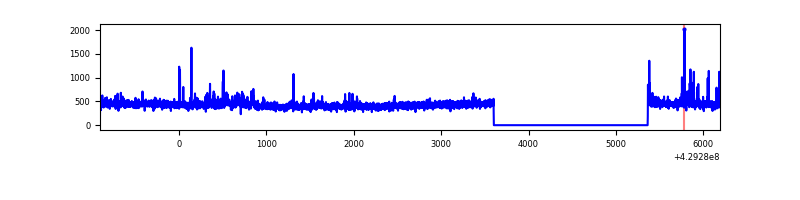 |
| C | 7097 | 5335 | 1 | 1 | 0.01% | 0.02% | 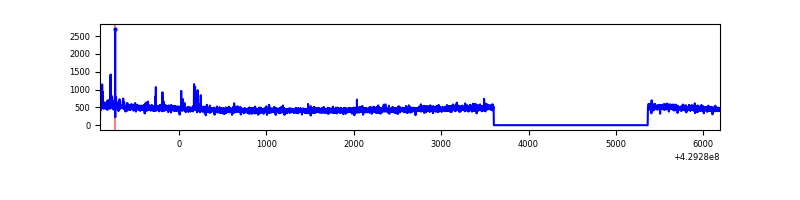 |
| D | 7097 | 5335 | 16 | 16 | 0.23% | 0.30% | 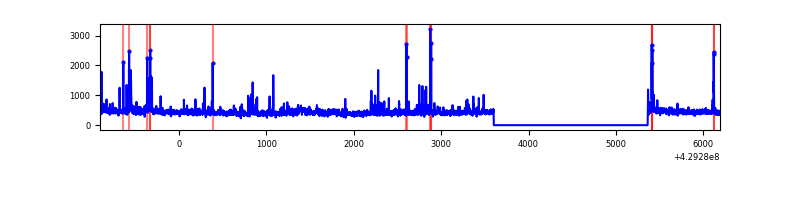 |
Top three noisy pixels from each quadrant. If the there are fewer than three noisy pixels in the level2.evt file, extra rows are filled as -1
| Pixel properties | Quadrant properties | ||||||
|---|---|---|---|---|---|---|---|
| Quadrant | DetID | PixID | Counts | Sigma | Mean | Median | Sigma |
| A | 10 | 83 | 540829 | 4625.74 | 566 | 554 | 116.8 |
| A | 13 | 248 | 52034 | 440.76 | 566 | 554 | 116.8 |
| A | 12 | 189 | 18812 | 156.32 | 566 | 554 | 116.8 |
| B | 0 | 245 | 67223 | 607.57 | 563 | 548 | 109.7 |
| B | 4 | 141 | 17589 | 155.28 | 563 | 548 | 109.7 |
| B | 5 | 255 | 17560 | 155.02 | 563 | 548 | 109.7 |
| C | 15 | 214 | 239513 | 1859.87 | 552 | 557 | 128.5 |
| C | 0 | 239 | 26025 | 198.23 | 552 | 557 | 128.5 |
| C | 9 | 54 | 9713 | 71.26 | 552 | 557 | 128.5 |
| D | 1 | 52 | 90712 | 665.47 | 554 | 538 | 135.5 |
| D | 10 | 199 | 51082 | 373.01 | 554 | 538 | 135.5 |
| D | 2 | 249 | 36843 | 267.93 | 554 | 538 | 135.5 |
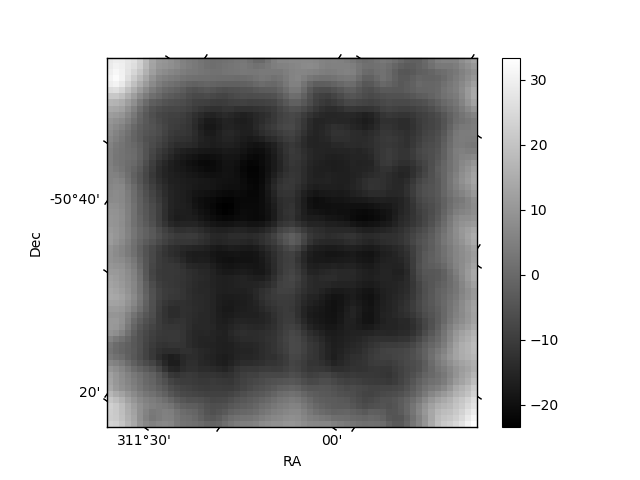
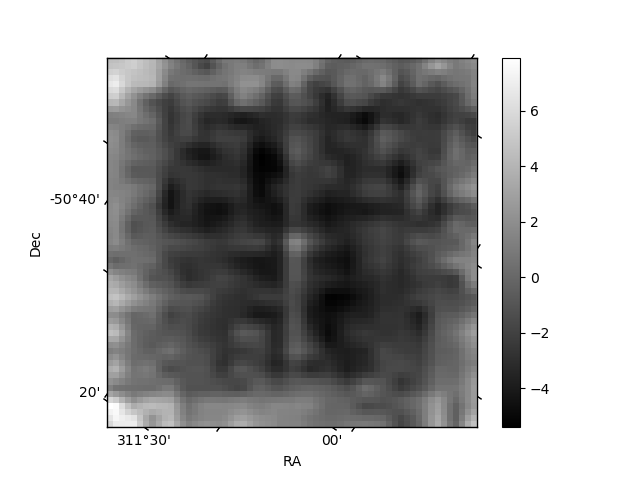
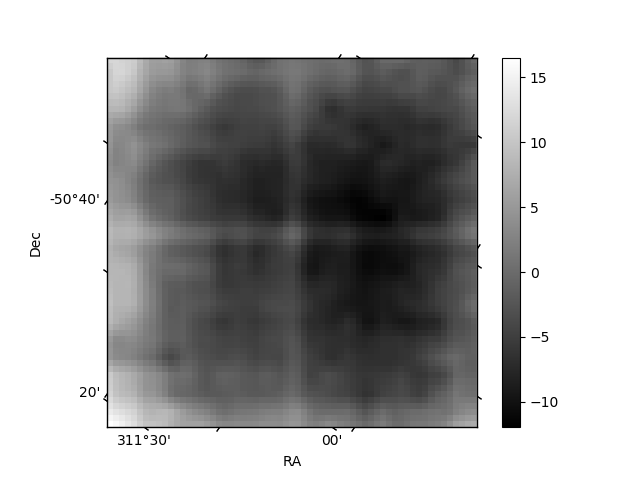
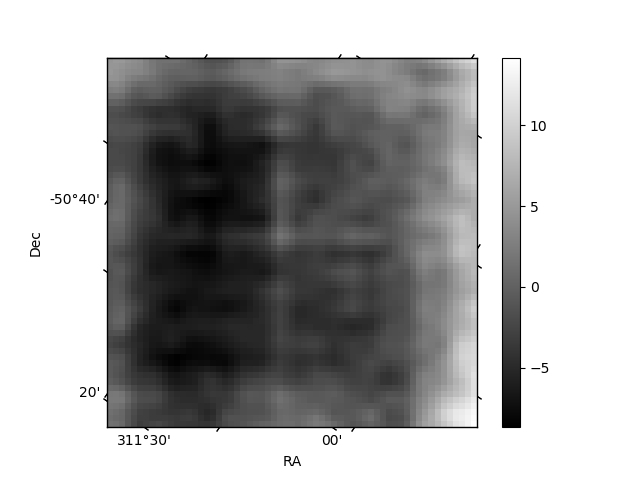
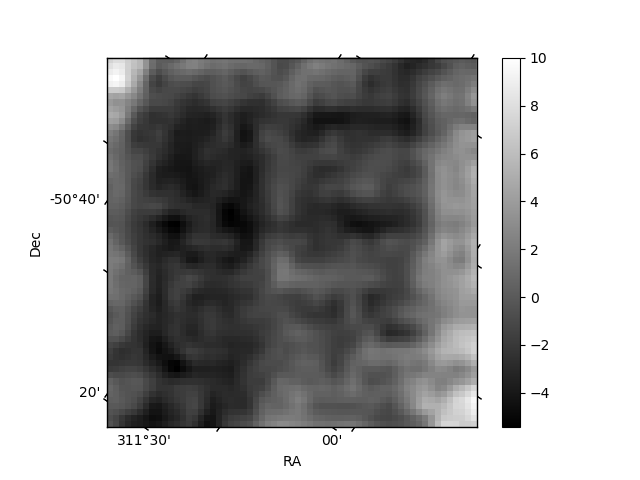
Histogram calculated using DETX and DETY for each event in the final _common_clean file
| Quadrant A |  |
 |
Quadrant B |
|---|---|---|---|
| Quadrant D |  |
 |
Quadrant C |
| Plot type | Count rate plots | Images |
|---|---|---|
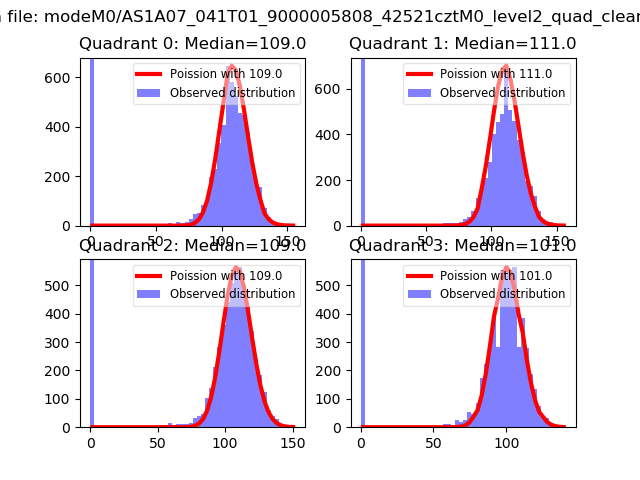
| Comparison with Poisson distribution Blue bars denote a histogram of data divided into 1 sec bins. Red curve is a Poisson curve with rate = median count rate of data. |
 |
 |
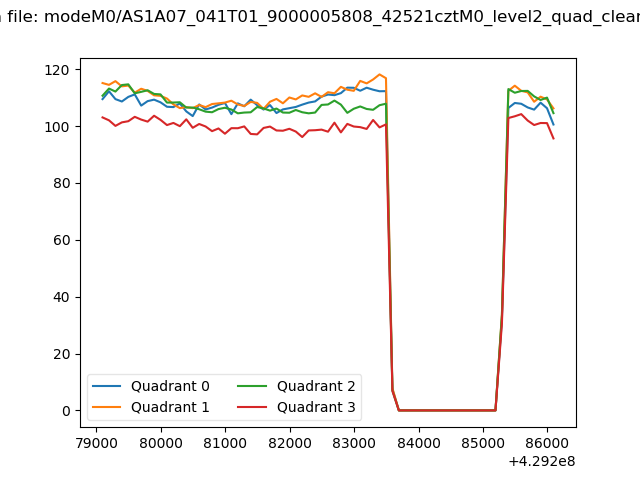
| Quadrant-wise count rates Data is divided into 100 sec bins |
 |
|
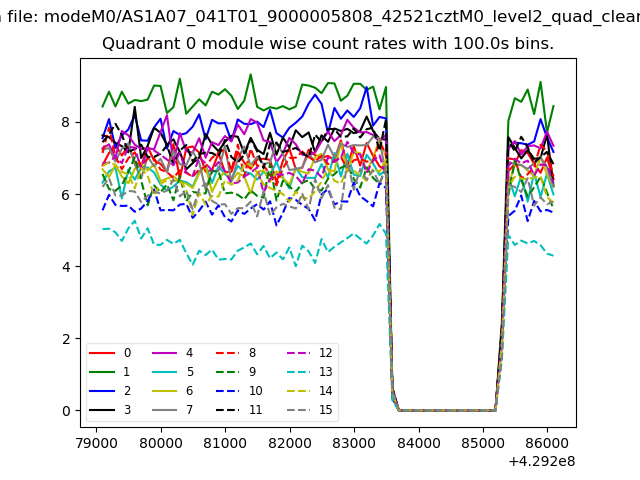
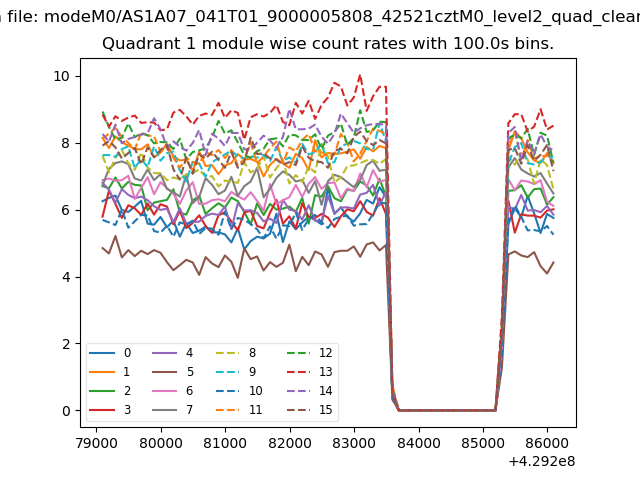
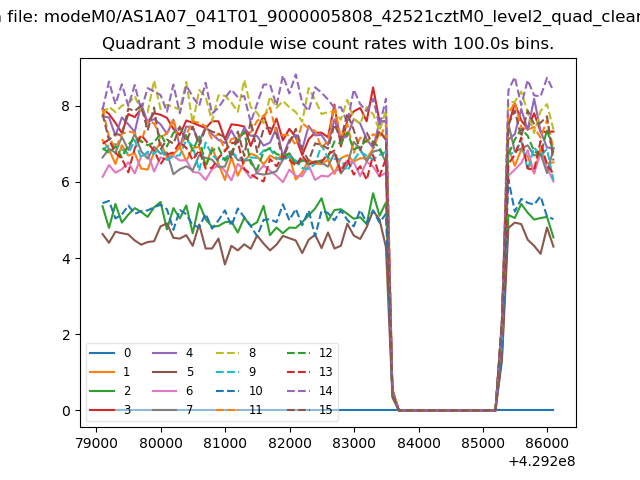
| Module-wise count rates for Quadrant A Data is divided into 100 sec bins |
 |
 |
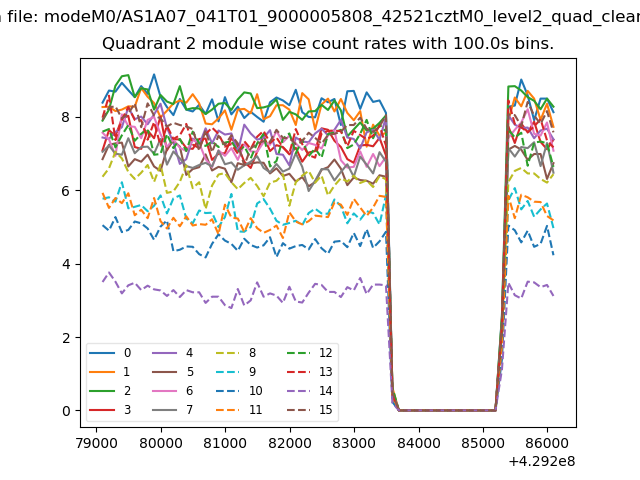
| Module-wise count rates for Quadrant B Data is divided into 100 sec bins |
 |
 |
| Module-wise count rates for Quadrant C Data is divided into 100 sec bins |
 |
 |
| Module-wise count rates for Quadrant D Data is divided into 100 sec bins |
 |
 |
| Parameter | Plot |
|---|---|
| CZT HV Monitor | 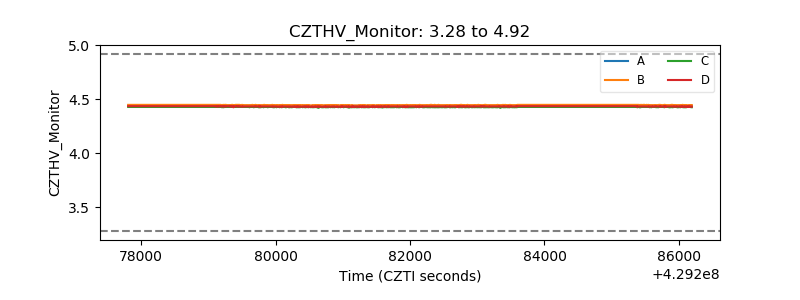 |
| D_VDD | 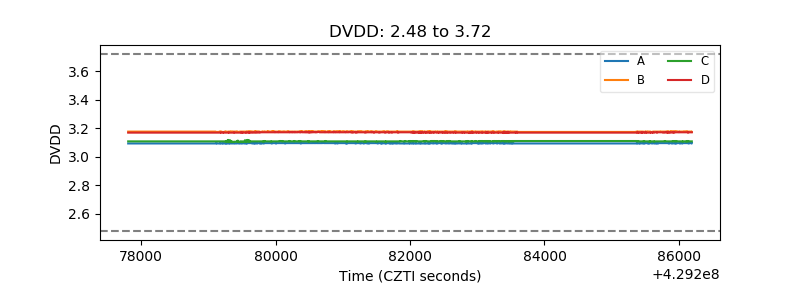 |
| Temperature 1 | 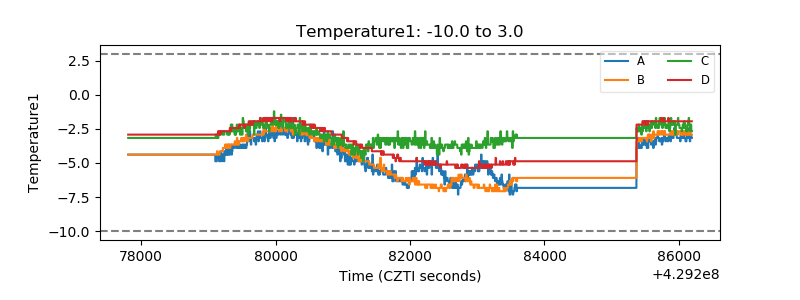 |
| Veto HV Monitor | 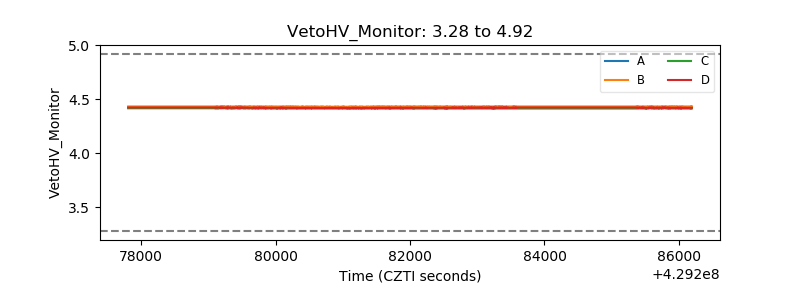 |
| Veto LLD | 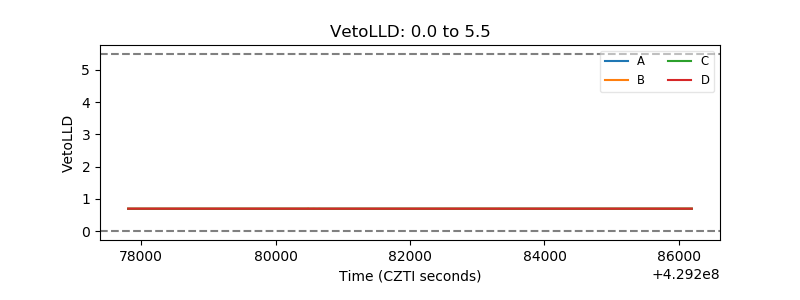 |
| Alpha Counter | 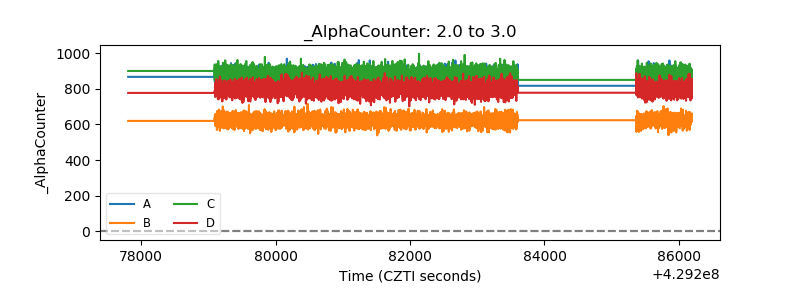 |
| _CPM_Rate | 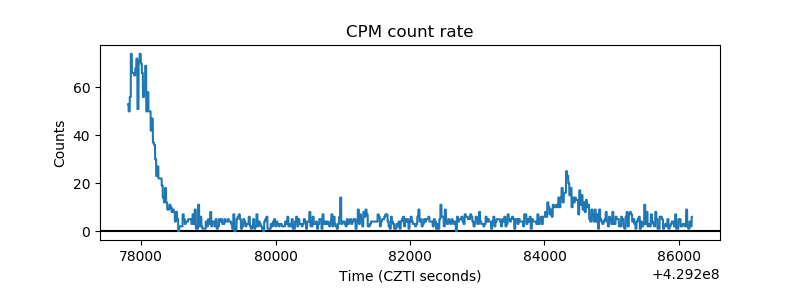 |
| CZT Counter | 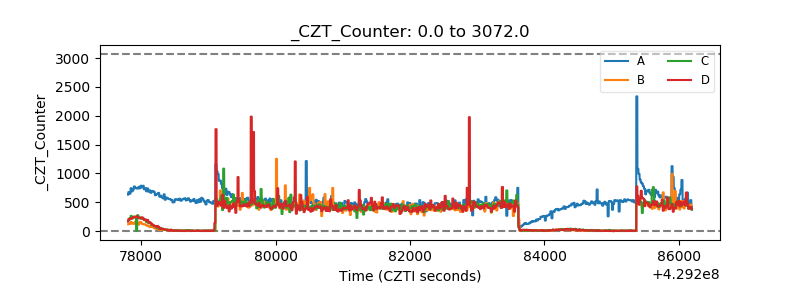 |
| +2.5 Volts monitor |  |
| +5 Volts monitor | 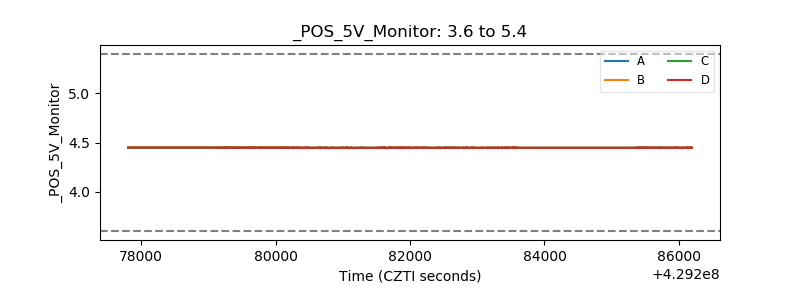 |
| _ROLL_ROT |  |
| _Roll_DEC | 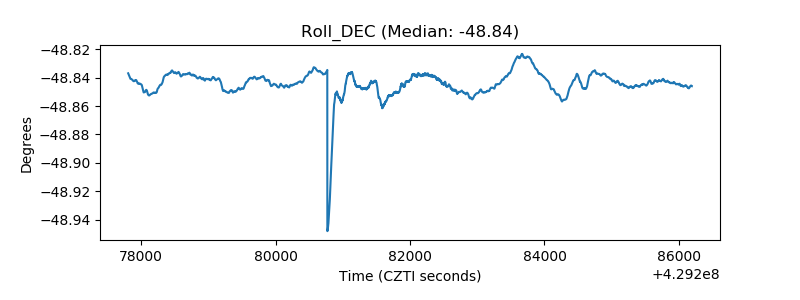 |
| _Roll_RA | 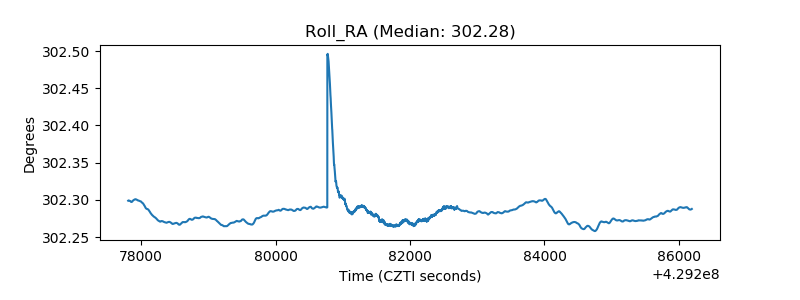 |
| Veto Counter | 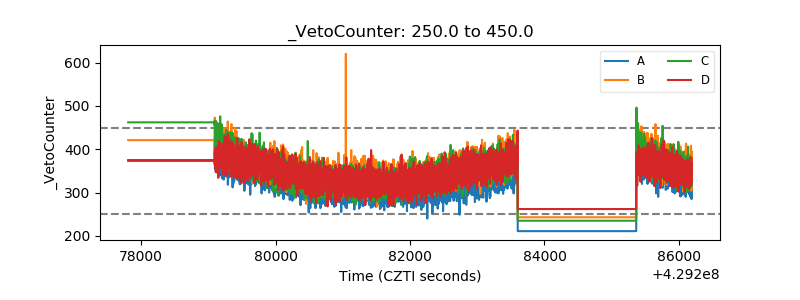 |