| Param | Original file | Final file |
|---|---|---|
| Filename | modeM0/AS1A07_041T01_9000005808_42522cztM0_level2.fits | modeM0/AS1A07_041T01_9000005808_42522cztM0_level2_quad_clean.evt |
| Size (bytes) | 295,663,680 | 91,391,040 |
| Size | 282.0 MB | 87.2 MB |
| Events in quadrant A | 2,965,503 | 603,952 |
| Events in quadrant B | 2,437,424 | 617,647 |
| Events in quadrant C | 2,551,250 | 599,184 |
| Events in quadrant D | 2,551,409 | 553,024 |
| Mode M0 | |||
|---|---|---|---|
| Quadrant | BADHDUFLAG | Total packets | Discarded packets |
| A | 0 | 12311 | 2 |
| B | 0 | 11416 | 2 |
| C | 0 | 11316 | 2 |
| D | 0 | 11856 | 2 |
| Mode SS | |||
|---|---|---|---|
| Quadrant | BADHDUFLAG | Total packets | Discarded packets |
| A | 0 | 116 | 0 |
| B | 0 | 116 | 0 |
| C | 0 | 116 | 0 |
| D | 0 | 116 | 0 |
| Mode M9 | |||
|---|---|---|---|
| Quadrant | BADHDUFLAG | Total packets | Discarded packets |
| A | 0 | 32 | 0 |
| B | 0 | 32 | 0 |
| C | 0 | 32 | 0 |
| D | 0 | 32 | 0 |
| Quadrant | Total seconds | Saturated seconds | Saturation percentage |
|---|---|---|---|
| A | 5627 | 16 | 0.284343% |
| B | 5628 | 6 | 0.106610% |
| C | 5628 | 3 | 0.053305% |
| D | 5628 | 33 | 0.586354% |
Noise dominated data is calculated using 1-second bins in cleaned event files. If a bin has >2000 counts, and if more than 50% of those come from <1% of pixels, then it is considered to be noise-dominated and hence unusable.
| Quadrant | # 1 sec bins | Bins with >0 counts | Bins with >2000 counts | High rate bins dominated by noise | Noise dominated (total time) | Noise dominated (detector-on time) | Marked lightcurve |
|---|---|---|---|---|---|---|---|
| A | 8823 | 5629 | 7 | 7 | 0.08% | 0.12% | 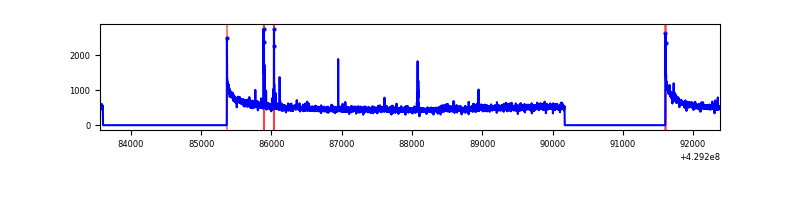 |
| B | 8824 | 5630 | 1 | 1 | 0.01% | 0.02% | 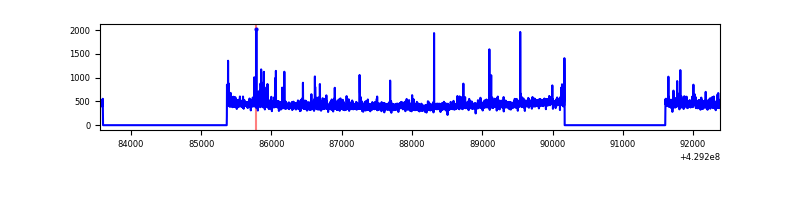 |
| C | 8824 | 5630 | 0 | 0 | 0.00% | 0.00% | 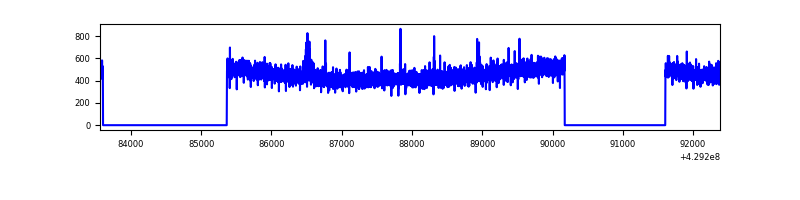 |
| D | 8824 | 5630 | 28 | 28 | 0.32% | 0.50% | 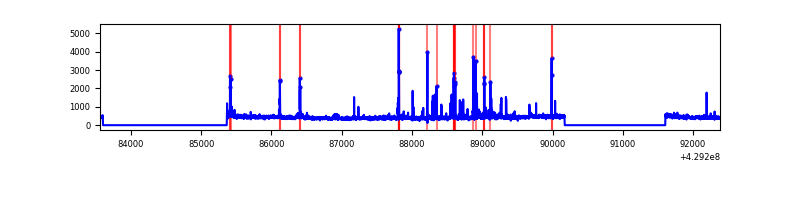 |
Top three noisy pixels from each quadrant. If the there are fewer than three noisy pixels in the level2.evt file, extra rows are filled as -1
| Pixel properties | Quadrant properties | ||||||
|---|---|---|---|---|---|---|---|
| Quadrant | DetID | PixID | Counts | Sigma | Mean | Median | Sigma |
| A | 10 | 83 | 556516 | 4539.8 | 598 | 585 | 122.5 |
| A | 13 | 248 | 37228 | 299.23 | 598 | 585 | 122.5 |
| A | 12 | 189 | 35080 | 281.69 | 598 | 585 | 122.5 |
| B | 0 | 245 | 46663 | 397.52 | 593 | 576 | 115.9 |
| B | 5 | 255 | 21573 | 181.11 | 593 | 576 | 115.9 |
| B | 5 | 172 | 18346 | 153.27 | 593 | 576 | 115.9 |
| C | 15 | 214 | 250608 | 1823.13 | 583 | 586 | 137.1 |
| C | 9 | 54 | 24346 | 173.25 | 583 | 586 | 137.1 |
| C | 3 | 233 | 4713 | 30.09 | 583 | 586 | 137.1 |
| D | 13 | 249 | 93438 | 656.46 | 583 | 566 | 141.5 |
| D | 12 | 6 | 60597 | 424.32 | 583 | 566 | 141.5 |
| D | 1 | 52 | 45246 | 315.82 | 583 | 566 | 141.5 |
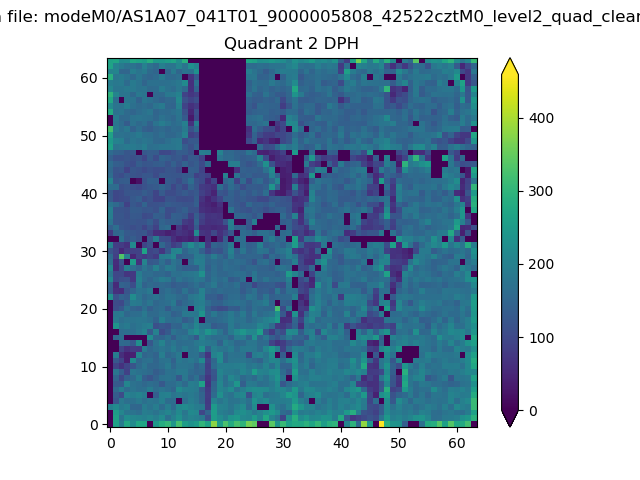
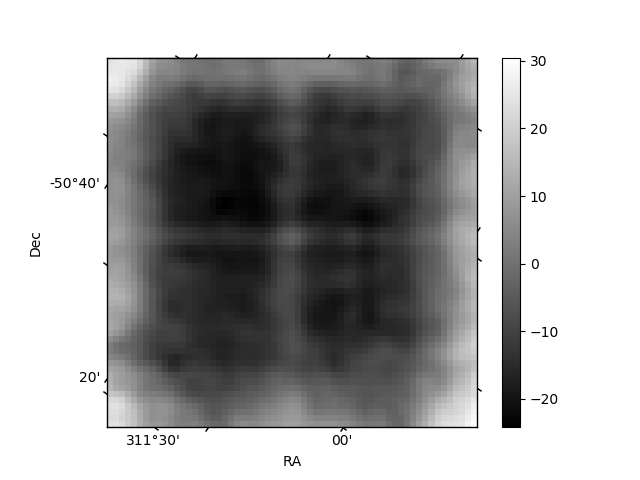
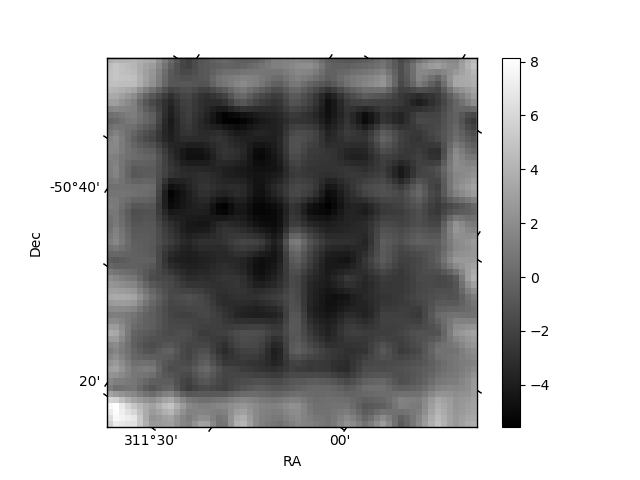
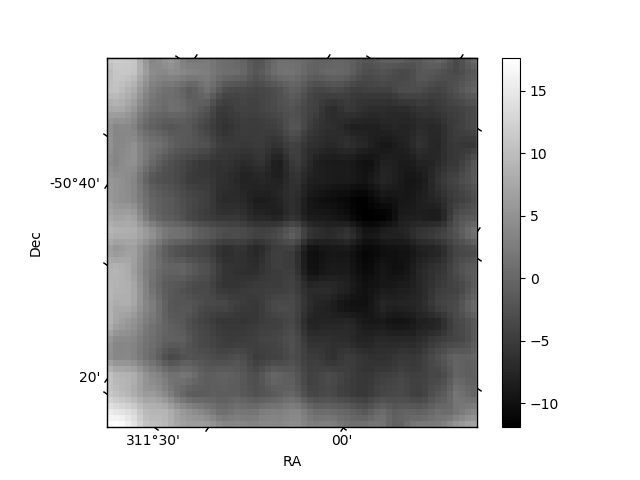
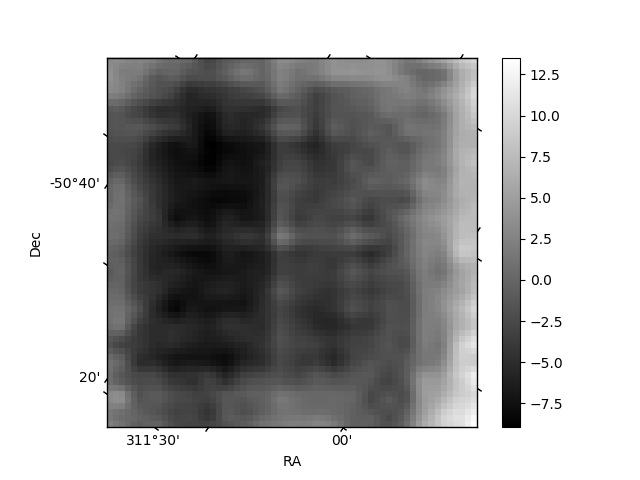
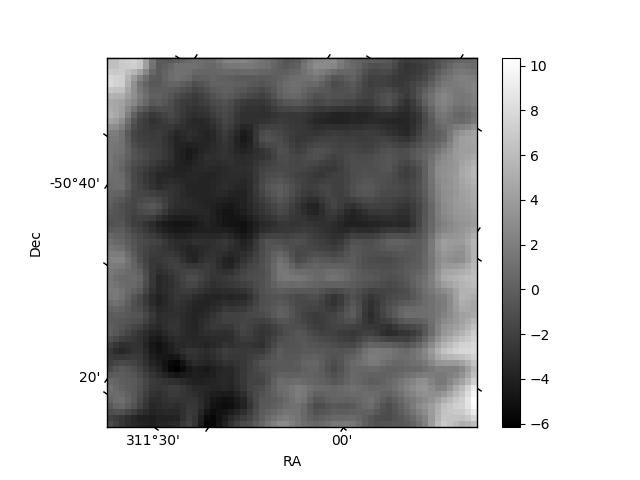
Histogram calculated using DETX and DETY for each event in the final _common_clean file
| Quadrant A | 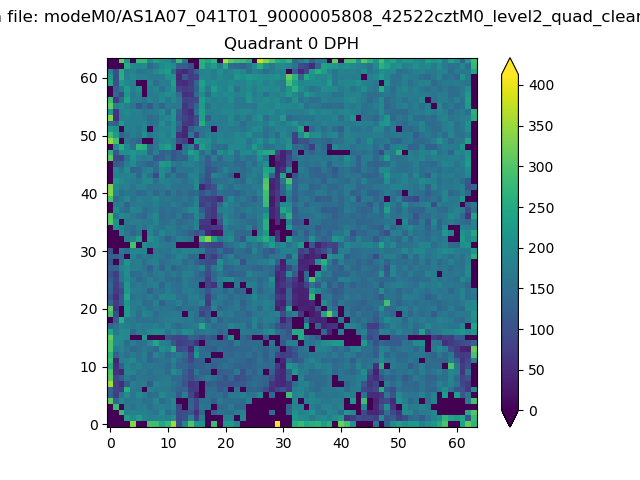 |
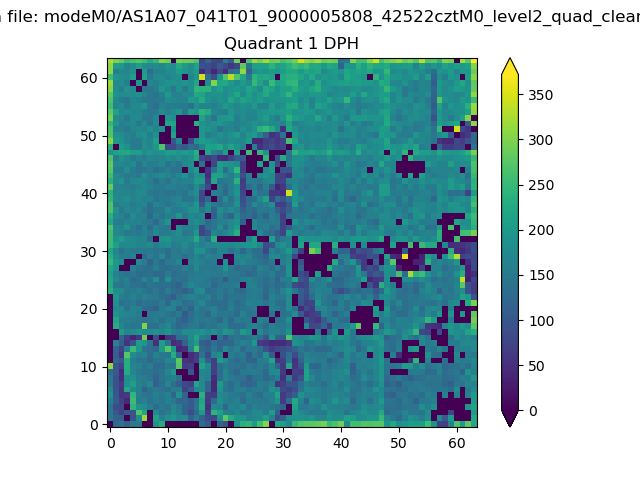 |
Quadrant B |
|---|---|---|---|
| Quadrant D | 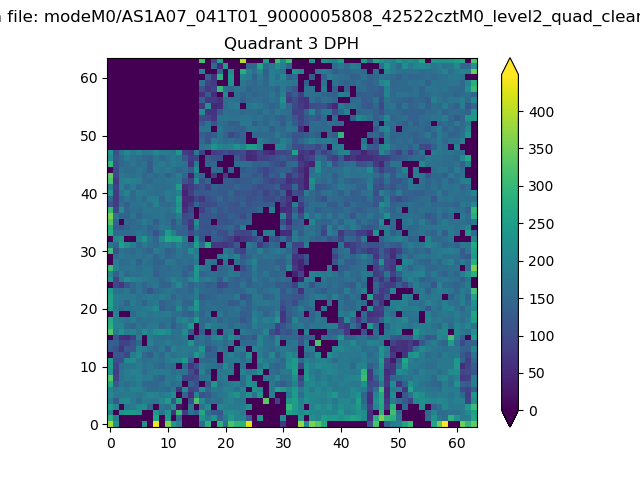 |
 |
Quadrant C |
| Plot type | Count rate plots | Images |
|---|---|---|
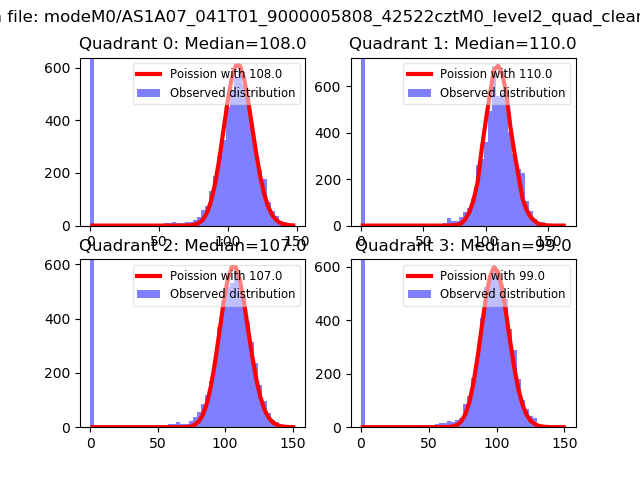
| Comparison with Poisson distribution Blue bars denote a histogram of data divided into 1 sec bins. Red curve is a Poisson curve with rate = median count rate of data. |
 |
 |
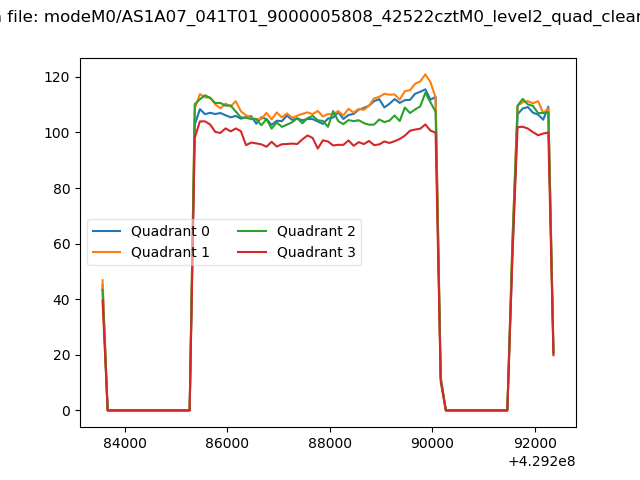
| Quadrant-wise count rates Data is divided into 100 sec bins |
 |
|
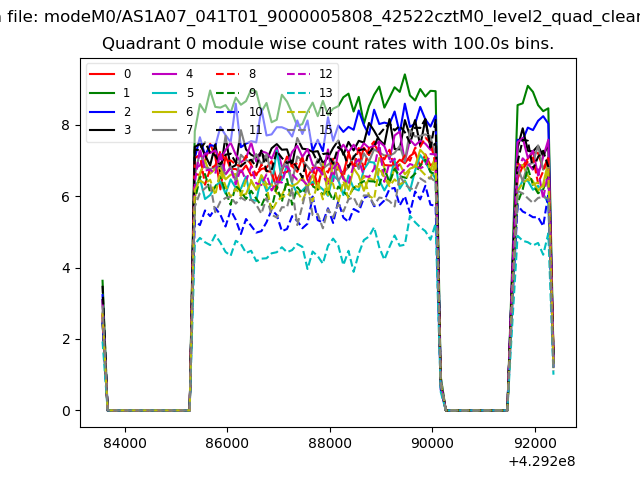
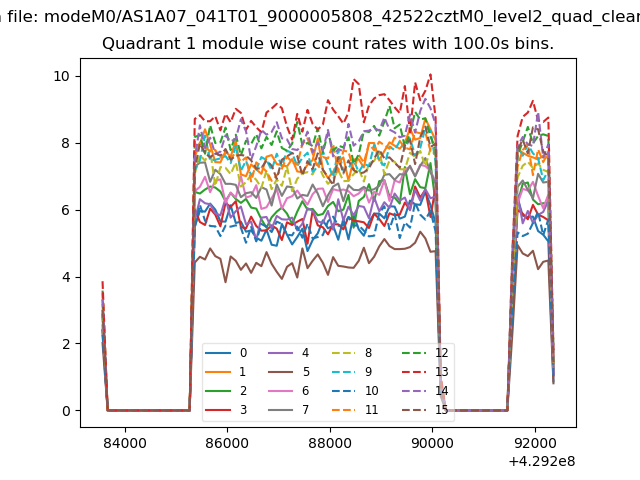
| Module-wise count rates for Quadrant A Data is divided into 100 sec bins |
 |
 |
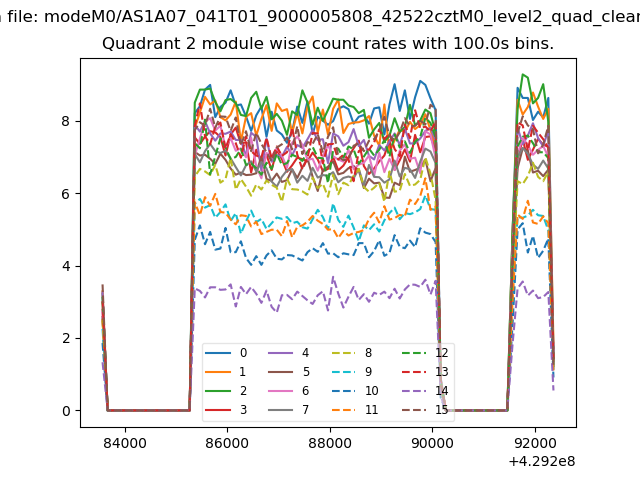
| Module-wise count rates for Quadrant B Data is divided into 100 sec bins |
 |
 |
| Module-wise count rates for Quadrant C Data is divided into 100 sec bins |
 |
 |
| Module-wise count rates for Quadrant D Data is divided into 100 sec bins |
 |
 |
| Parameter | Plot |
|---|---|
| CZT HV Monitor | 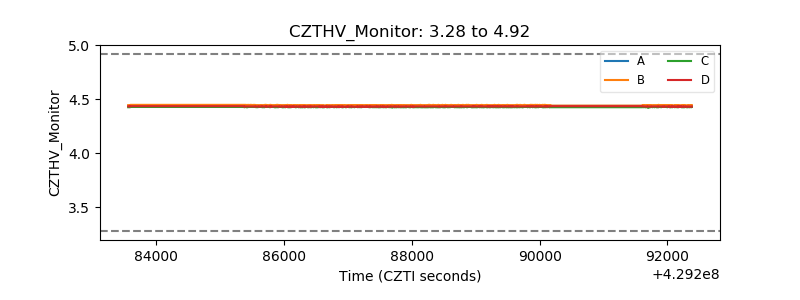 |
| D_VDD | 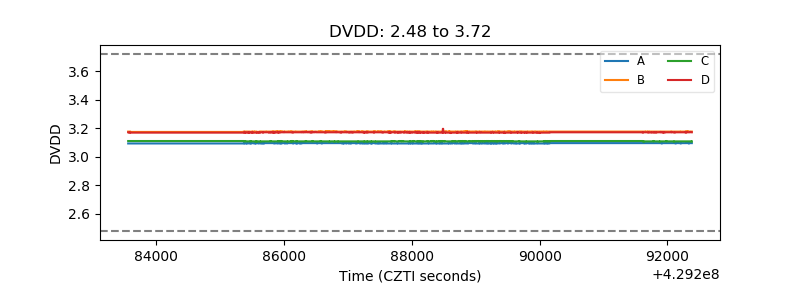 |
| Temperature 1 | 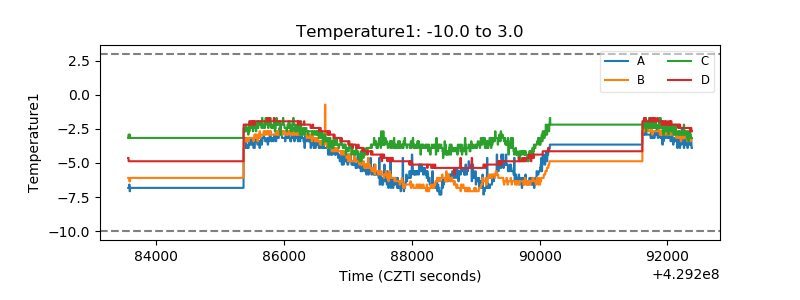 |
| Veto HV Monitor |  |
| Veto LLD | 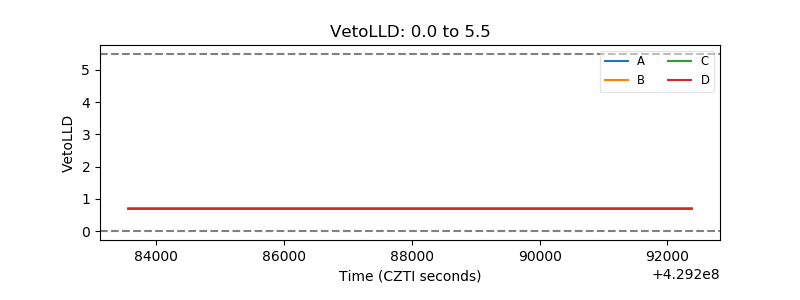 |
| Alpha Counter |  |
| _CPM_Rate | 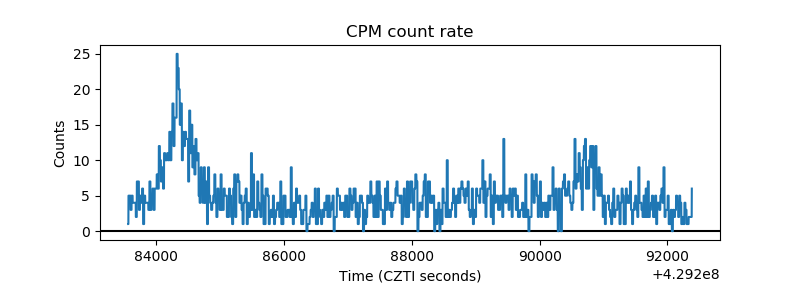 |
| CZT Counter | 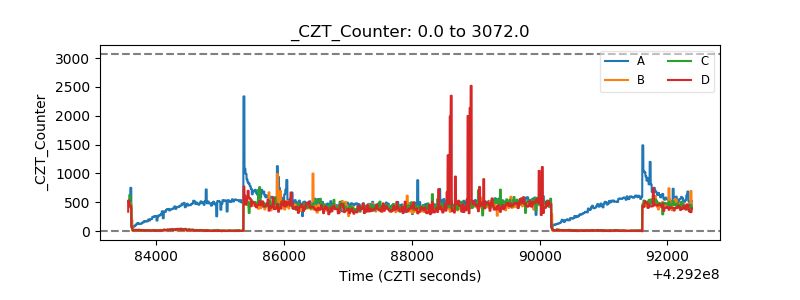 |
| +2.5 Volts monitor | 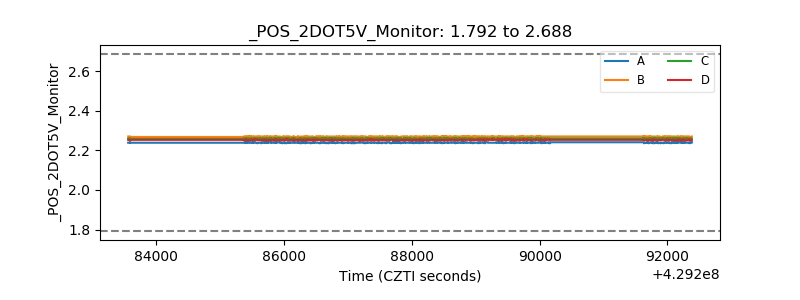 |
| +5 Volts monitor |  |
| _ROLL_ROT | 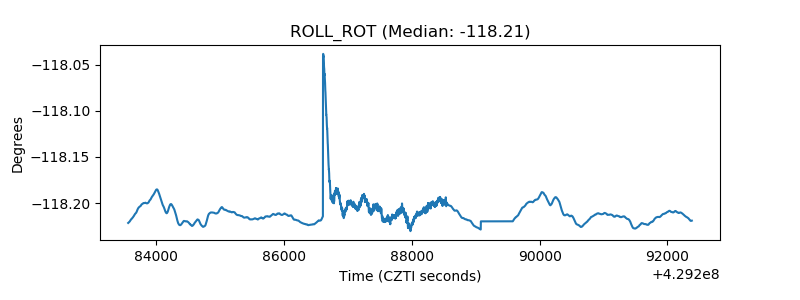 |
| _Roll_DEC | 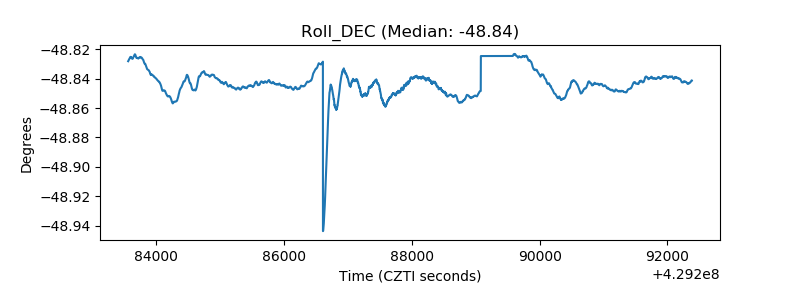 |
| _Roll_RA | 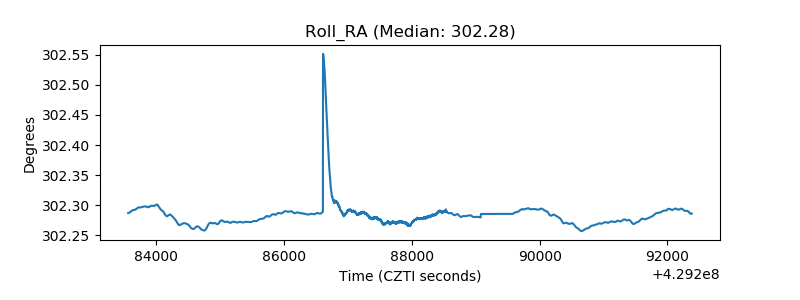 |
| Veto Counter | 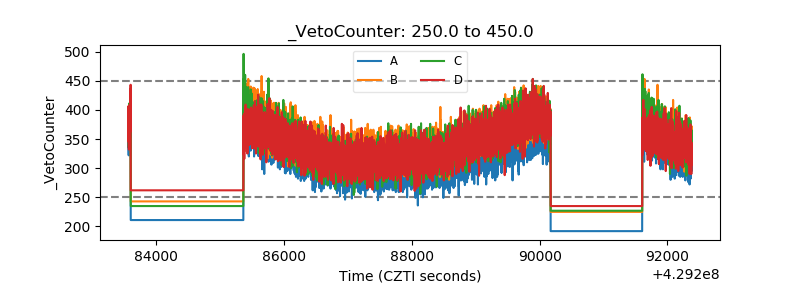 |