| Param | Original file | Final file |
|---|---|---|
| Filename | modeM0/AS1A07_041T01_9000005808_42523cztM0_level2.fits | modeM0/AS1A07_041T01_9000005808_42523cztM0_level2_quad_clean.evt |
| Size (bytes) | 358,387,200 | 104,549,760 |
| Size | 341.8 MB | 99.7 MB |
| Events in quadrant A | 3,338,889 | 694,818 |
| Events in quadrant B | 2,940,862 | 709,921 |
| Events in quadrant C | 3,535,115 | 681,918 |
| Events in quadrant D | 2,947,452 | 627,448 |
| Mode M0 | |||
|---|---|---|---|
| Quadrant | BADHDUFLAG | Total packets | Discarded packets |
| A | 0 | 13884 | 2 |
| B | 0 | 13324 | 2 |
| C | 0 | 14631 | 2 |
| D | 0 | 13844 | 2 |
| Mode SS | |||
|---|---|---|---|
| Quadrant | BADHDUFLAG | Total packets | Discarded packets |
| A | 0 | 134 | 0 |
| B | 0 | 134 | 0 |
| C | 0 | 134 | 0 |
| D | 0 | 134 | 0 |
| Mode M9 | |||
|---|---|---|---|
| Quadrant | BADHDUFLAG | Total packets | Discarded packets |
| A | 0 | 27 | 0 |
| B | 0 | 27 | 0 |
| C | 0 | 27 | 0 |
| D | 0 | 27 | 0 |
| Quadrant | Total seconds | Saturated seconds | Saturation percentage |
|---|---|---|---|
| A | 6471 | 17 | 0.262711% |
| B | 6471 | 24 | 0.370885% |
| C | 6472 | 49 | 0.757108% |
| D | 6472 | 74 | 1.143387% |
Noise dominated data is calculated using 1-second bins in cleaned event files. If a bin has >2000 counts, and if more than 50% of those come from <1% of pixels, then it is considered to be noise-dominated and hence unusable.
| Quadrant | # 1 sec bins | Bins with >0 counts | Bins with >2000 counts | High rate bins dominated by noise | Noise dominated (total time) | Noise dominated (detector-on time) | Marked lightcurve |
|---|---|---|---|---|---|---|---|
| A | 9217 | 6473 | 3 | 3 | 0.03% | 0.05% | 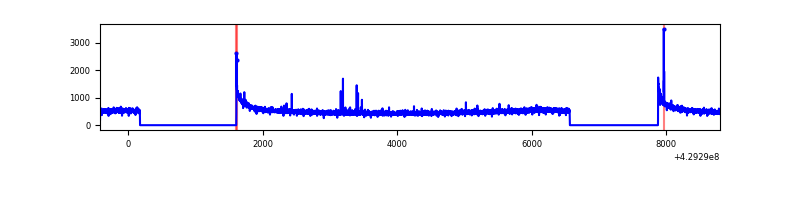 |
| B | 9217 | 6473 | 9 | 9 | 0.10% | 0.14% | 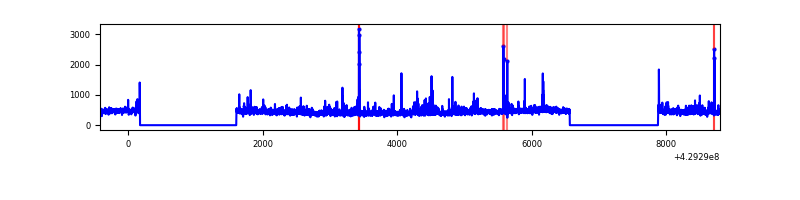 |
| C | 9218 | 6474 | 44 | 44 | 0.48% | 0.68% | 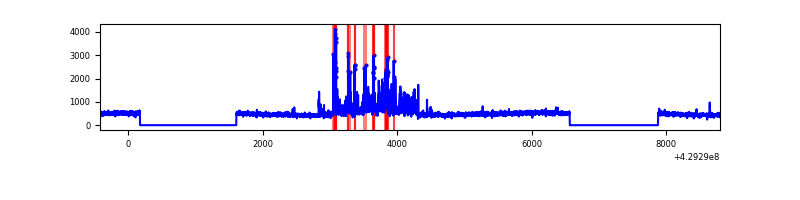 |
| D | 9218 | 6474 | 56 | 56 | 0.61% | 0.86% | 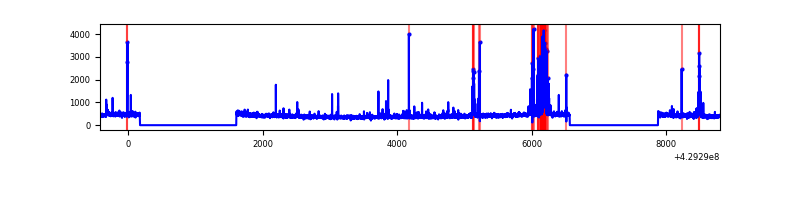 |
Top three noisy pixels from each quadrant. If the there are fewer than three noisy pixels in the level2.evt file, extra rows are filled as -1
| Pixel properties | Quadrant properties | ||||||
|---|---|---|---|---|---|---|---|
| Quadrant | DetID | PixID | Counts | Sigma | Mean | Median | Sigma |
| A | 10 | 83 | 617356 | 4283.61 | 694 | 679 | 144.0 |
| A | 13 | 248 | 11903 | 77.97 | 694 | 679 | 144.0 |
| A | 2 | 79 | 11083 | 72.27 | 694 | 679 | 144.0 |
| B | 0 | 245 | 118498 | 866.74 | 690 | 669 | 135.9 |
| B | 5 | 255 | 73511 | 535.82 | 690 | 669 | 135.9 |
| B | 5 | 172 | 38755 | 280.16 | 690 | 669 | 135.9 |
| C | 9 | 54 | 597925 | 3734.21 | 679 | 683 | 159.9 |
| C | 15 | 214 | 288174 | 1797.52 | 679 | 683 | 159.9 |
| C | 13 | 61 | 4432 | 23.44 | 679 | 683 | 159.9 |
| D | 12 | 6 | 272064 | 1622.59 | 676 | 656 | 167.3 |
| D | 9 | 19 | 37599 | 220.86 | 676 | 656 | 167.3 |
| D | 2 | 234 | 28130 | 164.25 | 676 | 656 | 167.3 |
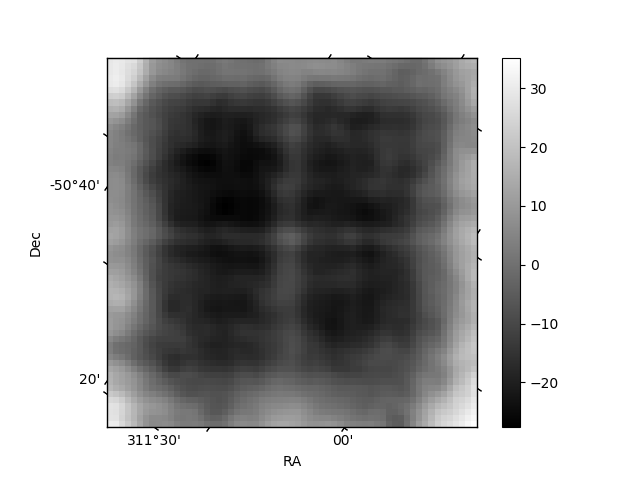
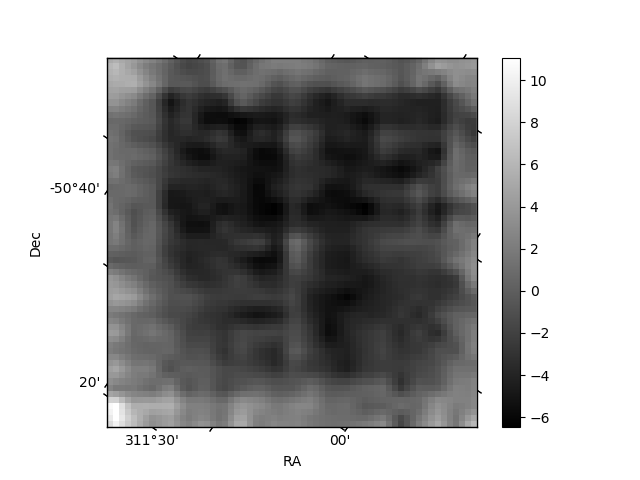
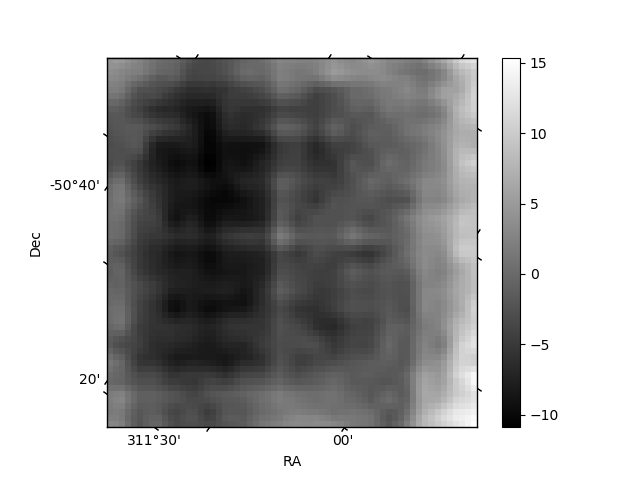
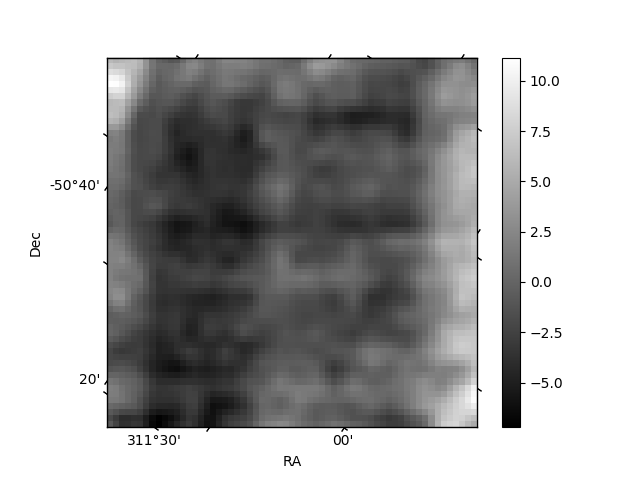
Histogram calculated using DETX and DETY for each event in the final _common_clean file
| Quadrant A | 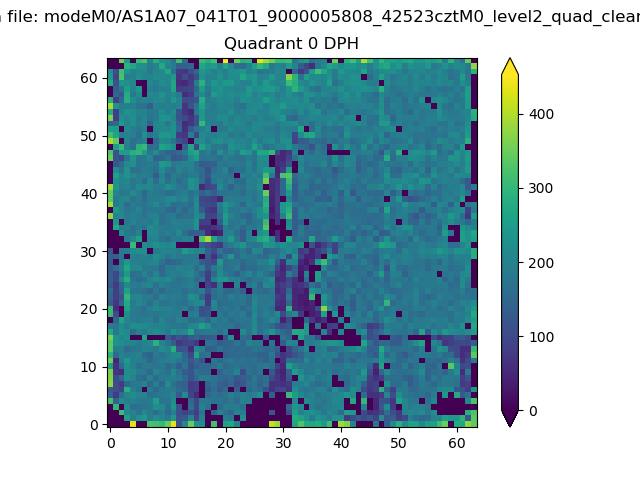 |
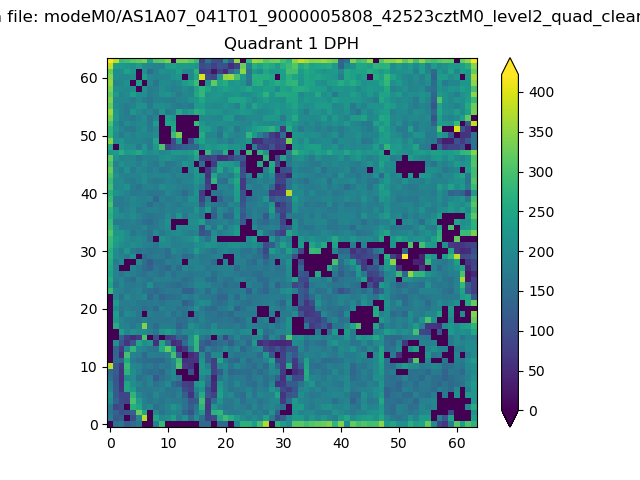 |
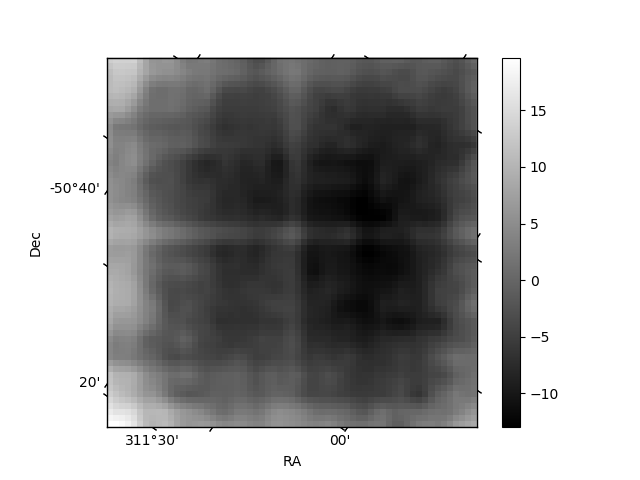
Quadrant B |
|---|---|---|---|
| Quadrant D | 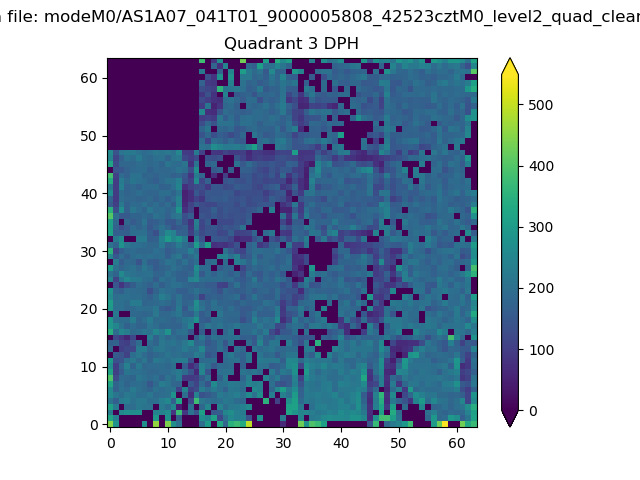 |
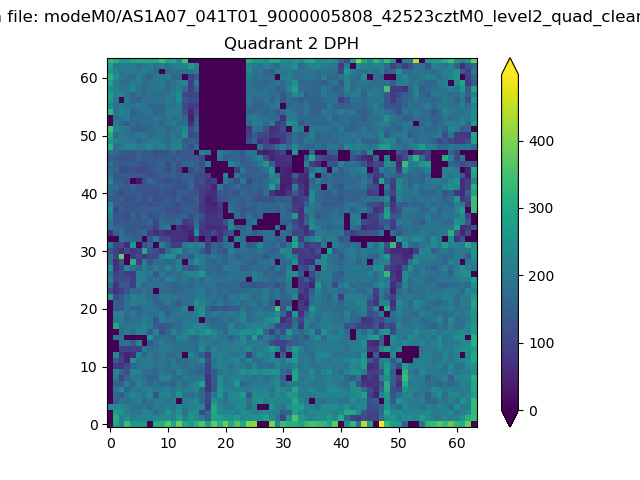 |
Quadrant C |
| Plot type | Count rate plots | Images |
|---|---|---|
| Comparison with Poisson distribution Blue bars denote a histogram of data divided into 1 sec bins. Red curve is a Poisson curve with rate = median count rate of data. |
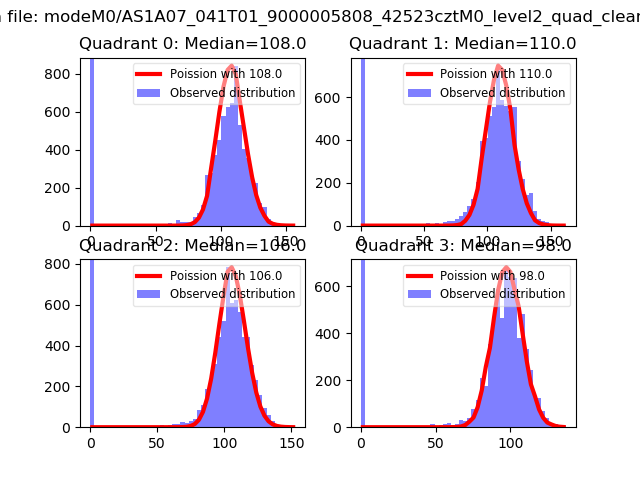 |
 |
| Quadrant-wise count rates Data is divided into 100 sec bins |
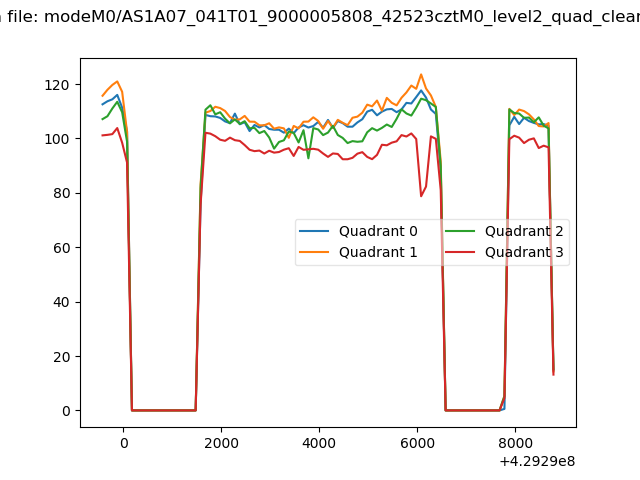 |
|
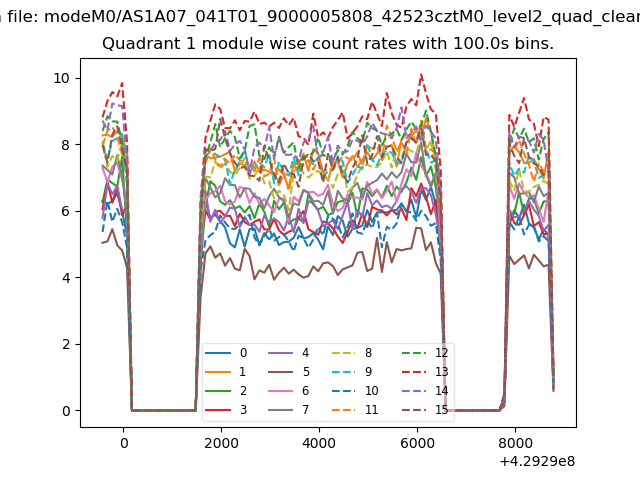
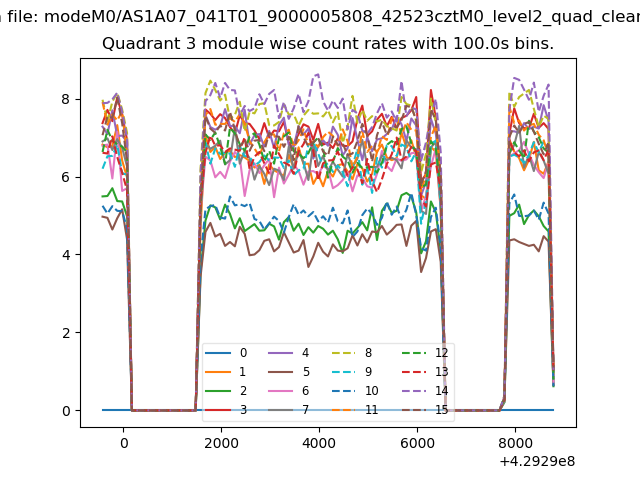
| Module-wise count rates for Quadrant A Data is divided into 100 sec bins |
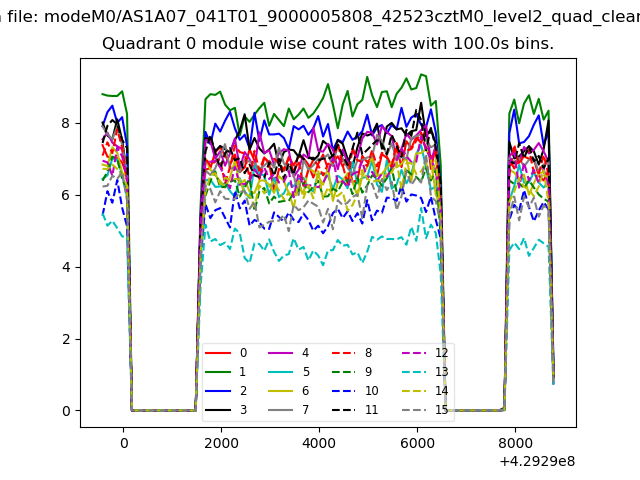 |
 |
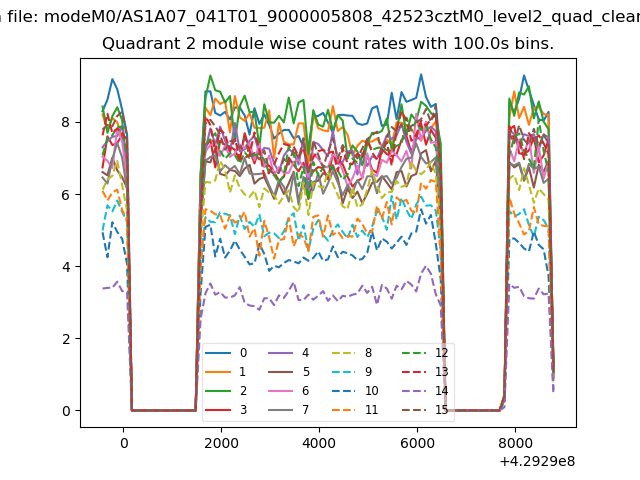
| Module-wise count rates for Quadrant B Data is divided into 100 sec bins |
 |
 |
| Module-wise count rates for Quadrant C Data is divided into 100 sec bins |
 |
 |
| Module-wise count rates for Quadrant D Data is divided into 100 sec bins |
 |
 |
| Parameter | Plot |
|---|---|
| CZT HV Monitor |  |
| D_VDD | 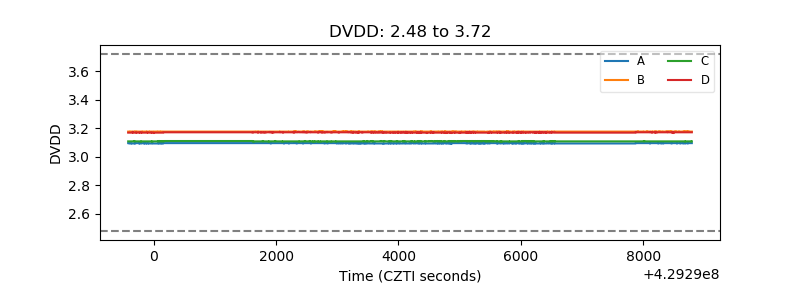 |
| Temperature 1 | 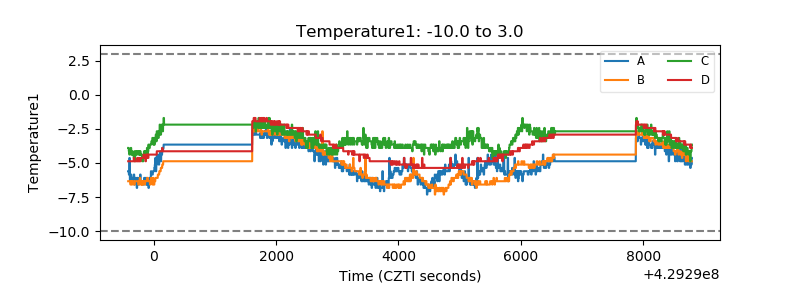 |
| Veto HV Monitor | 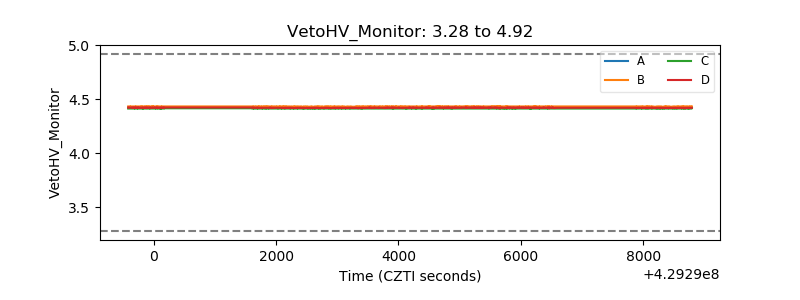 |
| Veto LLD | 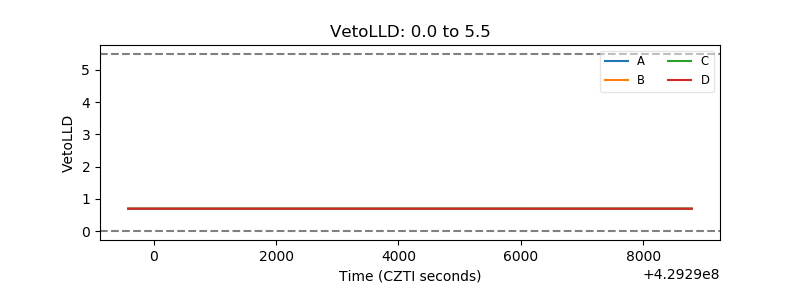 |
| Alpha Counter | 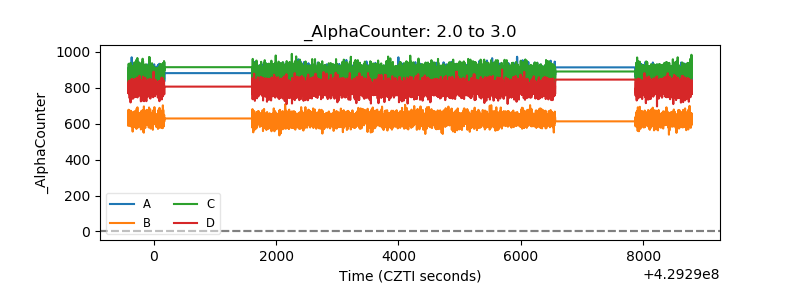 |
| _CPM_Rate | 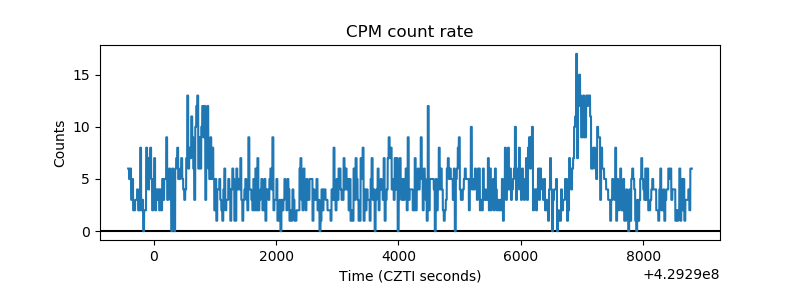 |
| CZT Counter | 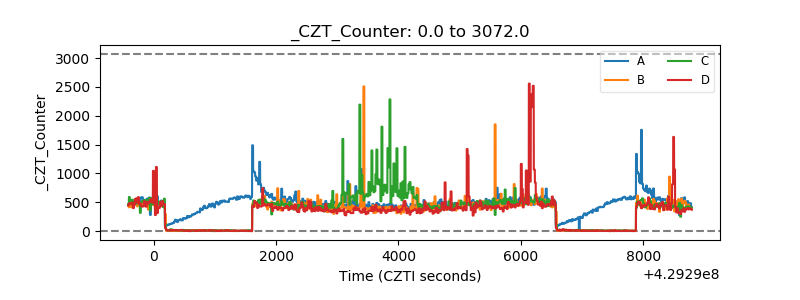 |
| +2.5 Volts monitor | 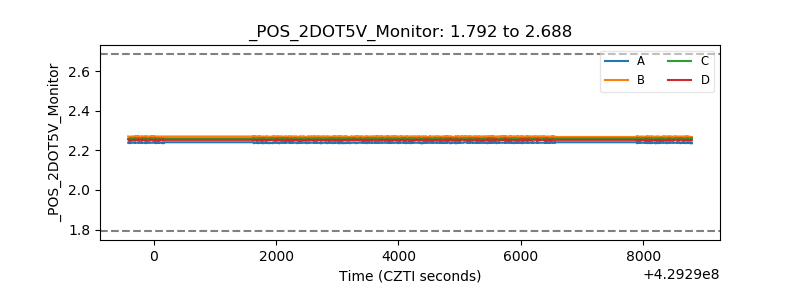 |
| +5 Volts monitor | 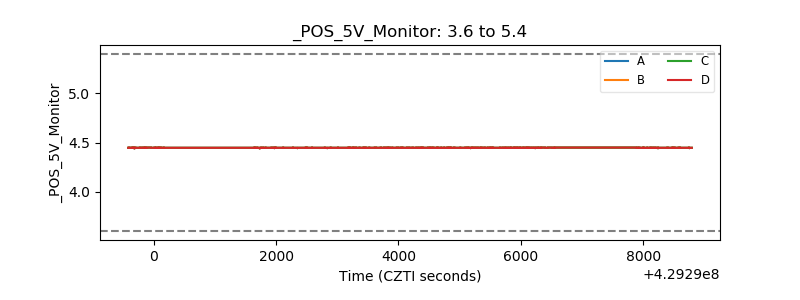 |
| _ROLL_ROT |  |
| _Roll_DEC | 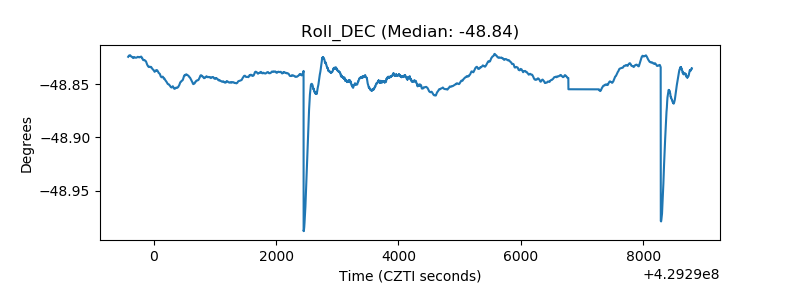 |
| _Roll_RA | 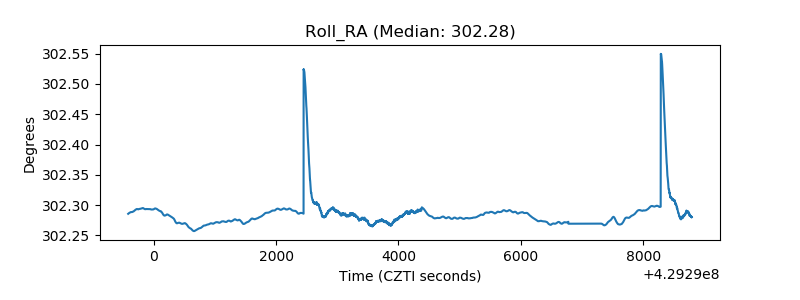 |
| Veto Counter | 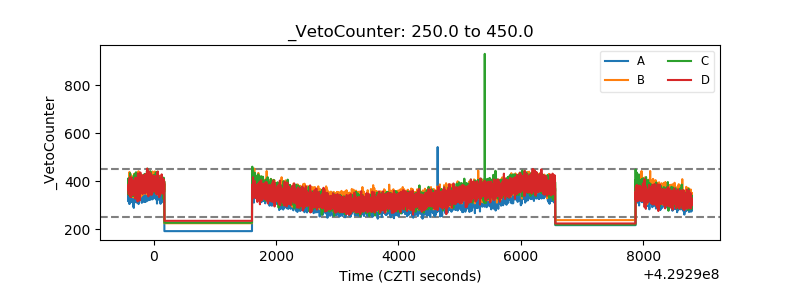 |