| Param | Original file | Final file |
|---|---|---|
| Filename | modeM0/AS1A07_041T01_9000005808_42526cztM0_level2.fits | modeM0/AS1A07_041T01_9000005808_42526cztM0_level2_quad_clean.evt |
| Size (bytes) | 965,617,920 | 243,541,440 |
| Size | 920.9 MB | 232.3 MB |
| Events in quadrant A | 7,840,661 | 1,640,468 |
| Events in quadrant B | 6,826,819 | 1,678,385 |
| Events in quadrant C | 12,848,844 | 1,499,631 |
| Events in quadrant D | 7,025,532 | 1,484,785 |
| Mode M0 | |||
|---|---|---|---|
| Quadrant | BADHDUFLAG | Total packets | Discarded packets |
| A | 0 | 33061 | 4 |
| B | 0 | 31717 | 4 |
| C | 0 | 48517 | 4 |
| D | 0 | 32891 | 4 |
| Mode SS | |||
|---|---|---|---|
| Quadrant | BADHDUFLAG | Total packets | Discarded packets |
| A | 0 | 316 | 0 |
| B | 0 | 316 | 0 |
| C | 0 | 316 | 0 |
| D | 0 | 316 | 0 |
| Mode M9 | |||
|---|---|---|---|
| Quadrant | BADHDUFLAG | Total packets | Discarded packets |
| A | 0 | 47 | 0 |
| B | 0 | 48 | 0 |
| C | 0 | 48 | 0 |
| D | 0 | 48 | 0 |
| Quadrant | Total seconds | Saturated seconds | Saturation percentage |
|---|---|---|---|
| A | 15514 | 32 | 0.206265% |
| B | 15514 | 45 | 0.290061% |
| C | 15513 | 1213 | 7.819248% |
| D | 15513 | 87 | 0.560820% |
Noise dominated data is calculated using 1-second bins in cleaned event files. If a bin has >2000 counts, and if more than 50% of those come from <1% of pixels, then it is considered to be noise-dominated and hence unusable.
| Quadrant | # 1 sec bins | Bins with >0 counts | Bins with >2000 counts | High rate bins dominated by noise | Noise dominated (total time) | Noise dominated (detector-on time) | Marked lightcurve |
|---|---|---|---|---|---|---|---|
| A | 19692 | 15517 | 7 | 7 | 0.04% | 0.05% | 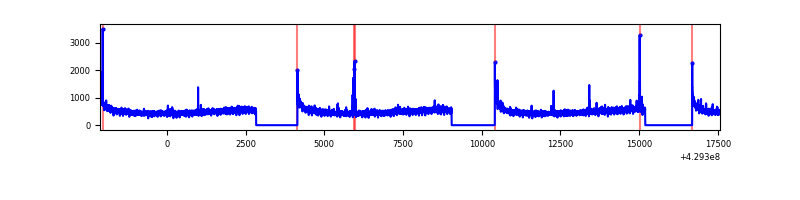 |
| B | 19692 | 15517 | 27 | 27 | 0.14% | 0.17% | 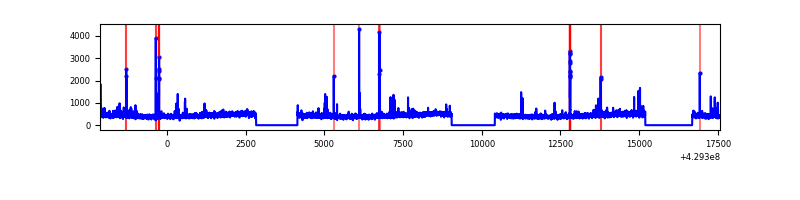 |
| C | 19691 | 15516 | 1031 | 1031 | 5.24% | 6.64% | 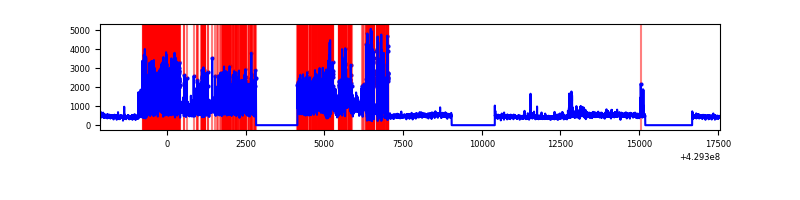 |
| D | 19691 | 15516 | 74 | 74 | 0.38% | 0.48% | 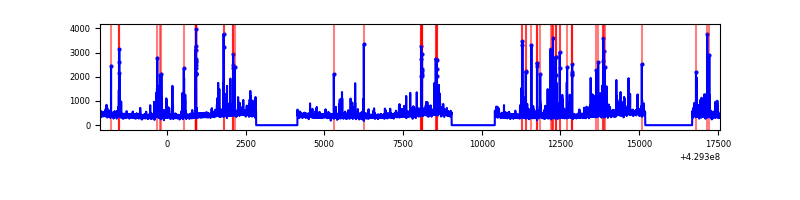 |
Top three noisy pixels from each quadrant. If the there are fewer than three noisy pixels in the level2.evt file, extra rows are filled as -1
| Pixel properties | Quadrant properties | ||||||
|---|---|---|---|---|---|---|---|
| Quadrant | DetID | PixID | Counts | Sigma | Mean | Median | Sigma |
| A | 10 | 83 | 1345809 | 3963.83 | 1655 | 1621 | 339.1 |
| A | 7 | 3 | 36065 | 101.57 | 1655 | 1621 | 339.1 |
| A | 13 | 248 | 32638 | 91.46 | 1655 | 1621 | 339.1 |
| B | 0 | 245 | 185387 | 573.83 | 1646 | 1596 | 320.3 |
| B | 5 | 172 | 120744 | 372.0 | 1646 | 1596 | 320.3 |
| B | 5 | 255 | 61930 | 188.37 | 1646 | 1596 | 320.3 |
| C | 9 | 54 | 5766105 | 15556.16 | 1588 | 1595 | 370.6 |
| C | 15 | 214 | 661217 | 1780.06 | 1588 | 1595 | 370.6 |
| C | 0 | 239 | 223679 | 599.32 | 1588 | 1595 | 370.6 |
| D | 12 | 6 | 342909 | 870.97 | 1615 | 1574 | 391.9 |
| D | 2 | 249 | 210358 | 532.75 | 1615 | 1574 | 391.9 |
| D | 1 | 47 | 120649 | 303.84 | 1615 | 1574 | 391.9 |
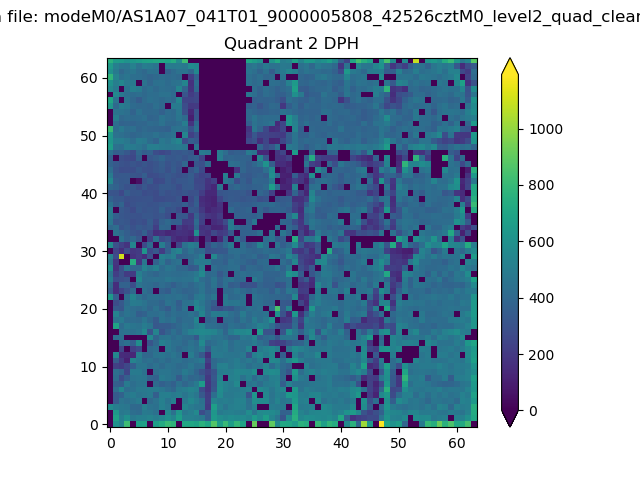
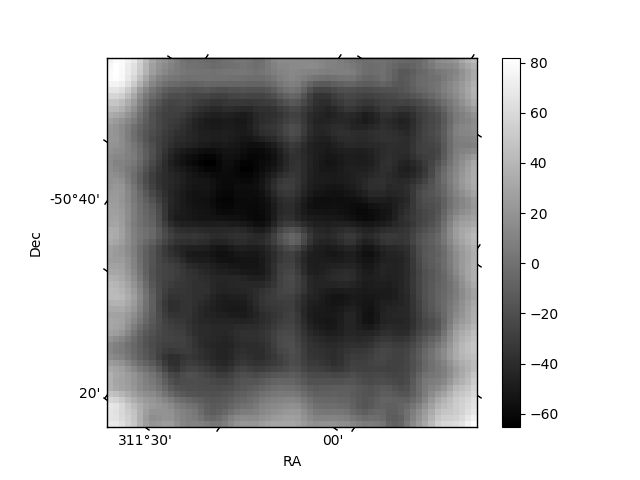
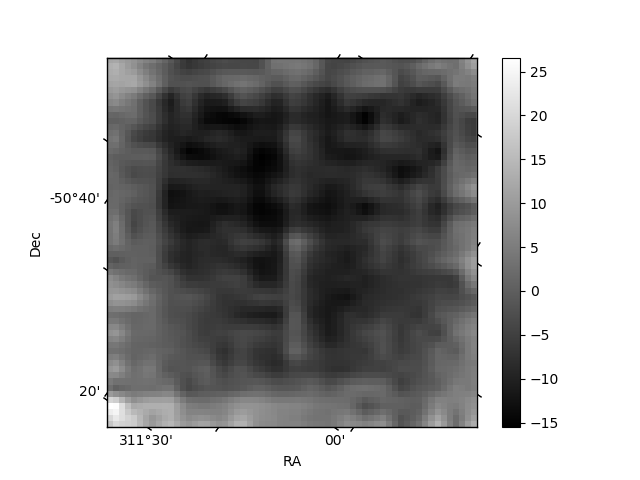
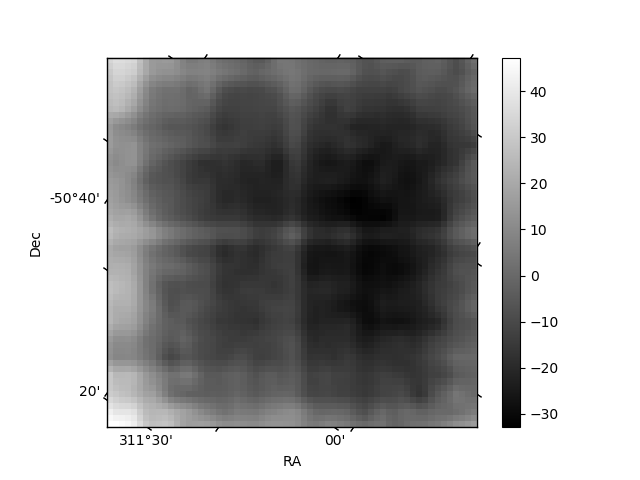
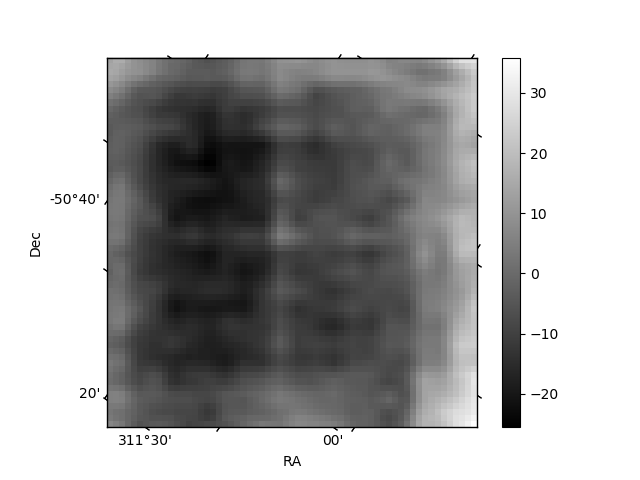
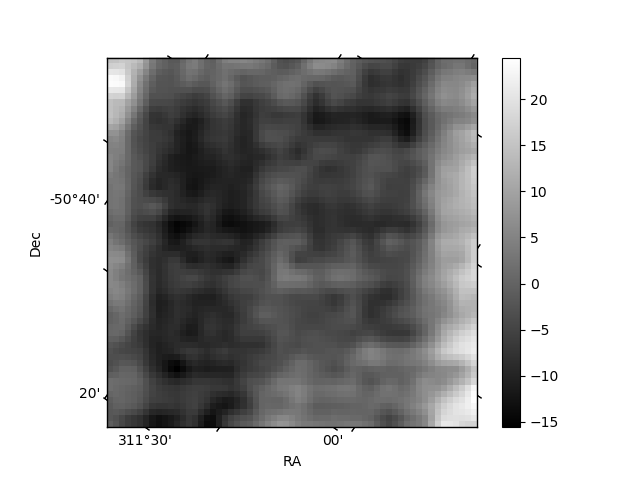
Histogram calculated using DETX and DETY for each event in the final _common_clean file
| Quadrant A | 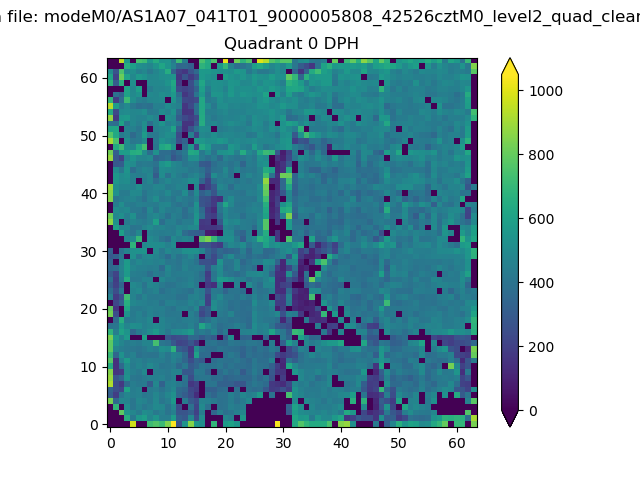 |
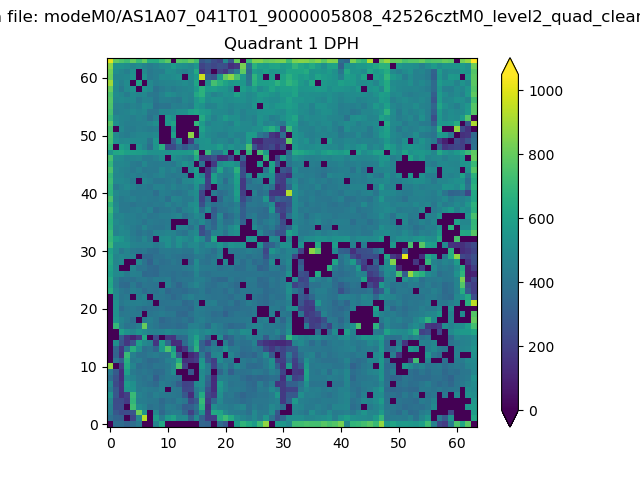 |
Quadrant B |
|---|---|---|---|
| Quadrant D | 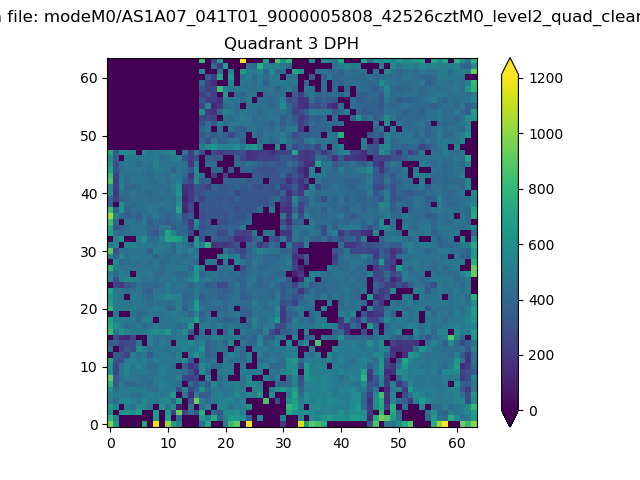 |
 |
Quadrant C |
| Plot type | Count rate plots | Images |
|---|---|---|
| Comparison with Poisson distribution Blue bars denote a histogram of data divided into 1 sec bins. Red curve is a Poisson curve with rate = median count rate of data. |
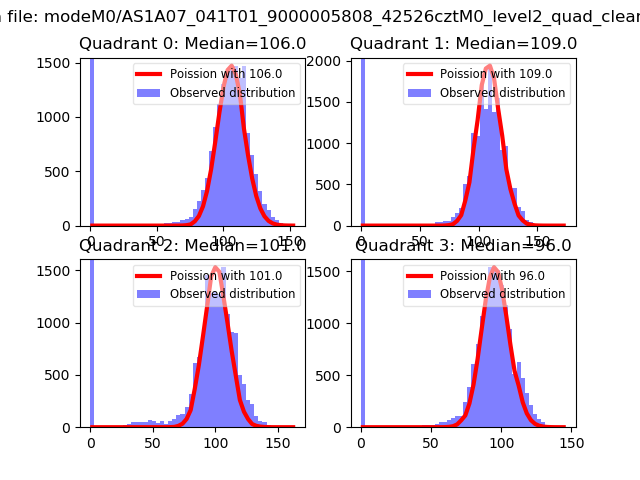 |
 |
| Quadrant-wise count rates Data is divided into 100 sec bins |
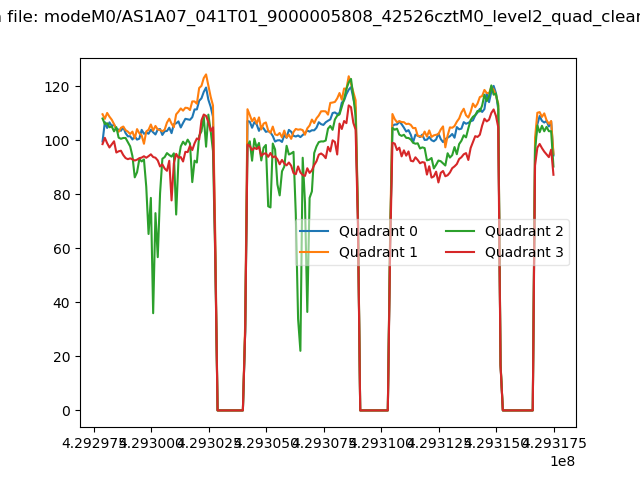 |
|
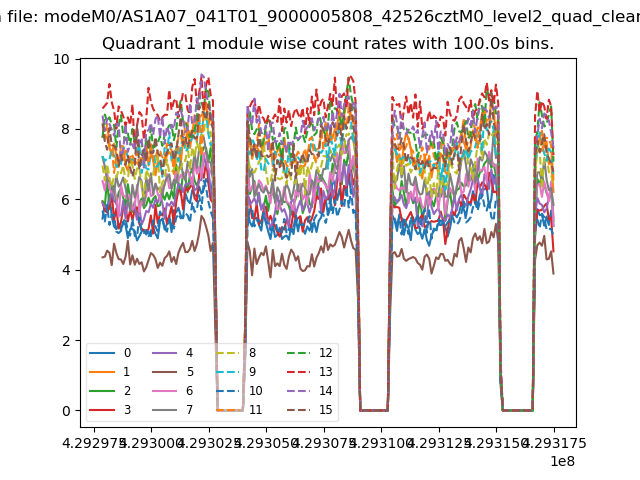
| Module-wise count rates for Quadrant A Data is divided into 100 sec bins |
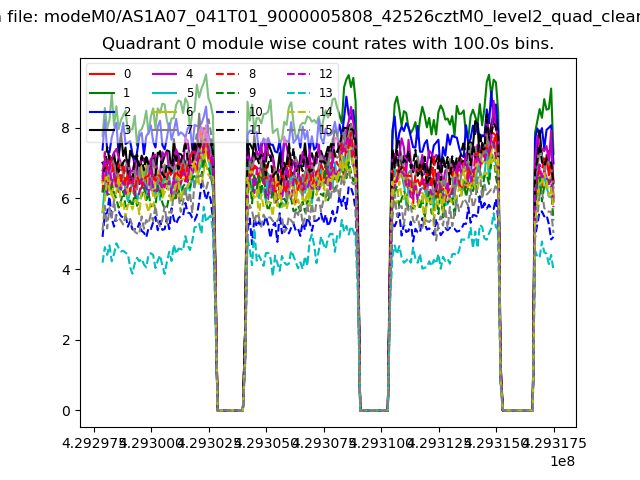 |
 |
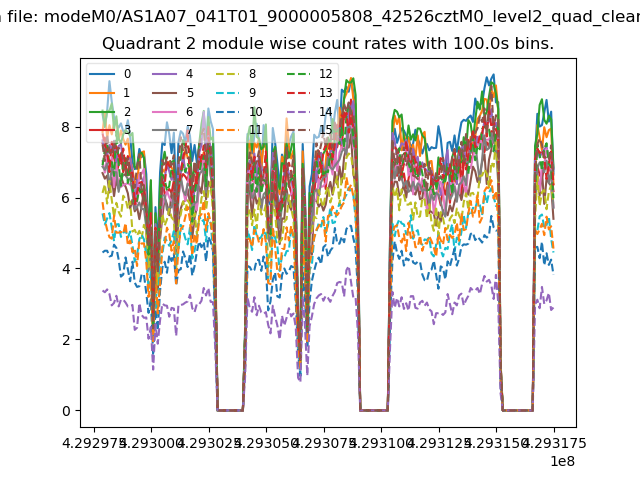
| Module-wise count rates for Quadrant B Data is divided into 100 sec bins |
 |
 |
| Module-wise count rates for Quadrant C Data is divided into 100 sec bins |
 |
 |
| Module-wise count rates for Quadrant D Data is divided into 100 sec bins |
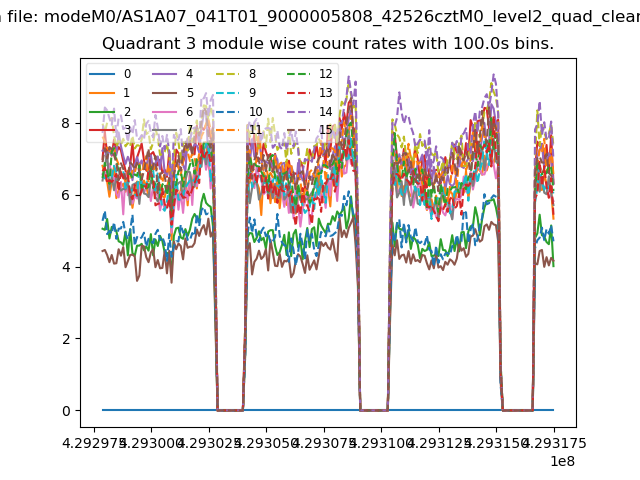 |
 |
| Parameter | Plot |
|---|---|
| CZT HV Monitor | 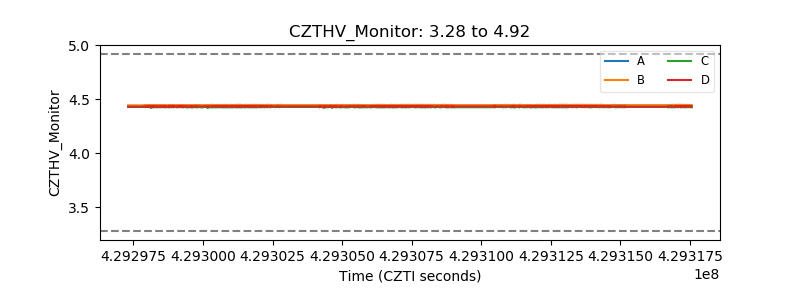 |
| D_VDD | 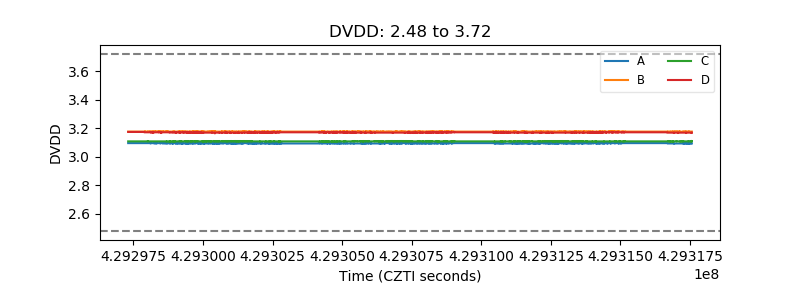 |
| Temperature 1 | 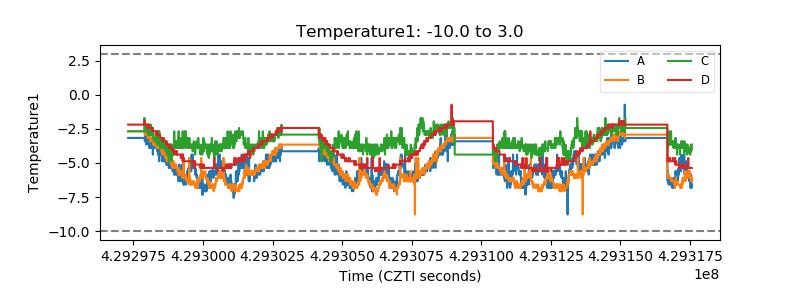 |
| Veto HV Monitor | 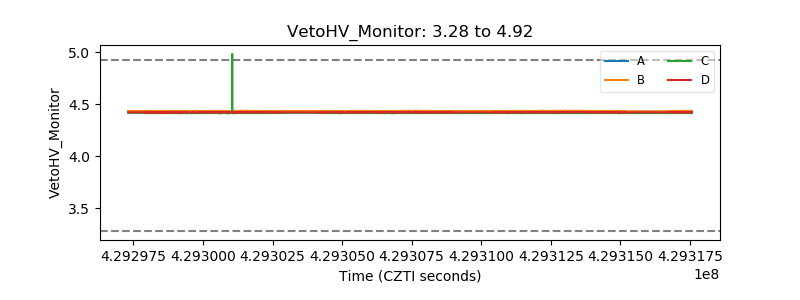 |
| Veto LLD | 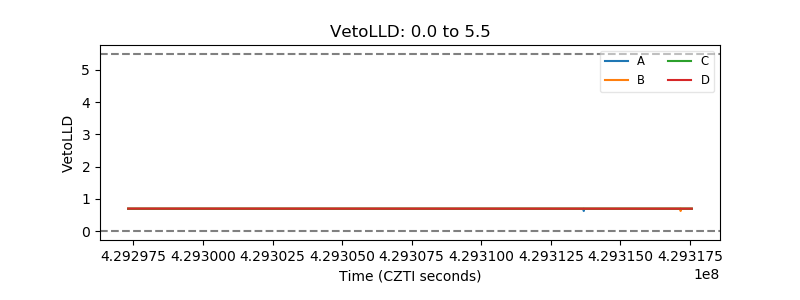 |
| Alpha Counter | 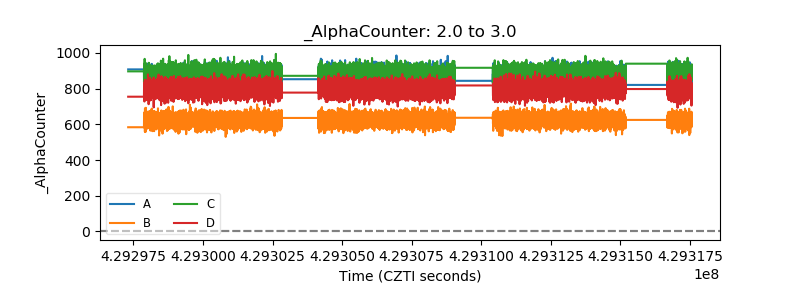 |
| _CPM_Rate | 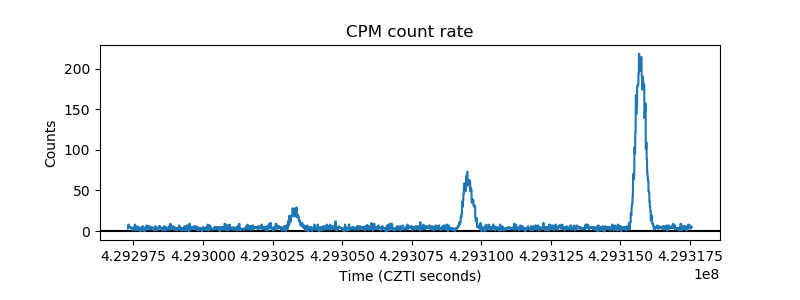 |
| CZT Counter | 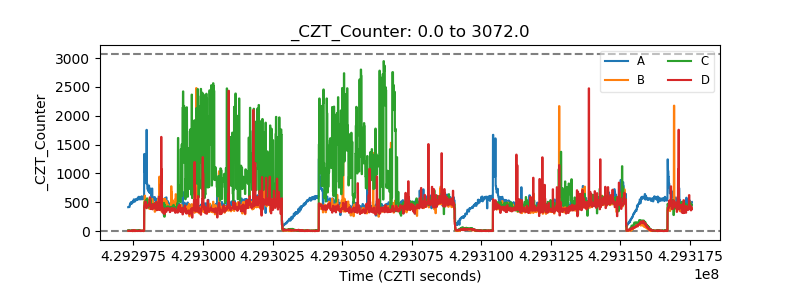 |
| +2.5 Volts monitor | 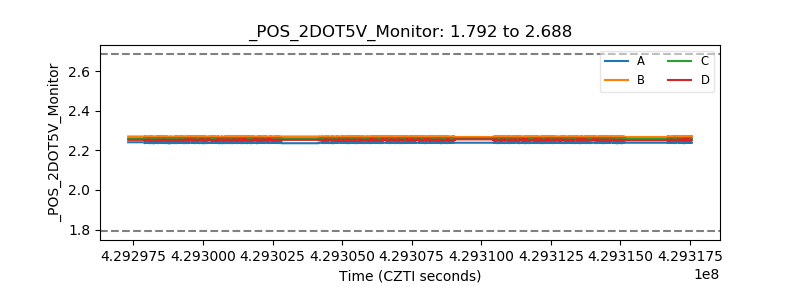 |
| +5 Volts monitor | 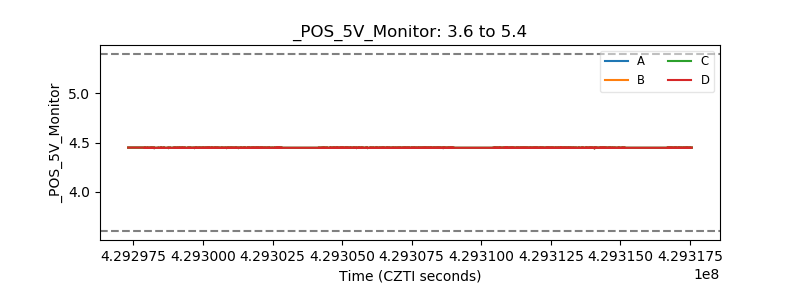 |
| _ROLL_ROT | 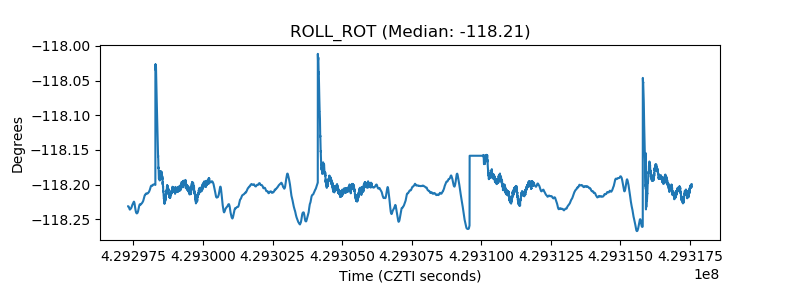 |
| _Roll_DEC | 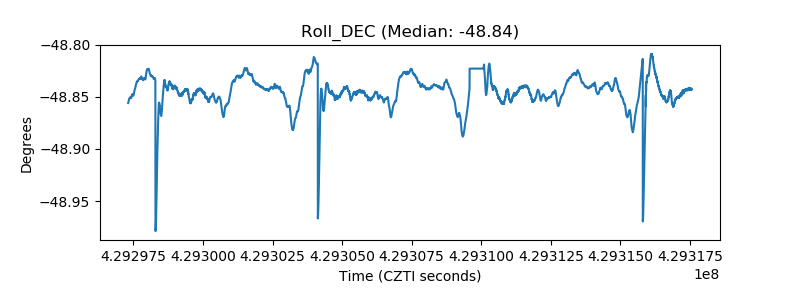 |
| _Roll_RA | 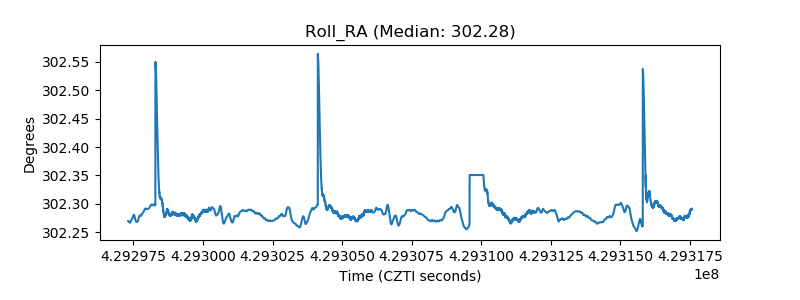 |
| Veto Counter | 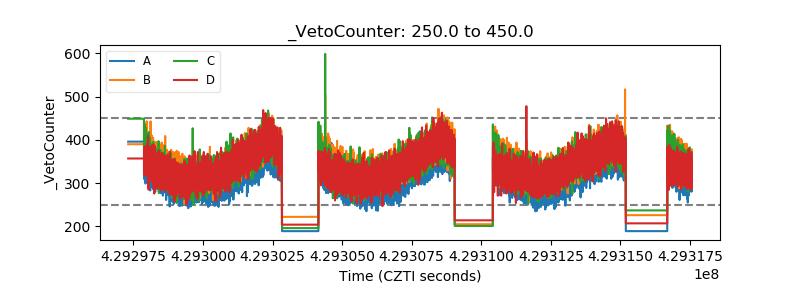 |