| Param | Original file | Final file |
|---|---|---|
| Filename | modeM0/AS1A07_041T01_9000005808_42527cztM0_level2.fits | modeM0/AS1A07_041T01_9000005808_42527cztM0_level2_quad_clean.evt |
| Size (bytes) | 315,527,040 | 94,829,760 |
| Size | 300.9 MB | 90.4 MB |
| Events in quadrant A | 3,055,459 | 628,234 |
| Events in quadrant B | 2,640,290 | 642,693 |
| Events in quadrant C | 2,718,431 | 620,812 |
| Events in quadrant D | 2,809,556 | 570,834 |
| Mode M0 | |||
|---|---|---|---|
| Quadrant | BADHDUFLAG | Total packets | Discarded packets |
| A | 0 | 12683 | 2 |
| B | 0 | 12084 | 3 |
| C | 0 | 11880 | 2 |
| D | 0 | 12687 | 2 |
| Mode SS | |||
|---|---|---|---|
| Quadrant | BADHDUFLAG | Total packets | Discarded packets |
| A | 0 | 120 | 0 |
| B | 0 | 120 | 0 |
| C | 0 | 120 | 0 |
| D | 0 | 120 | 0 |
| Mode M9 | |||
|---|---|---|---|
| Quadrant | BADHDUFLAG | Total packets | Discarded packets |
| A | 0 | 31 | 0 |
| B | 0 | 31 | 0 |
| C | 0 | 31 | 0 |
| D | 0 | 31 | 0 |
| Quadrant | Total seconds | Saturated seconds | Saturation percentage |
|---|---|---|---|
| A | 5851 | 14 | 0.239275% |
| B | 5851 | 29 | 0.495642% |
| C | 5851 | 6 | 0.102547% |
| D | 5851 | 41 | 0.700735% |
Noise dominated data is calculated using 1-second bins in cleaned event files. If a bin has >2000 counts, and if more than 50% of those come from <1% of pixels, then it is considered to be noise-dominated and hence unusable.
| Quadrant | # 1 sec bins | Bins with >0 counts | Bins with >2000 counts | High rate bins dominated by noise | Noise dominated (total time) | Noise dominated (detector-on time) | Marked lightcurve |
|---|---|---|---|---|---|---|---|
| A | 8925 | 5853 | 4 | 4 | 0.04% | 0.07% | 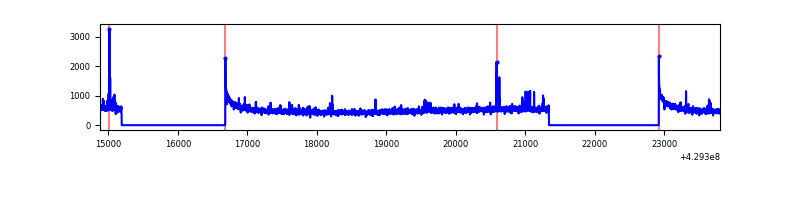 |
| B | 8925 | 5853 | 17 | 17 | 0.19% | 0.29% | 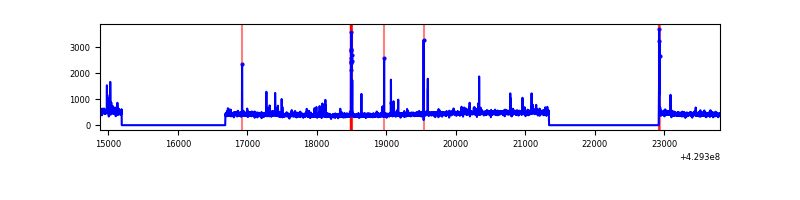 |
| C | 8925 | 5853 | 4 | 4 | 0.04% | 0.07% | 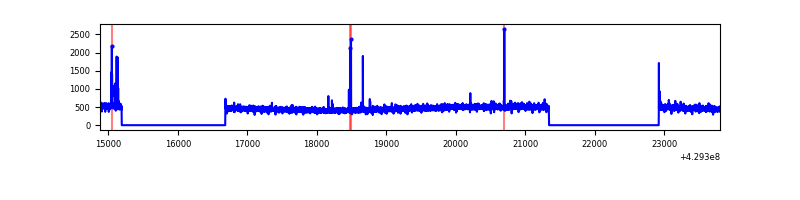 |
| D | 8925 | 5853 | 28 | 28 | 0.31% | 0.48% | 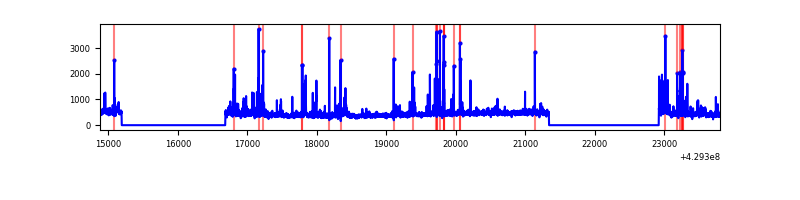 |
Top three noisy pixels from each quadrant. If the there are fewer than three noisy pixels in the level2.evt file, extra rows are filled as -1
| Pixel properties | Quadrant properties | ||||||
|---|---|---|---|---|---|---|---|
| Quadrant | DetID | PixID | Counts | Sigma | Mean | Median | Sigma |
| A | 10 | 83 | 551130 | 4268.46 | 628 | 614 | 129.0 |
| A | 13 | 248 | 34715 | 264.4 | 628 | 614 | 129.0 |
| A | 2 | 79 | 32655 | 248.43 | 628 | 614 | 129.0 |
| B | 5 | 255 | 123449 | 993.11 | 628 | 609 | 123.7 |
| B | 0 | 245 | 44517 | 354.98 | 628 | 609 | 123.7 |
| B | 12 | 111 | 15906 | 123.67 | 628 | 609 | 123.7 |
| C | 15 | 214 | 242947 | 1660.92 | 622 | 626 | 145.9 |
| C | 0 | 239 | 19260 | 127.72 | 622 | 626 | 145.9 |
| C | 14 | 254 | 18352 | 121.5 | 622 | 626 | 145.9 |
| D | 12 | 6 | 210861 | 1392.49 | 616 | 598 | 151.0 |
| D | 2 | 249 | 119979 | 790.61 | 616 | 598 | 151.0 |
| D | 1 | 47 | 62174 | 407.79 | 616 | 598 | 151.0 |
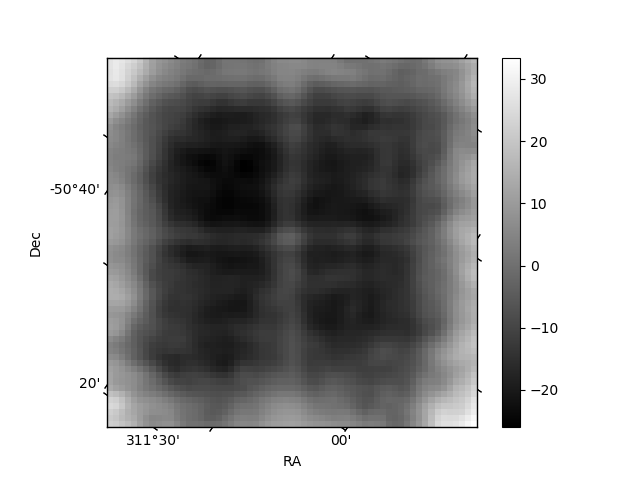
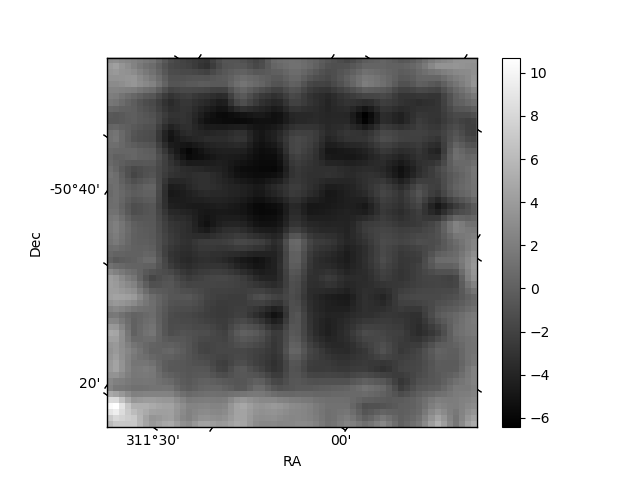
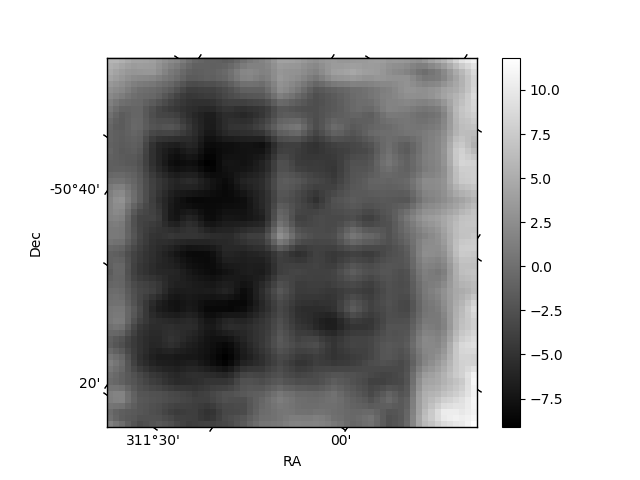
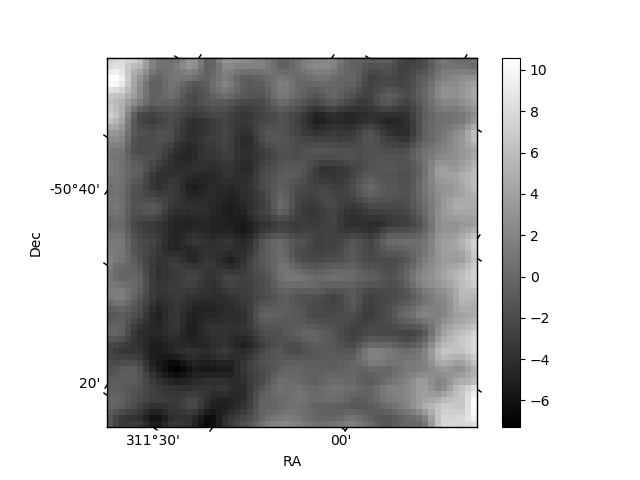
Histogram calculated using DETX and DETY for each event in the final _common_clean file
| Quadrant A | 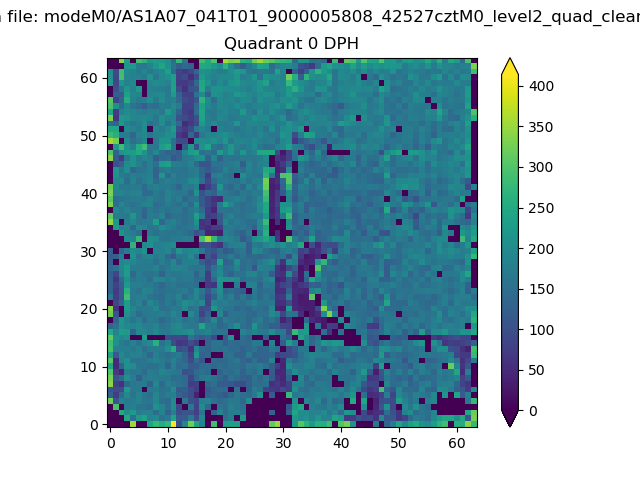 |
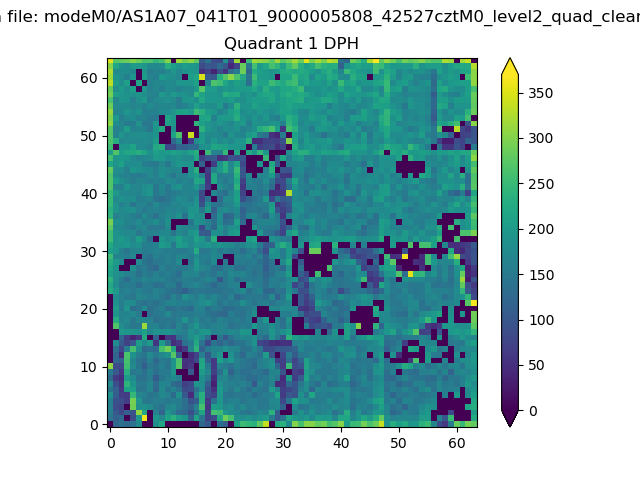 |
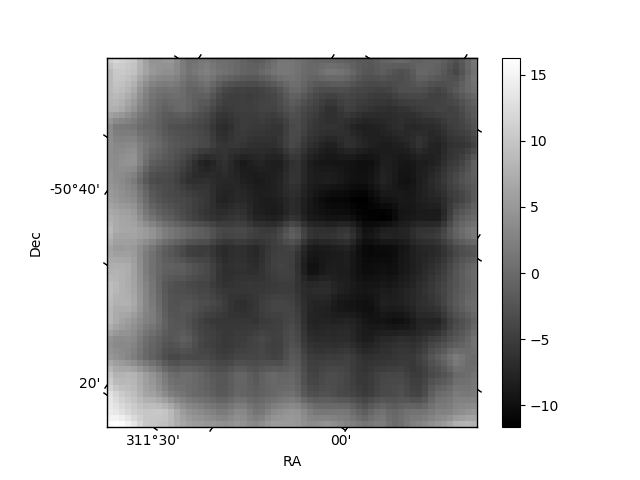
Quadrant B |
|---|---|---|---|
| Quadrant D | 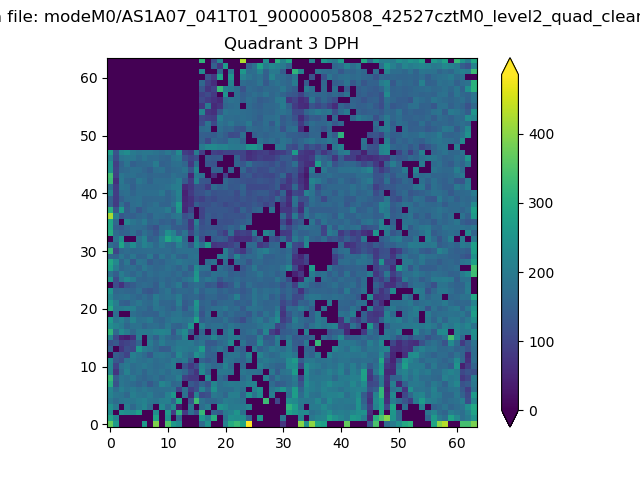 |
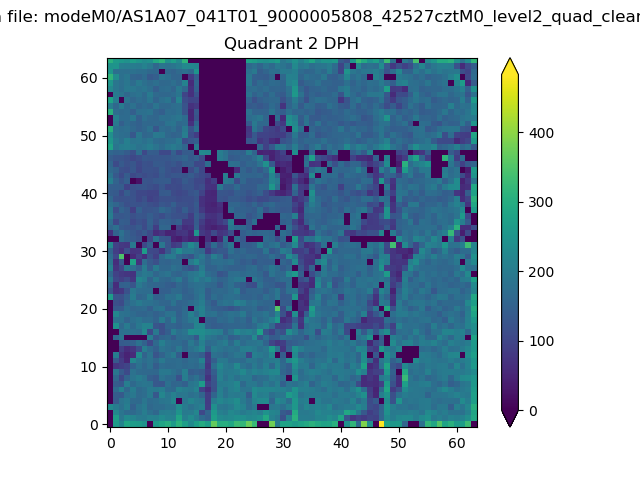 |
Quadrant C |
| Plot type | Count rate plots | Images |
|---|---|---|
| Comparison with Poisson distribution Blue bars denote a histogram of data divided into 1 sec bins. Red curve is a Poisson curve with rate = median count rate of data. |
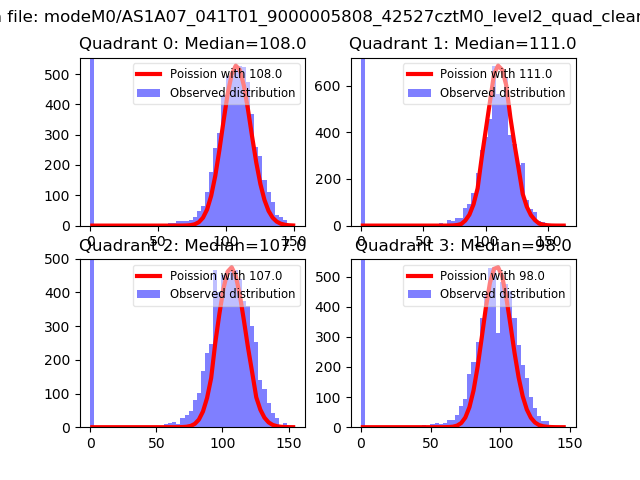 |
 |
| Quadrant-wise count rates Data is divided into 100 sec bins |
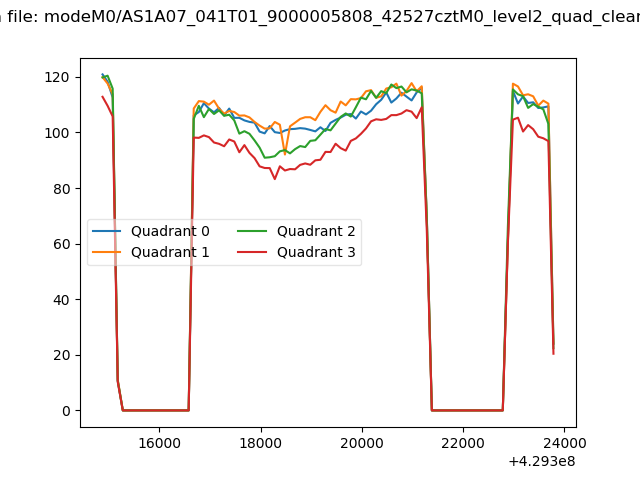 |
|
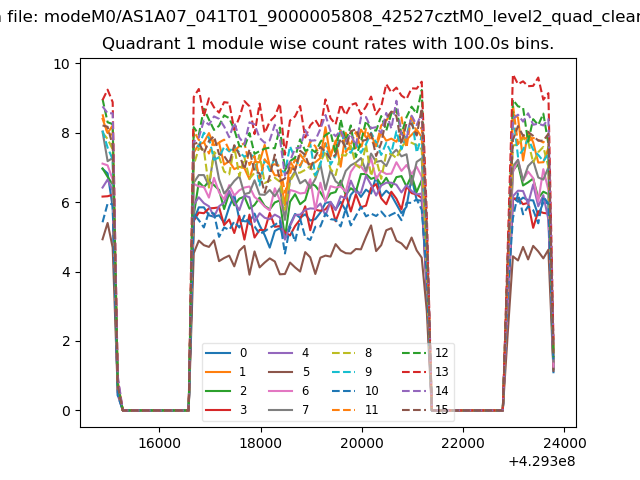
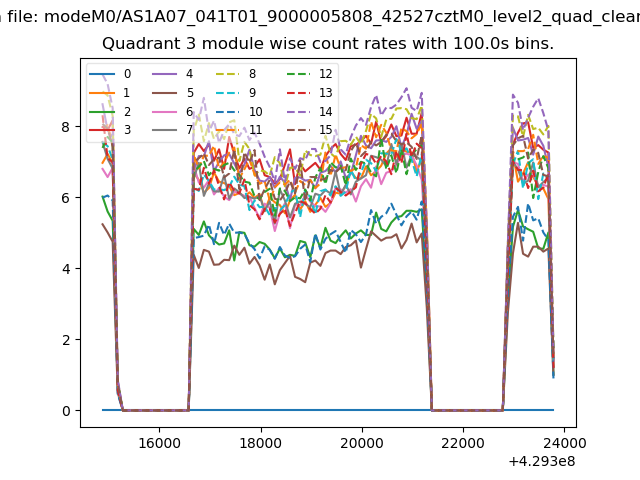
| Module-wise count rates for Quadrant A Data is divided into 100 sec bins |
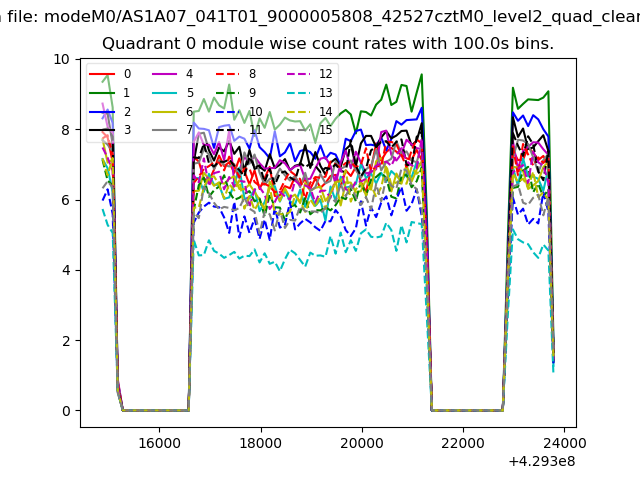 |
 |
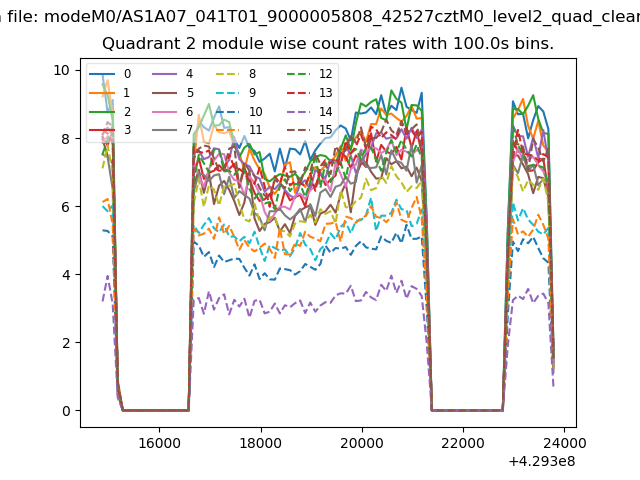
| Module-wise count rates for Quadrant B Data is divided into 100 sec bins |
 |
 |
| Module-wise count rates for Quadrant C Data is divided into 100 sec bins |
 |
 |
| Module-wise count rates for Quadrant D Data is divided into 100 sec bins |
 |
 |
| Parameter | Plot |
|---|---|
| CZT HV Monitor | 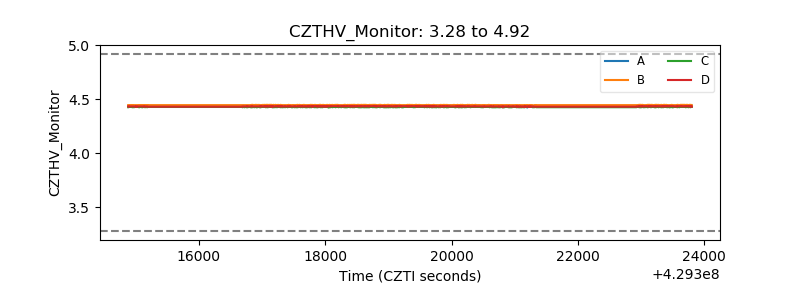 |
| D_VDD | 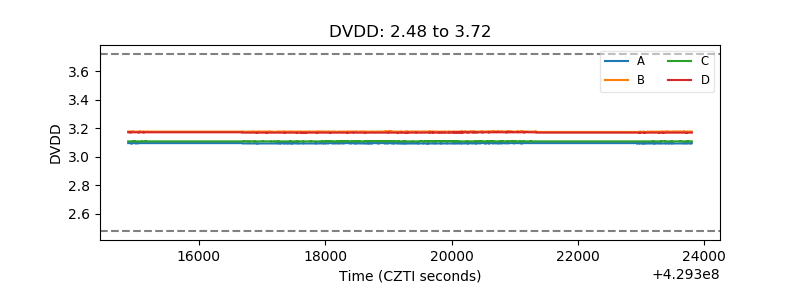 |
| Temperature 1 | 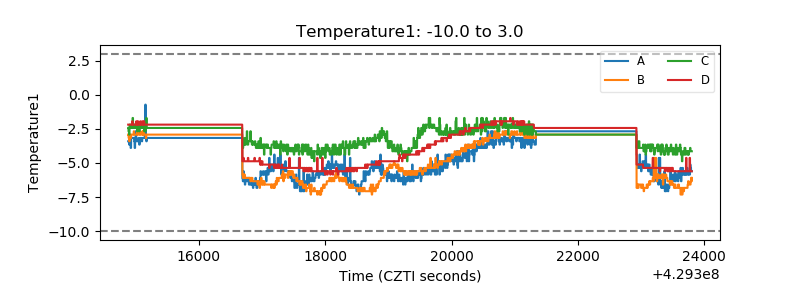 |
| Veto HV Monitor | 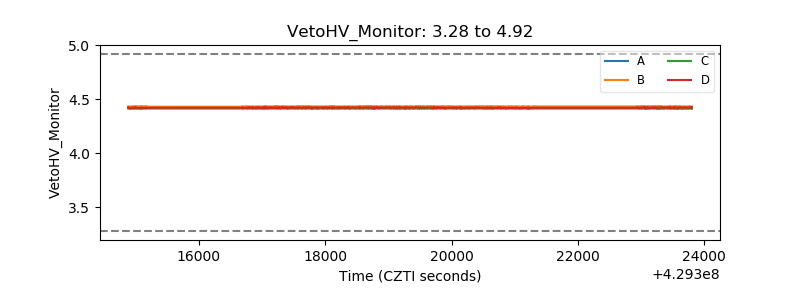 |
| Veto LLD | 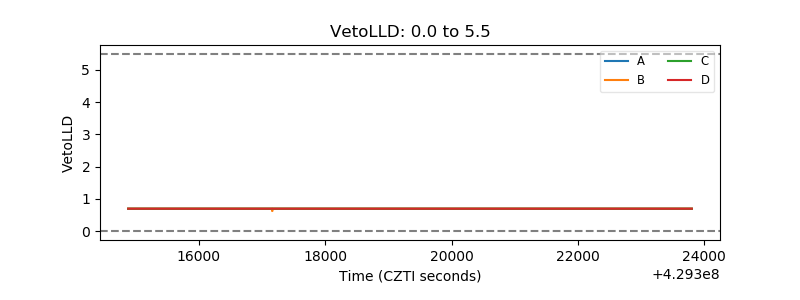 |
| Alpha Counter | 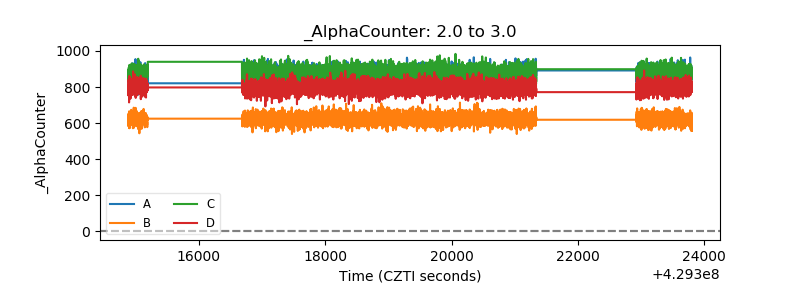 |
| _CPM_Rate | 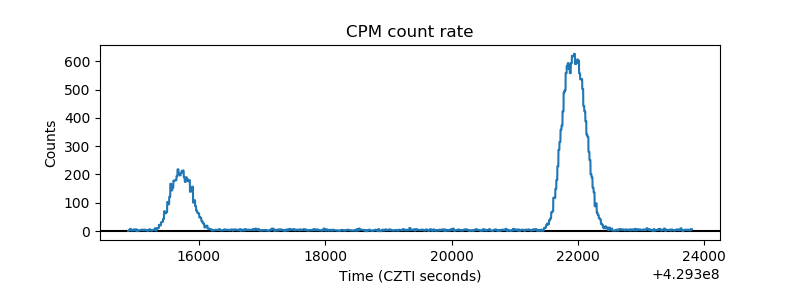 |
| CZT Counter | 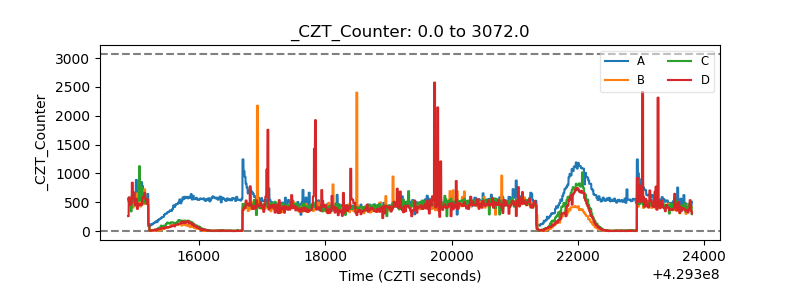 |
| +2.5 Volts monitor |  |
| +5 Volts monitor |  |
| _ROLL_ROT | 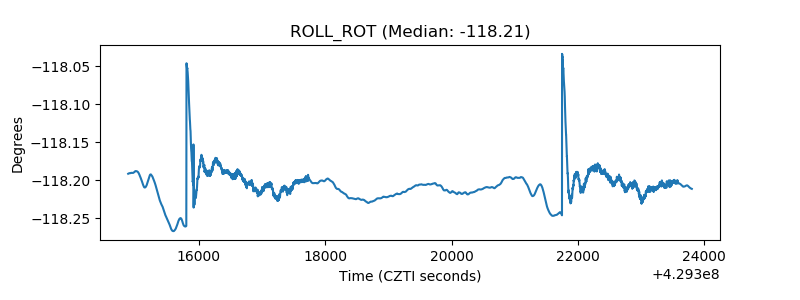 |
| _Roll_DEC | 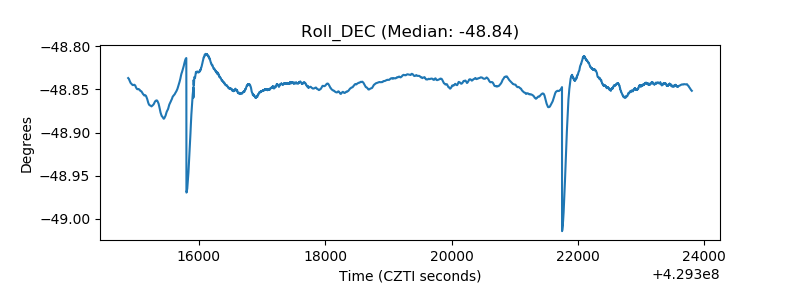 |
| _Roll_RA | 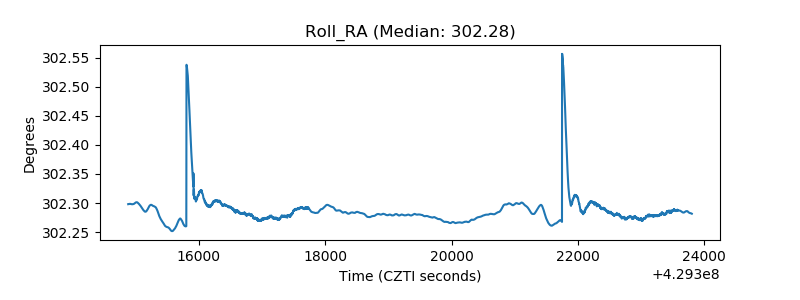 |
| Veto Counter | 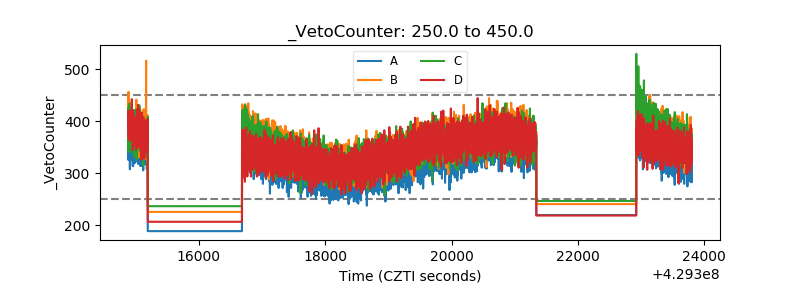 |