| Param | Original file | Final file |
|---|---|---|
| Filename | modeM0/AS1A07_041T01_9000005808_42529cztM0_level2.fits | modeM0/AS1A07_041T01_9000005808_42529cztM0_level2_quad_clean.evt |
| Size (bytes) | 297,774,720 | 89,115,840 |
| Size | 284.0 MB | 85.0 MB |
| Events in quadrant A | 2,841,638 | 591,182 |
| Events in quadrant B | 2,417,588 | 611,165 |
| Events in quadrant C | 2,520,033 | 584,587 |
| Events in quadrant D | 2,819,847 | 531,665 |
| Mode M0 | |||
|---|---|---|---|
| Quadrant | BADHDUFLAG | Total packets | Discarded packets |
| A | 0 | 11715 | 2 |
| B | 0 | 11148 | 2 |
| C | 0 | 10962 | 2 |
| D | 0 | 12423 | 2 |
| Mode SS | |||
|---|---|---|---|
| Quadrant | BADHDUFLAG | Total packets | Discarded packets |
| A | 0 | 110 | 0 |
| B | 0 | 110 | 0 |
| C | 0 | 110 | 0 |
| D | 0 | 110 | 0 |
| Mode M9 | |||
|---|---|---|---|
| Quadrant | BADHDUFLAG | Total packets | Discarded packets |
| A | 0 | 28 | 0 |
| B | 0 | 29 | 0 |
| C | 0 | 29 | 0 |
| D | 0 | 29 | 0 |
| Quadrant | Total seconds | Saturated seconds | Saturation percentage |
|---|---|---|---|
| A | 5430 | 9 | 0.165746% |
| B | 5430 | 21 | 0.386740% |
| C | 5430 | 8 | 0.147330% |
| D | 5430 | 87 | 1.602210% |
Noise dominated data is calculated using 1-second bins in cleaned event files. If a bin has >2000 counts, and if more than 50% of those come from <1% of pixels, then it is considered to be noise-dominated and hence unusable.
| Quadrant | # 1 sec bins | Bins with >0 counts | Bins with >2000 counts | High rate bins dominated by noise | Noise dominated (total time) | Noise dominated (detector-on time) | Marked lightcurve |
|---|---|---|---|---|---|---|---|
| A | 7163 | 5431 | 2 | 2 | 0.03% | 0.04% | 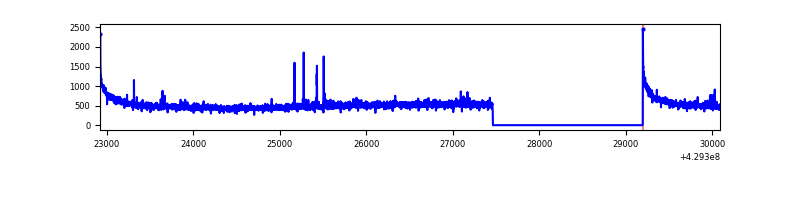 |
| B | 7163 | 5431 | 8 | 8 | 0.11% | 0.15% | 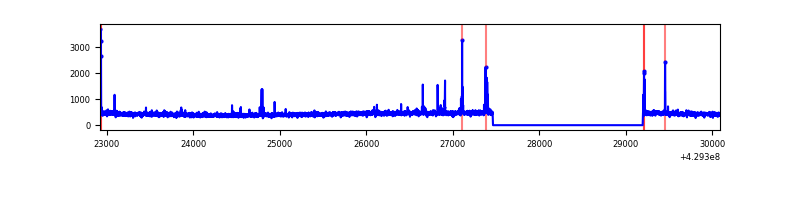 |
| C | 7163 | 5431 | 0 | 0 | 0.00% | 0.00% | 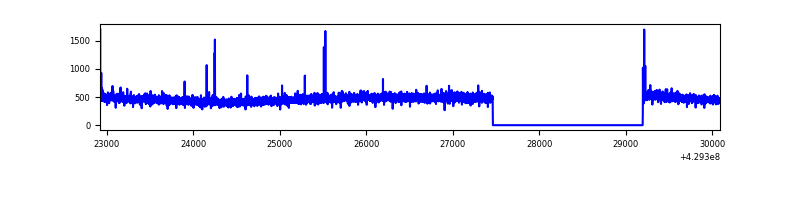 |
| D | 7163 | 5431 | 72 | 72 | 1.01% | 1.33% | 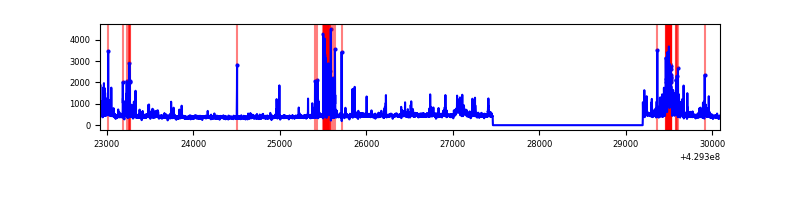 |
Top three noisy pixels from each quadrant. If the there are fewer than three noisy pixels in the level2.evt file, extra rows are filled as -1
| Pixel properties | Quadrant properties | ||||||
|---|---|---|---|---|---|---|---|
| Quadrant | DetID | PixID | Counts | Sigma | Mean | Median | Sigma |
| A | 10 | 83 | 539657 | 4472.57 | 585 | 571 | 120.5 |
| A | 2 | 79 | 32065 | 261.29 | 585 | 571 | 120.5 |
| A | 3 | 137 | 6624 | 50.22 | 585 | 571 | 120.5 |
| B | 5 | 255 | 75469 | 654.53 | 583 | 567 | 114.4 |
| B | 0 | 245 | 50371 | 435.21 | 583 | 567 | 114.4 |
| B | 12 | 111 | 14371 | 120.63 | 583 | 567 | 114.4 |
| C | 15 | 214 | 227924 | 1680.3 | 582 | 585 | 135.3 |
| C | 12 | 249 | 12382 | 87.19 | 582 | 585 | 135.3 |
| C | 9 | 54 | 8711 | 60.06 | 582 | 585 | 135.3 |
| D | 2 | 249 | 264854 | 1875.37 | 573 | 558 | 140.9 |
| D | 12 | 6 | 228323 | 1616.15 | 573 | 558 | 140.9 |
| D | 1 | 52 | 74804 | 526.83 | 573 | 558 | 140.9 |
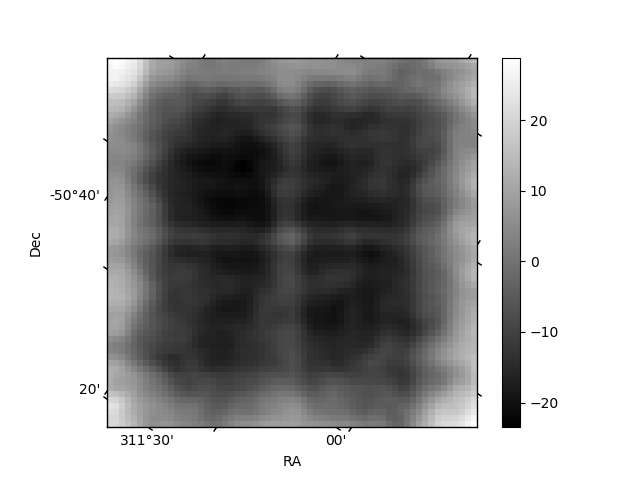
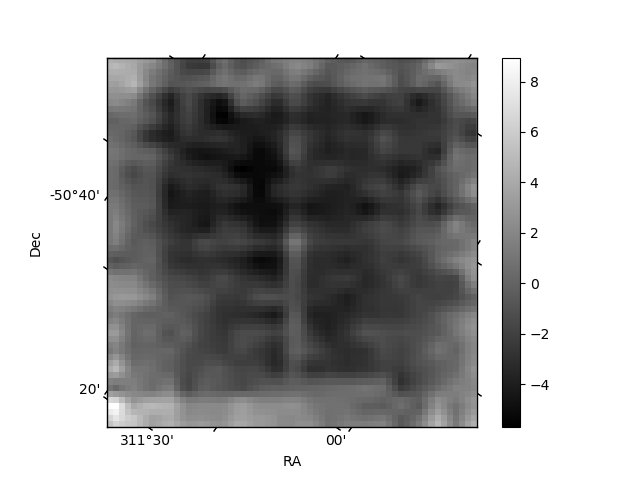
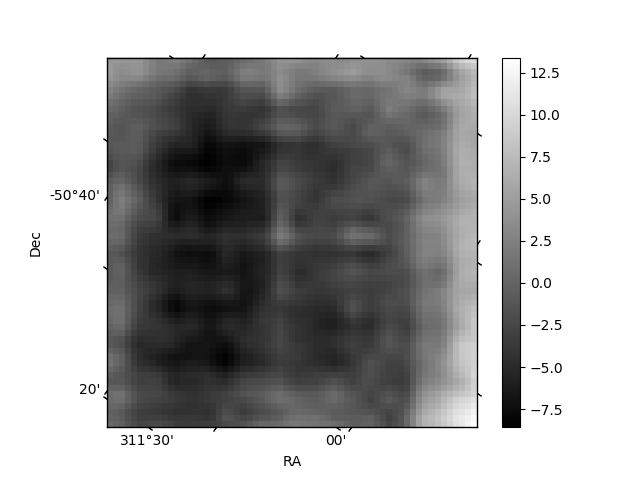
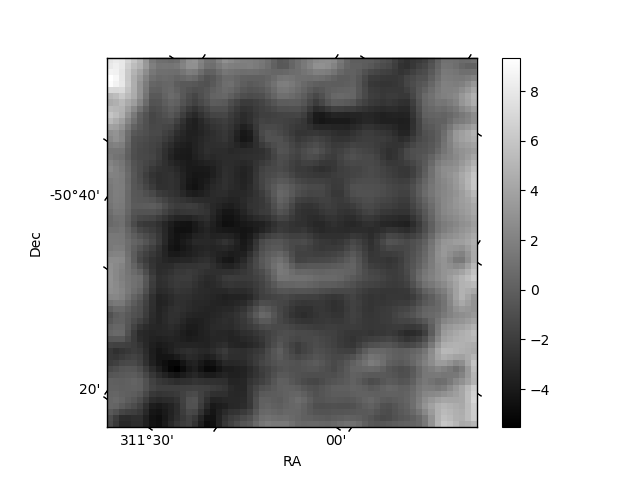
Histogram calculated using DETX and DETY for each event in the final _common_clean file
| Quadrant A | 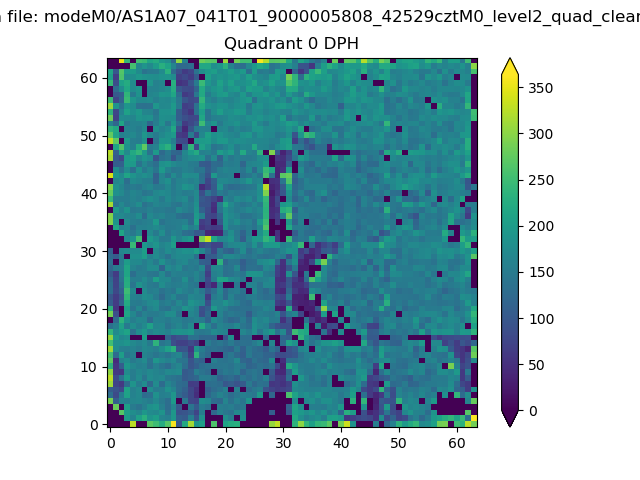 |
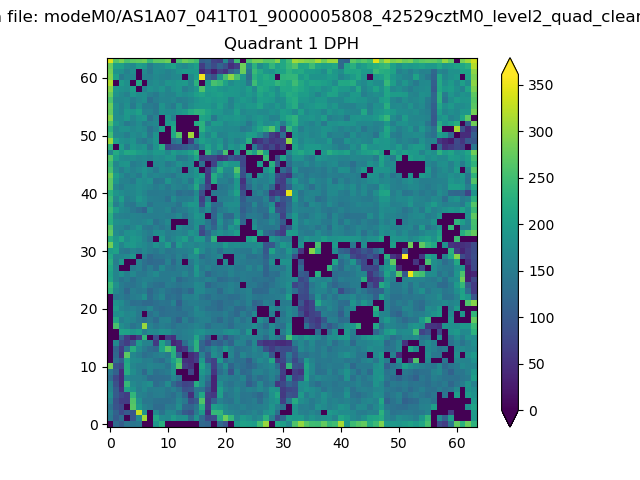 |
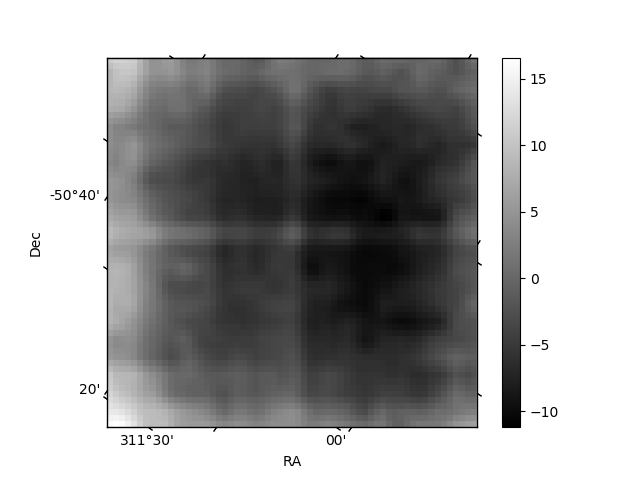
Quadrant B |
|---|---|---|---|
| Quadrant D | 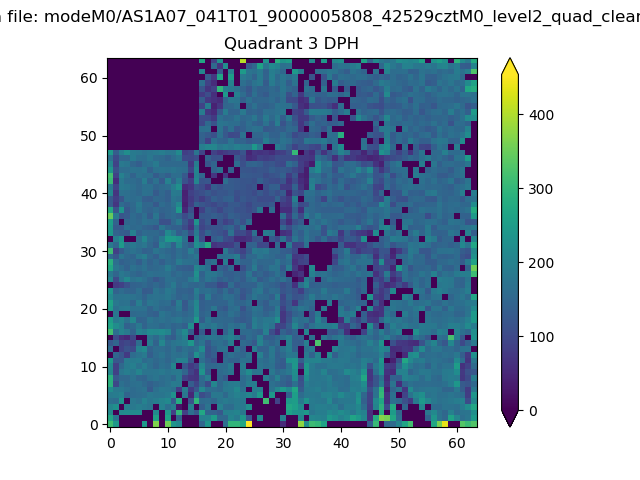 |
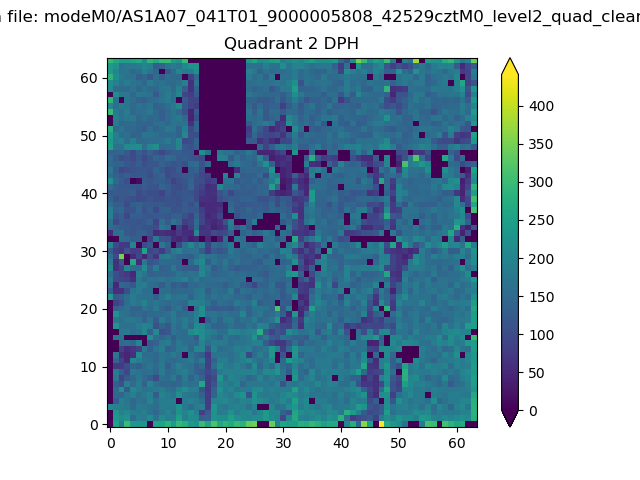 |
Quadrant C |
| Plot type | Count rate plots | Images |
|---|---|---|
| Comparison with Poisson distribution Blue bars denote a histogram of data divided into 1 sec bins. Red curve is a Poisson curve with rate = median count rate of data. |
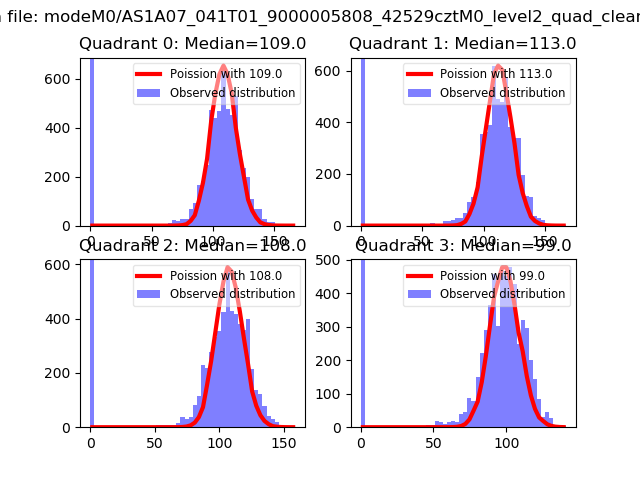 |
 |
| Quadrant-wise count rates Data is divided into 100 sec bins |
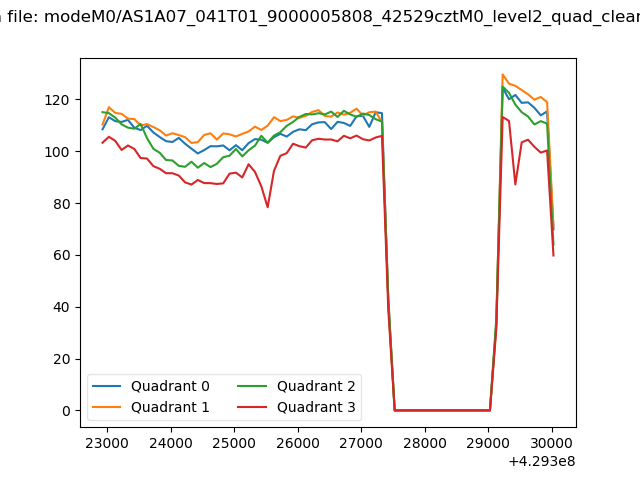 |
|
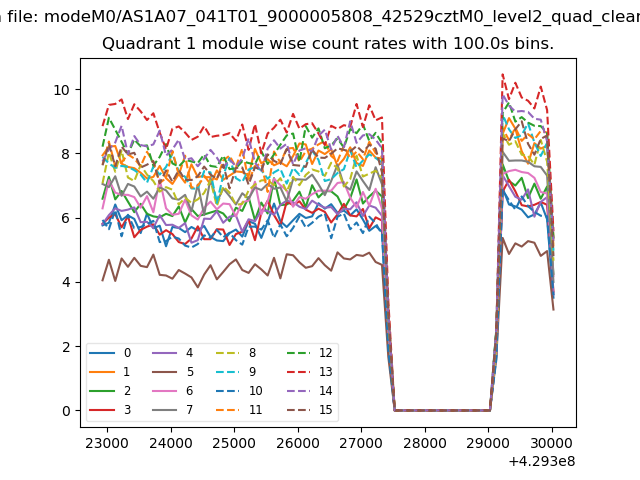
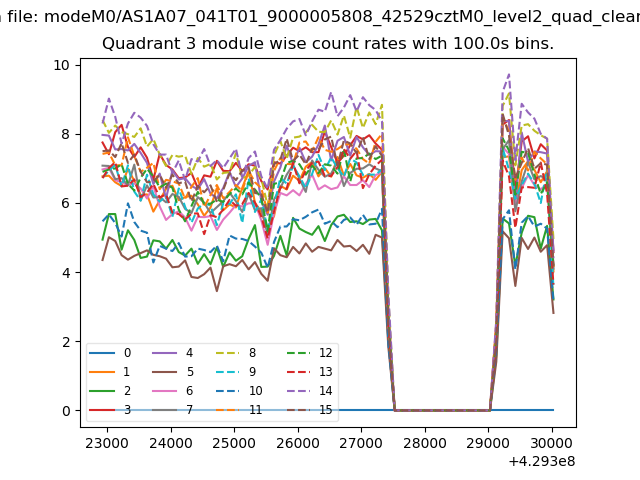
| Module-wise count rates for Quadrant A Data is divided into 100 sec bins |
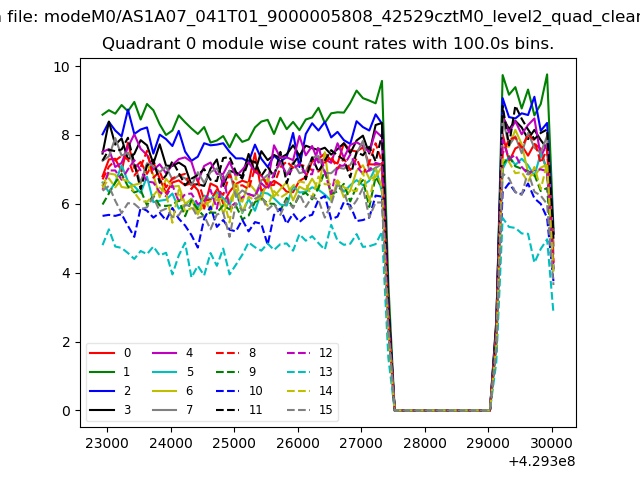 |
 |
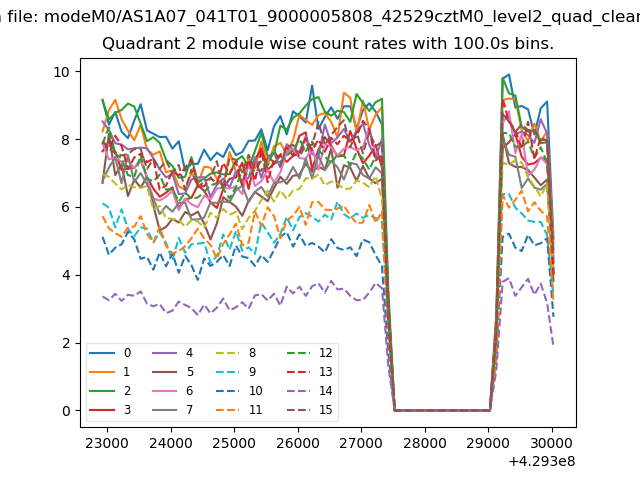
| Module-wise count rates for Quadrant B Data is divided into 100 sec bins |
 |
 |
| Module-wise count rates for Quadrant C Data is divided into 100 sec bins |
 |
 |
| Module-wise count rates for Quadrant D Data is divided into 100 sec bins |
 |
 |
| Parameter | Plot |
|---|---|
| CZT HV Monitor | 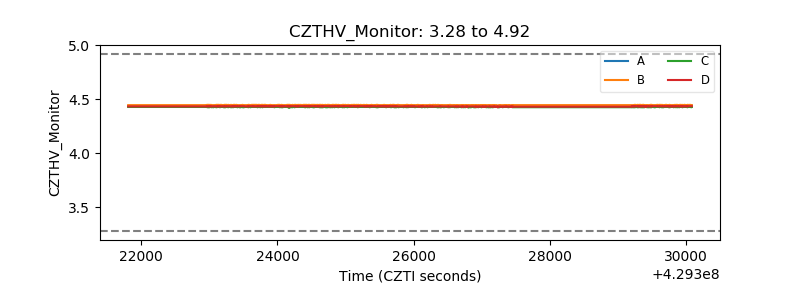 |
| D_VDD | 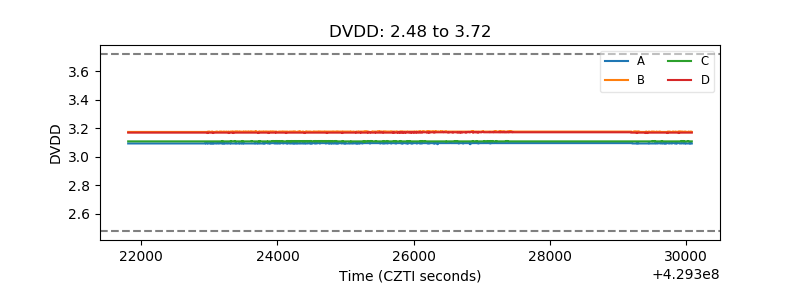 |
| Temperature 1 | 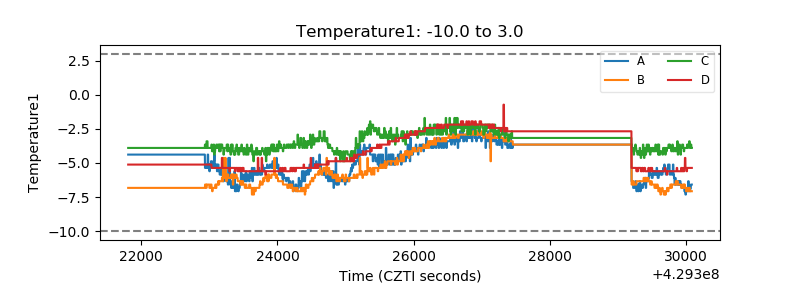 |
| Veto HV Monitor | 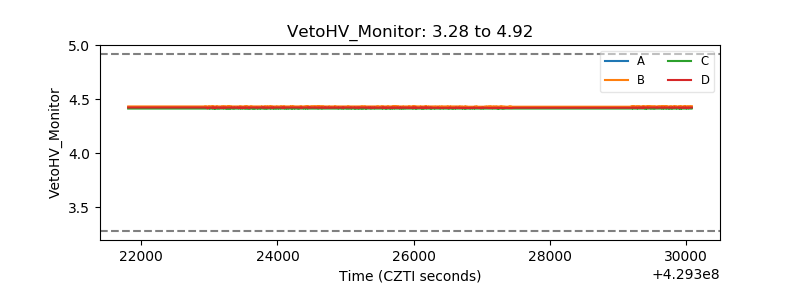 |
| Veto LLD | 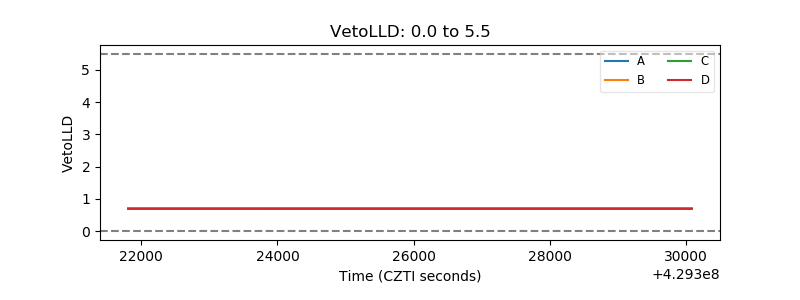 |
| Alpha Counter | 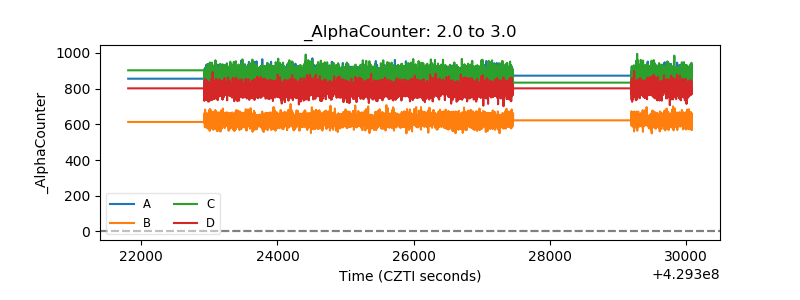 |
| _CPM_Rate | 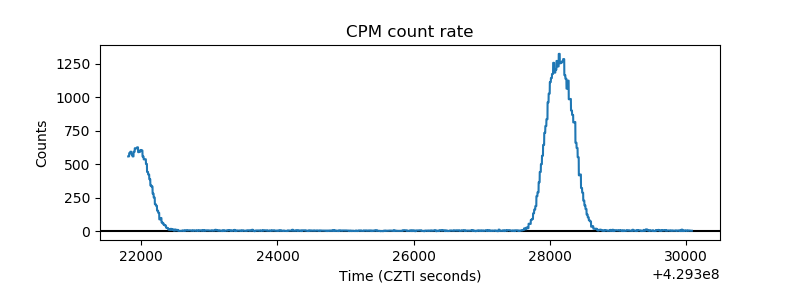 |
| CZT Counter | 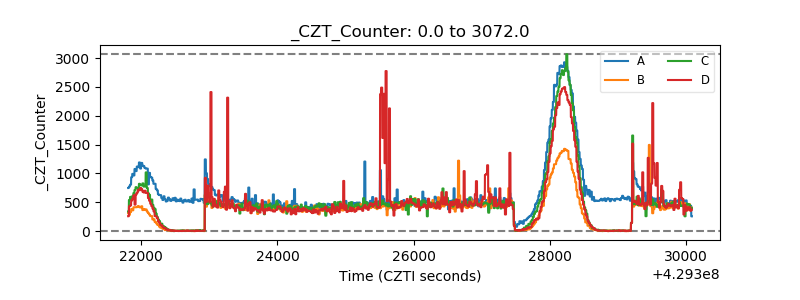 |
| +2.5 Volts monitor | 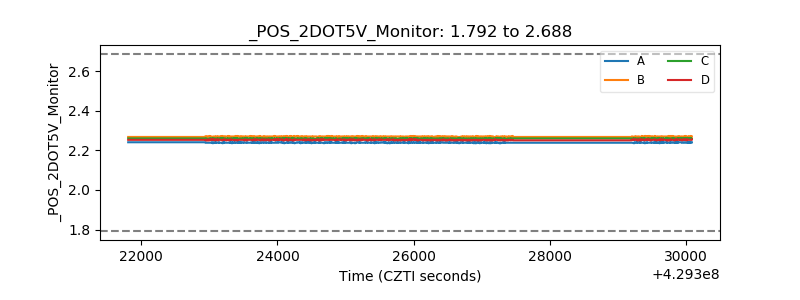 |
| +5 Volts monitor |  |
| _ROLL_ROT | 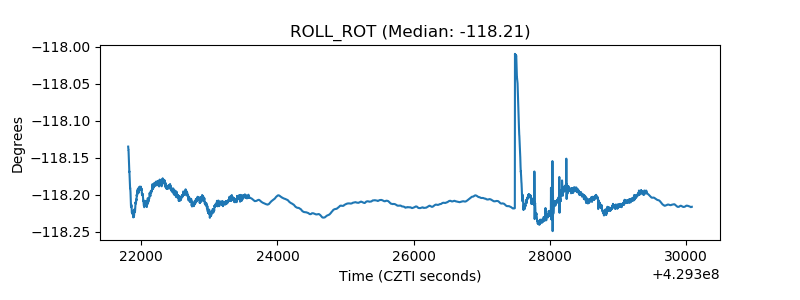 |
| _Roll_DEC | 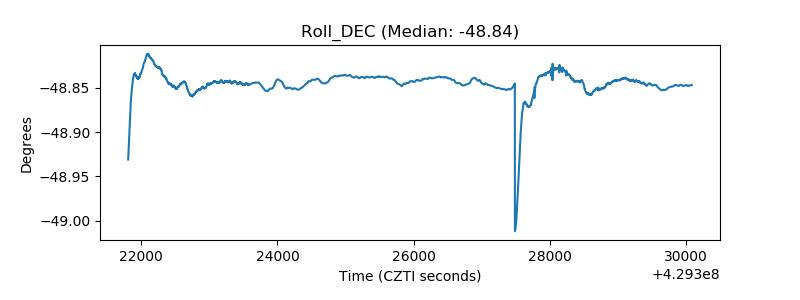 |
| _Roll_RA | 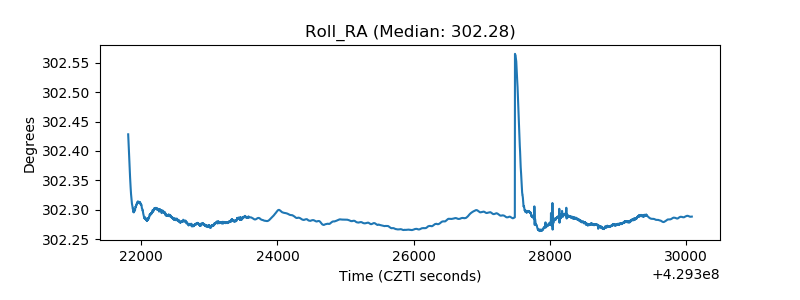 |
| Veto Counter | 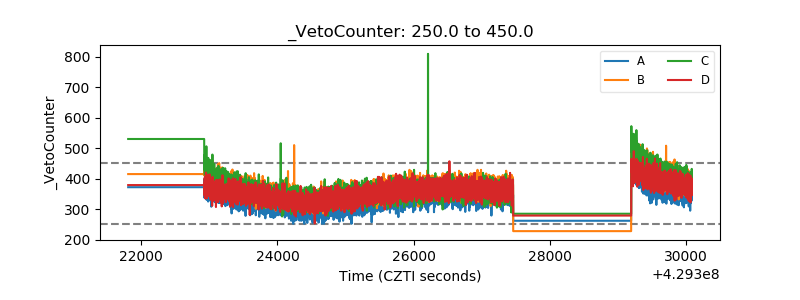 |