| Param | Original file | Final file |
|---|---|---|
| Filename | modeM0/AS1A07_041T01_9000005808_42530cztM0_level2.fits | modeM0/AS1A07_041T01_9000005808_42530cztM0_level2_quad_clean.evt |
| Size (bytes) | 255,283,200 | 72,043,200 |
| Size | 243.5 MB | 68.7 MB |
| Events in quadrant A | 2,231,613 | 480,423 |
| Events in quadrant B | 2,016,342 | 499,850 |
| Events in quadrant C | 2,037,639 | 481,349 |
| Events in quadrant D | 2,826,931 | 416,405 |
| Mode M0 | |||
|---|---|---|---|
| Quadrant | BADHDUFLAG | Total packets | Discarded packets |
| A | 0 | 9120 | 1 |
| B | 0 | 9060 | 1 |
| C | 0 | 8713 | 1 |
| D | 0 | 11428 | 1 |
| Mode SS | |||
|---|---|---|---|
| Quadrant | BADHDUFLAG | Total packets | Discarded packets |
| A | 0 | 88 | 0 |
| B | 0 | 88 | 0 |
| C | 0 | 88 | 0 |
| D | 0 | 88 | 0 |
| Mode M9 | |||
|---|---|---|---|
| Quadrant | BADHDUFLAG | Total packets | Discarded packets |
| A | 0 | 17 | 0 |
| B | 0 | 17 | 0 |
| C | 0 | 17 | 0 |
| D | 0 | 17 | 0 |
| Quadrant | Total seconds | Saturated seconds | Saturation percentage |
|---|---|---|---|
| A | 4314 | 6 | 0.139082% |
| B | 4315 | 20 | 0.463499% |
| C | 4315 | 3 | 0.069525% |
| D | 4315 | 256 | 5.932793% |
Noise dominated data is calculated using 1-second bins in cleaned event files. If a bin has >2000 counts, and if more than 50% of those come from <1% of pixels, then it is considered to be noise-dominated and hence unusable.
| Quadrant | # 1 sec bins | Bins with >0 counts | Bins with >2000 counts | High rate bins dominated by noise | Noise dominated (total time) | Noise dominated (detector-on time) | Marked lightcurve |
|---|---|---|---|---|---|---|---|
| A | 6047 | 4315 | 1 | 1 | 0.02% | 0.02% | 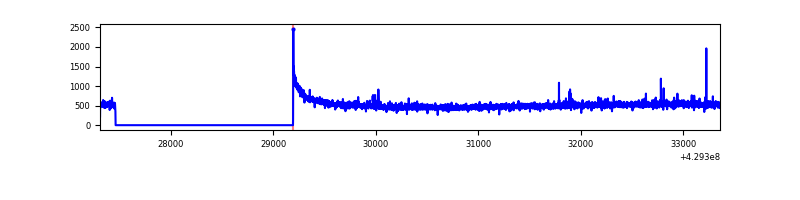 |
| B | 6048 | 4316 | 11 | 11 | 0.18% | 0.25% | 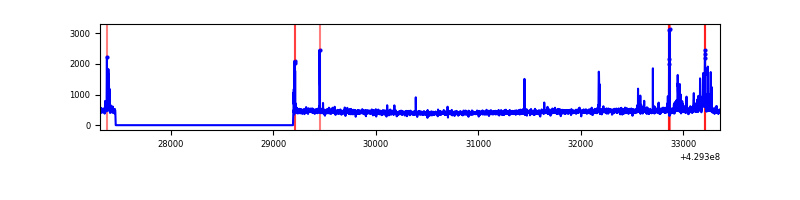 |
| C | 6048 | 4316 | 1 | 1 | 0.02% | 0.02% | 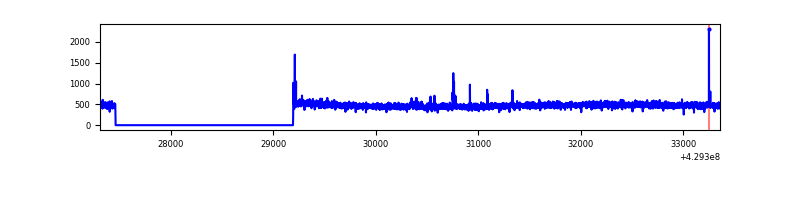 |
| D | 6048 | 4316 | 223 | 223 | 3.69% | 5.17% | 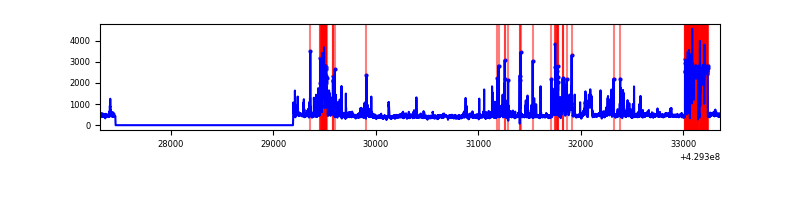 |
Top three noisy pixels from each quadrant. If the there are fewer than three noisy pixels in the level2.evt file, extra rows are filled as -1
| Pixel properties | Quadrant properties | ||||||
|---|---|---|---|---|---|---|---|
| Quadrant | DetID | PixID | Counts | Sigma | Mean | Median | Sigma |
| A | 10 | 83 | 373477 | 3786.44 | 475 | 466 | 98.5 |
| A | 2 | 79 | 11648 | 113.51 | 475 | 466 | 98.5 |
| A | 13 | 248 | 6761 | 63.9 | 475 | 466 | 98.5 |
| B | 5 | 255 | 126643 | 1385.88 | 472 | 460 | 91.0 |
| B | 0 | 245 | 33421 | 362.01 | 472 | 460 | 91.0 |
| B | 12 | 111 | 11648 | 122.88 | 472 | 460 | 91.0 |
| C | 15 | 214 | 175617 | 1590.91 | 471 | 474 | 110.1 |
| C | 14 | 254 | 15488 | 136.38 | 471 | 474 | 110.1 |
| C | 9 | 54 | 5993 | 50.13 | 471 | 474 | 110.1 |
| D | 1 | 52 | 573923 | 5175.9 | 452 | 439 | 110.8 |
| D | 2 | 249 | 360492 | 3249.61 | 452 | 439 | 110.8 |
| D | 1 | 47 | 74389 | 667.43 | 452 | 439 | 110.8 |
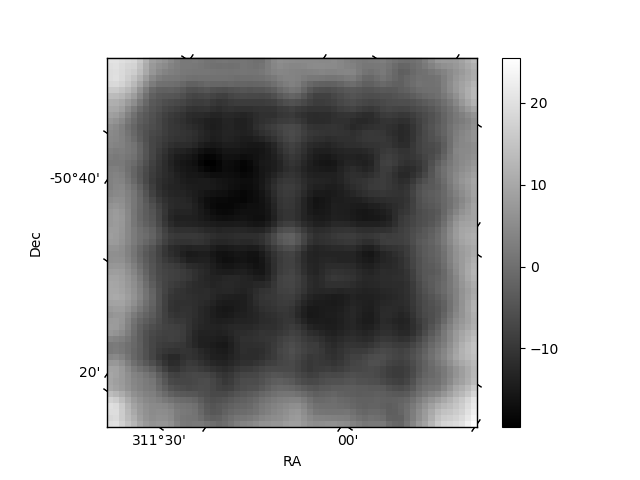
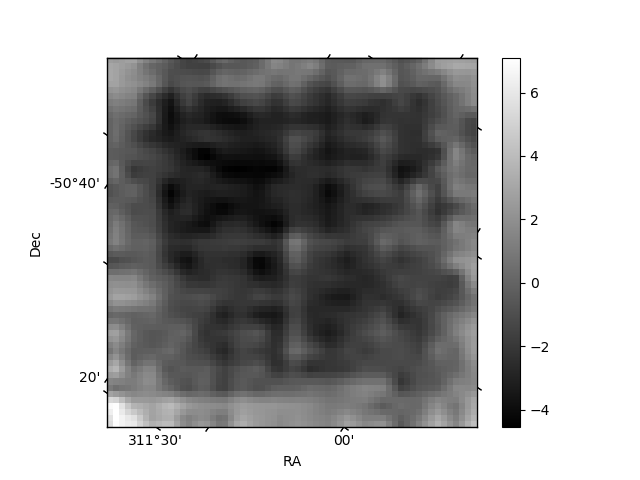
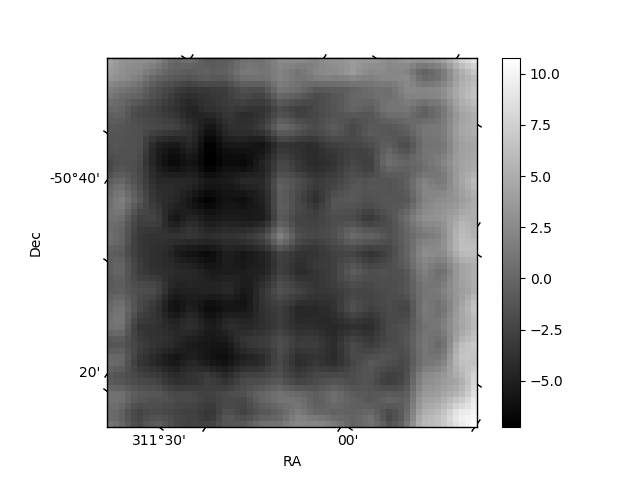
Histogram calculated using DETX and DETY for each event in the final _common_clean file
| Quadrant A | 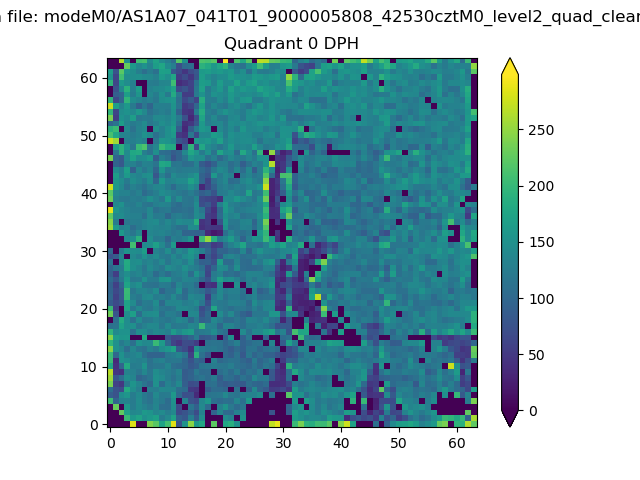 |
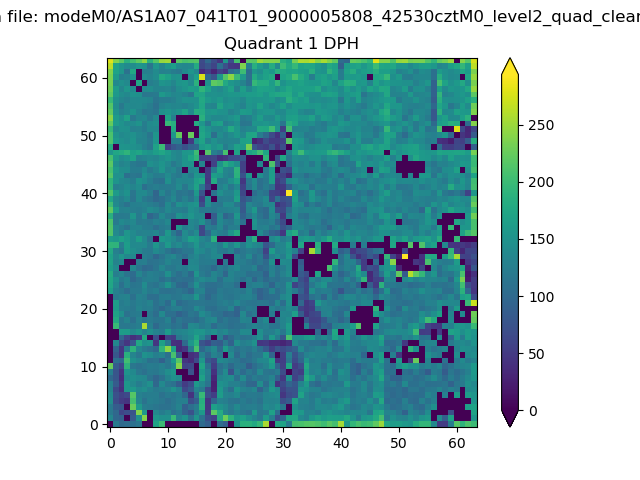 |
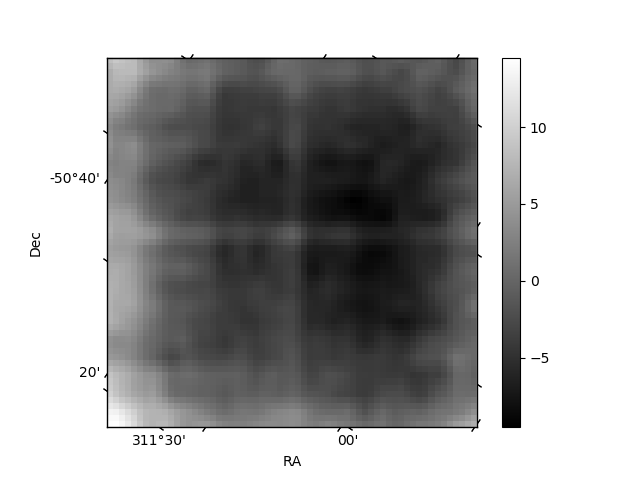
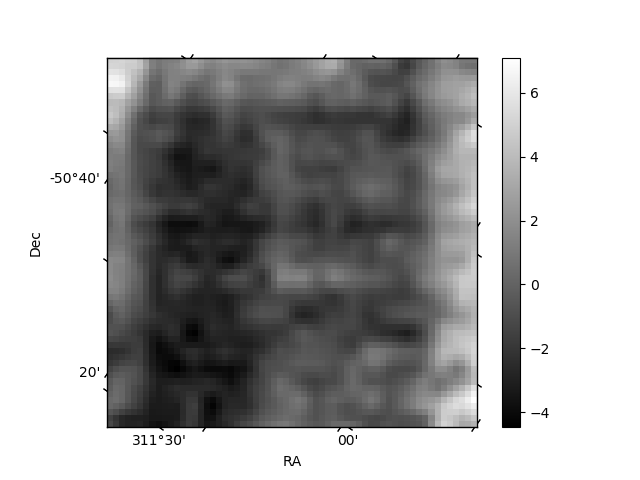
Quadrant B |
|---|---|---|---|
| Quadrant D | 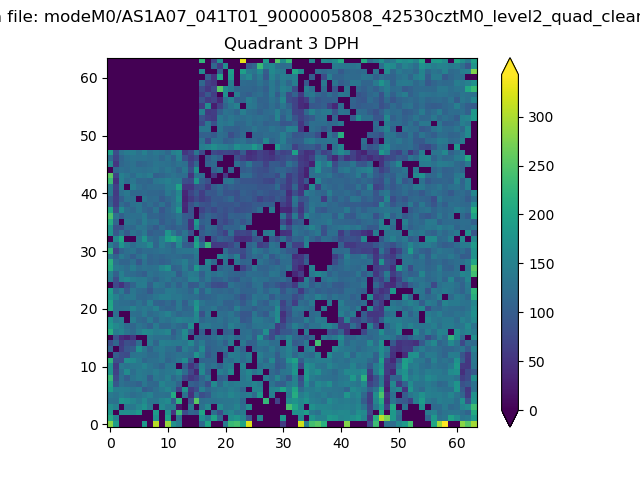 |
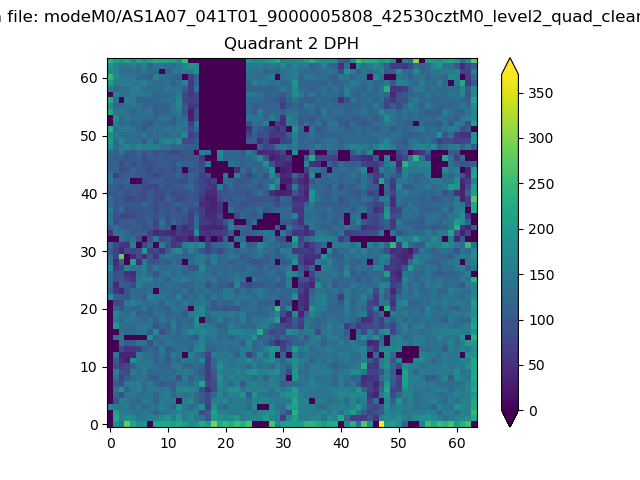 |
Quadrant C |
| Plot type | Count rate plots | Images |
|---|---|---|
| Comparison with Poisson distribution Blue bars denote a histogram of data divided into 1 sec bins. Red curve is a Poisson curve with rate = median count rate of data. |
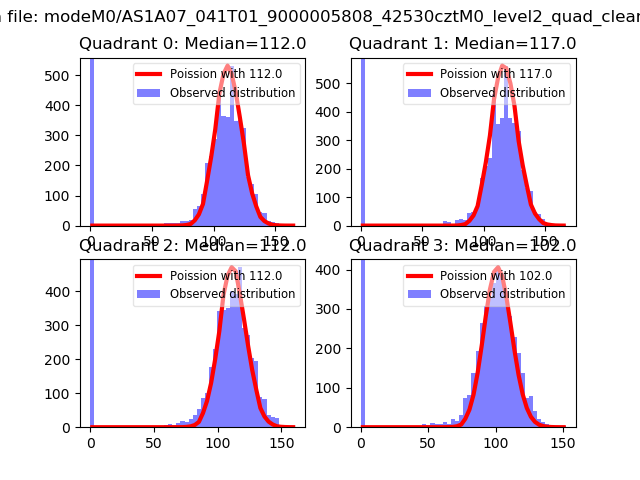 |
 |
| Quadrant-wise count rates Data is divided into 100 sec bins |
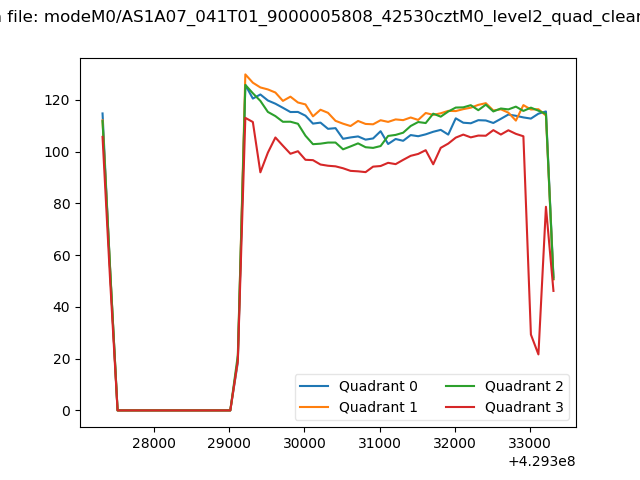 |
|
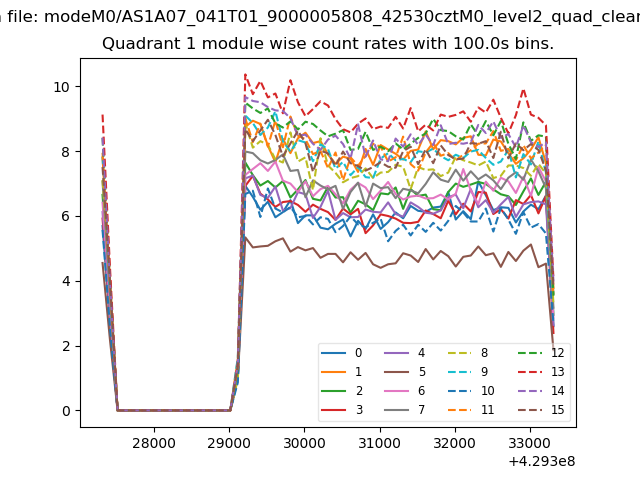
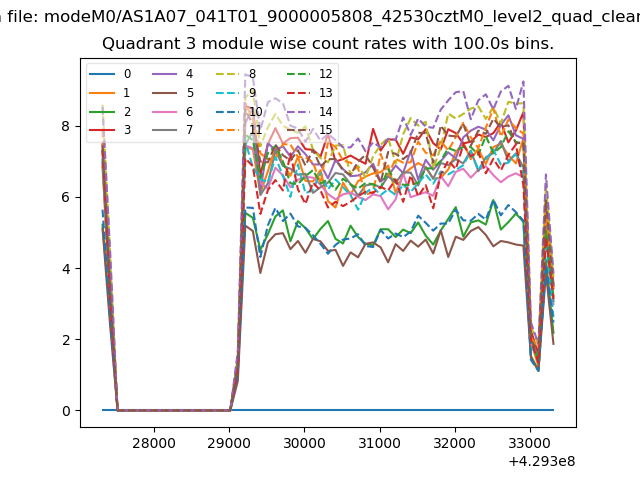
| Module-wise count rates for Quadrant A Data is divided into 100 sec bins |
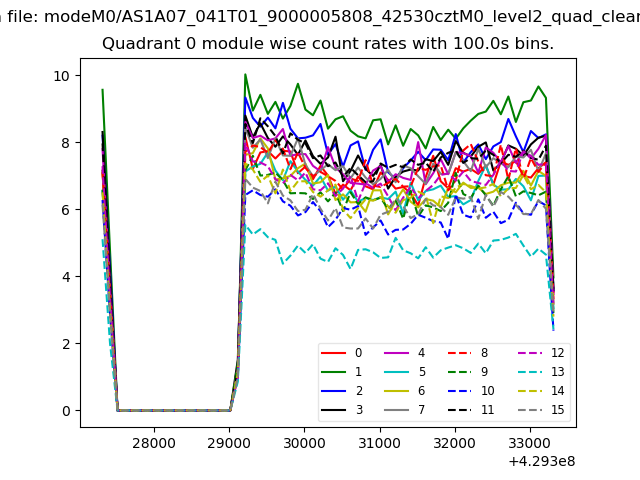 |
 |
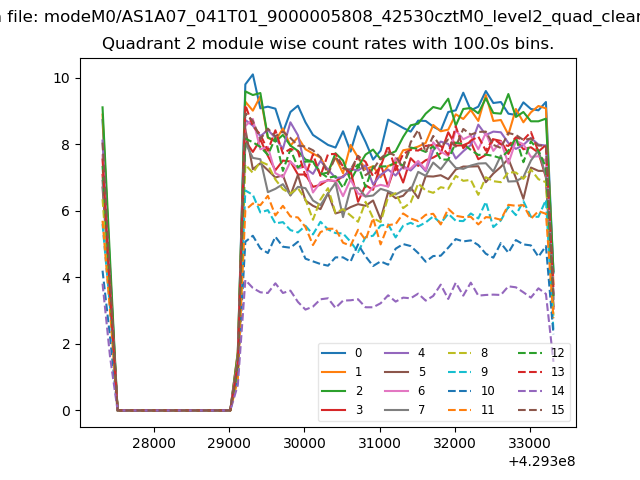
| Module-wise count rates for Quadrant B Data is divided into 100 sec bins |
 |
 |
| Module-wise count rates for Quadrant C Data is divided into 100 sec bins |
 |
 |
| Module-wise count rates for Quadrant D Data is divided into 100 sec bins |
 |
 |
| Parameter | Plot |
|---|---|
| CZT HV Monitor | 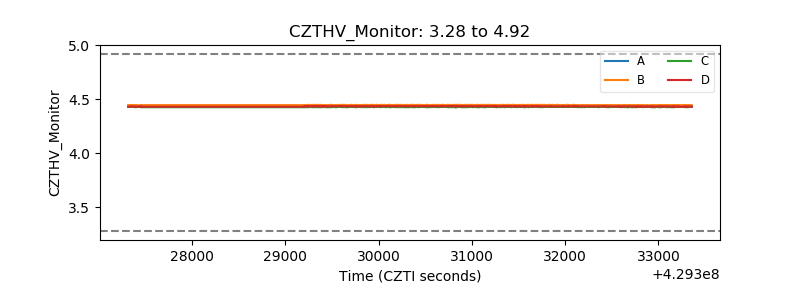 |
| D_VDD | 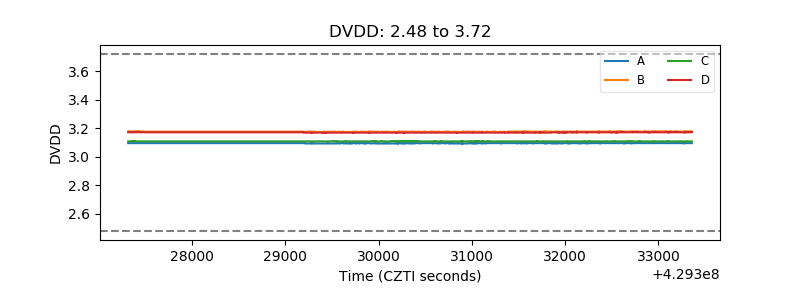 |
| Temperature 1 | 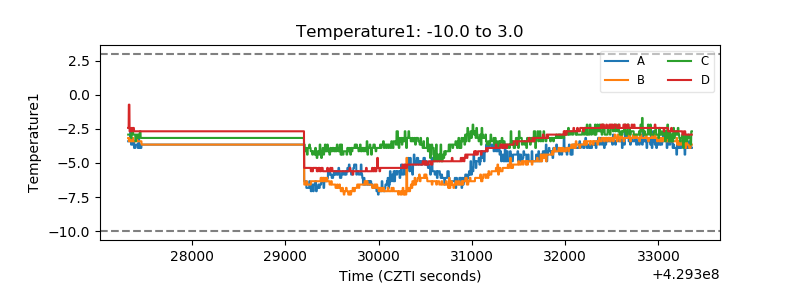 |
| Veto HV Monitor | 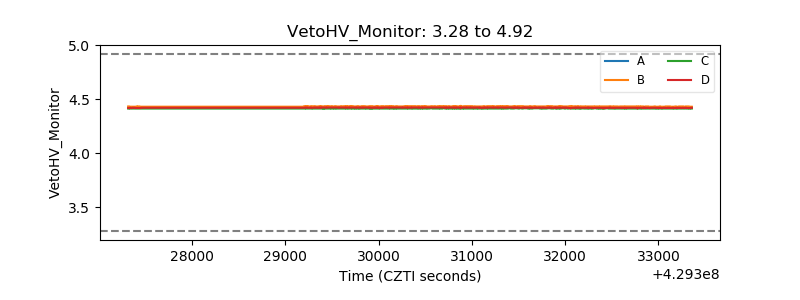 |
| Veto LLD | 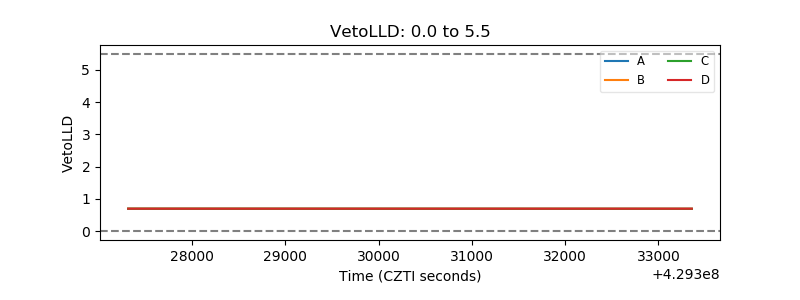 |
| Alpha Counter | 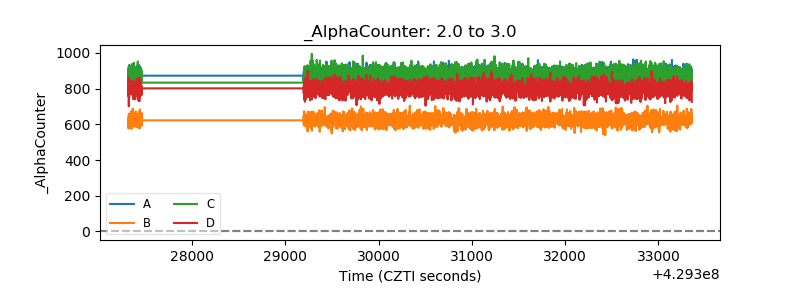 |
| _CPM_Rate | 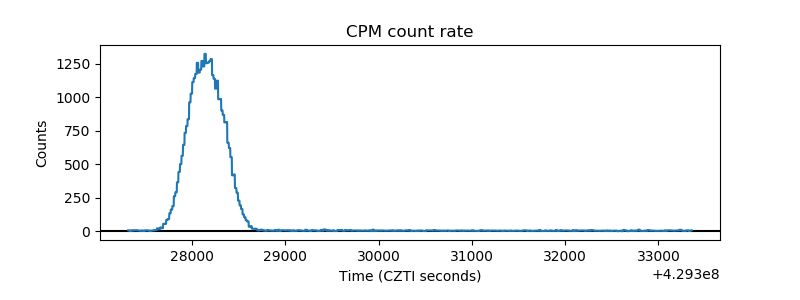 |
| CZT Counter | 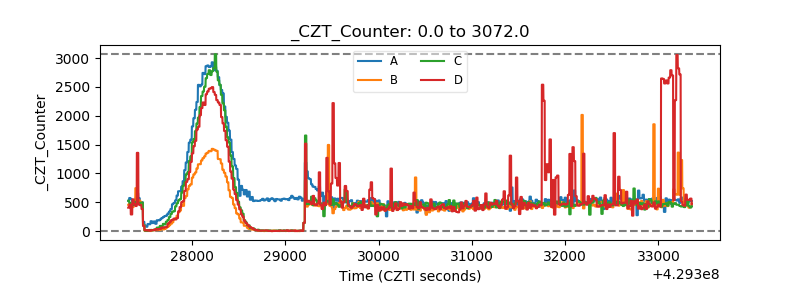 |
| +2.5 Volts monitor | 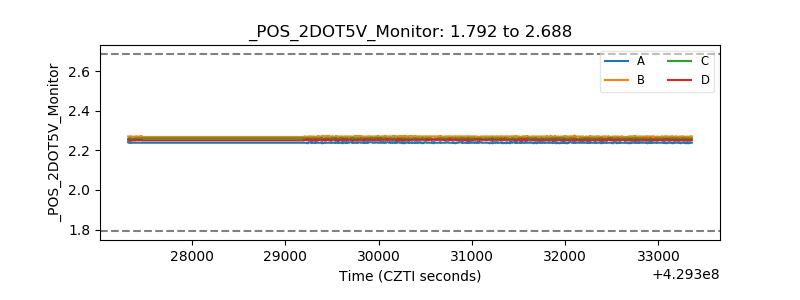 |
| +5 Volts monitor | 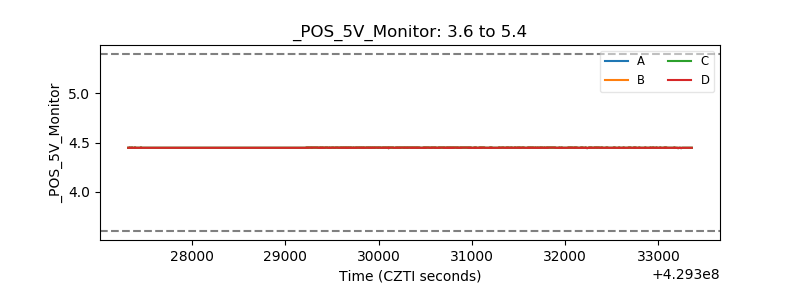 |
| _ROLL_ROT |  |
| _Roll_DEC | 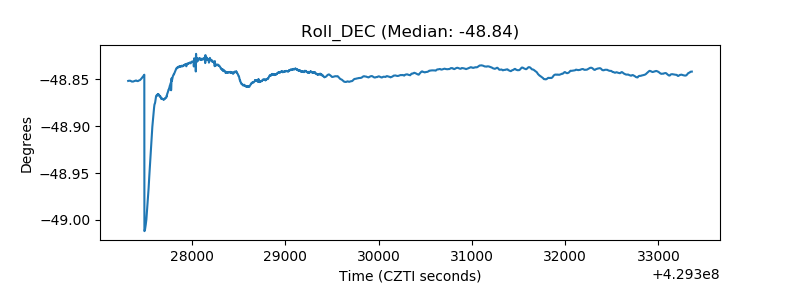 |
| _Roll_RA | 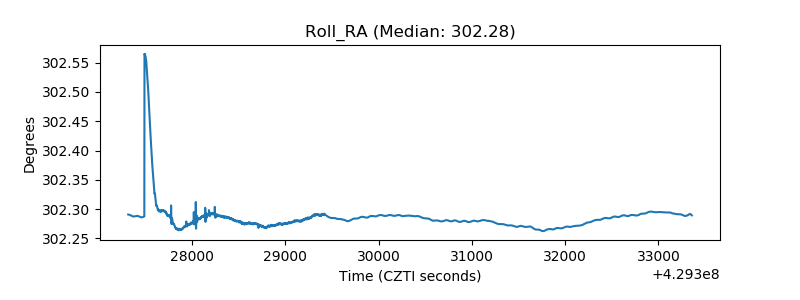 |
| Veto Counter | 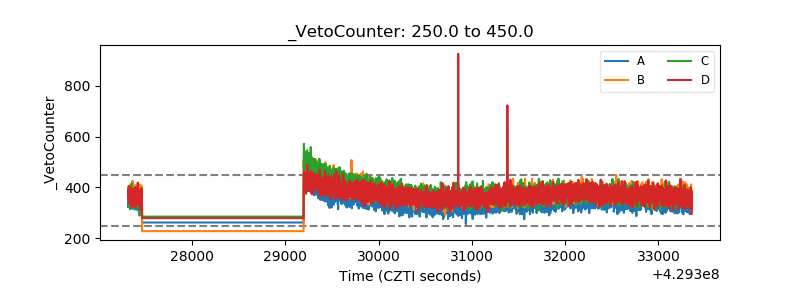 |