| Param | Original file | Final file |
|---|---|---|
| Filename | modeM0/AS1A09_002T01_9000005810_42531cztM0_level2.fits | modeM0/AS1A09_002T01_9000005810_42531cztM0_level2_quad_clean.evt |
| Size (bytes) | 314,487,360 | 90,653,760 |
| Size | 299.9 MB | 86.5 MB |
| Events in quadrant A | 2,723,622 | 620,724 |
| Events in quadrant B | 2,433,299 | 635,834 |
| Events in quadrant C | 2,499,069 | 609,733 |
| Events in quadrant D | 3,594,049 | 527,205 |
| Mode M0 | |||
|---|---|---|---|
| Quadrant | BADHDUFLAG | Total packets | Discarded packets |
| A | 0 | 10983 | 1 |
| B | 0 | 10523 | 1 |
| C | 0 | 10416 | 1 |
| D | 0 | 14029 | 1 |
| Mode M9 | |||
|---|---|---|---|
| Quadrant | BADHDUFLAG | Total packets | Discarded packets |
| A | 0 | 20 | 0 |
| B | 0 | 20 | 0 |
| C | 0 | 20 | 0 |
| D | 0 | 20 | 0 |
| Mode SS | |||
|---|---|---|---|
| Quadrant | BADHDUFLAG | Total packets | Discarded packets |
| A | 0 | 102 | 0 |
| B | 0 | 102 | 0 |
| C | 0 | 102 | 0 |
| D | 0 | 102 | 0 |
| Quadrant | Total seconds | Saturated seconds | Saturation percentage |
|---|---|---|---|
| A | 5017 | 7 | 0.139526% |
| B | 5017 | 23 | 0.458441% |
| C | 5018 | 14 | 0.278996% |
| D | 5018 | 345 | 6.875249% |
Noise dominated data is calculated using 1-second bins in cleaned event files. If a bin has >2000 counts, and if more than 50% of those come from <1% of pixels, then it is considered to be noise-dominated and hence unusable.
| Quadrant | # 1 sec bins | Bins with >0 counts | Bins with >2000 counts | High rate bins dominated by noise | Noise dominated (total time) | Noise dominated (detector-on time) | Marked lightcurve |
|---|---|---|---|---|---|---|---|
| A | 7020 | 5018 | 1 | 1 | 0.01% | 0.02% | 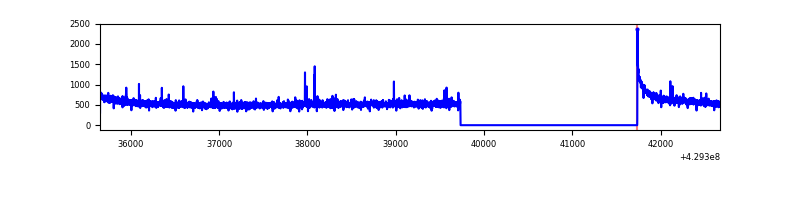 |
| B | 7020 | 5018 | 13 | 13 | 0.19% | 0.26% | 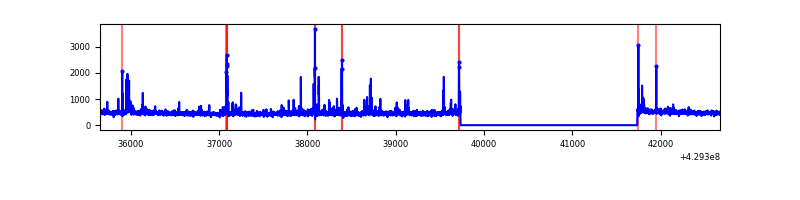 |
| C | 7021 | 5019 | 6 | 6 | 0.09% | 0.12% | 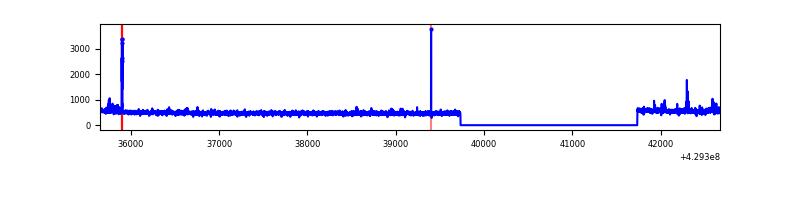 |
| D | 7021 | 5019 | 311 | 311 | 4.43% | 6.20% | 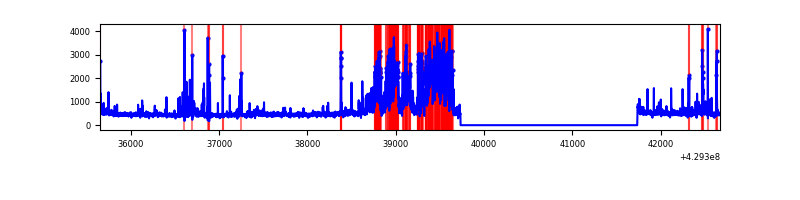 |
Top three noisy pixels from each quadrant. If the there are fewer than three noisy pixels in the level2.evt file, extra rows are filled as -1
| Pixel properties | Quadrant properties | ||||||
|---|---|---|---|---|---|---|---|
| Quadrant | DetID | PixID | Counts | Sigma | Mean | Median | Sigma |
| A | 10 | 83 | 462327 | 3954.51 | 576 | 566 | 116.8 |
| A | 2 | 79 | 21789 | 181.75 | 576 | 566 | 116.8 |
| A | 13 | 248 | 6661 | 52.2 | 576 | 566 | 116.8 |
| B | 5 | 255 | 117861 | 1084.15 | 571 | 556 | 108.2 |
| B | 0 | 245 | 40825 | 372.17 | 571 | 556 | 108.2 |
| B | 5 | 172 | 36102 | 328.52 | 571 | 556 | 108.2 |
| C | 15 | 214 | 207603 | 1578.8 | 568 | 572 | 131.1 |
| C | 9 | 54 | 37147 | 278.92 | 568 | 572 | 131.1 |
| C | 0 | 239 | 13911 | 101.72 | 568 | 572 | 131.1 |
| D | 2 | 249 | 1158445 | 8691.32 | 554 | 541 | 133.2 |
| D | 1 | 52 | 129830 | 970.45 | 554 | 541 | 133.2 |
| D | 12 | 6 | 103222 | 770.73 | 554 | 541 | 133.2 |
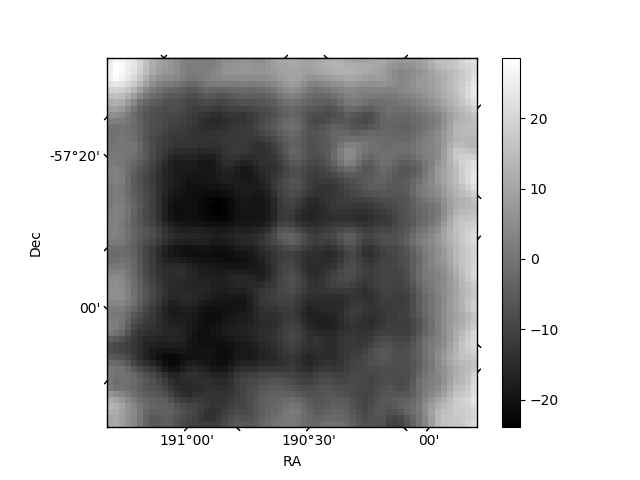
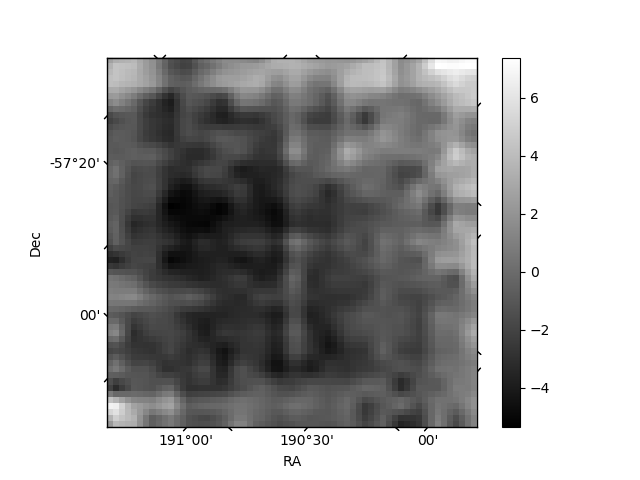
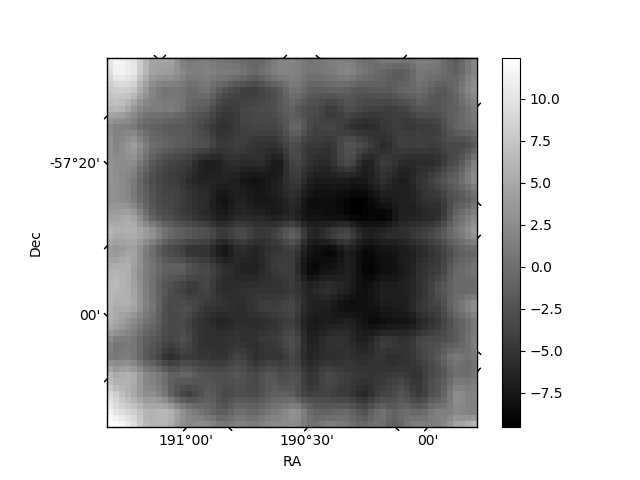
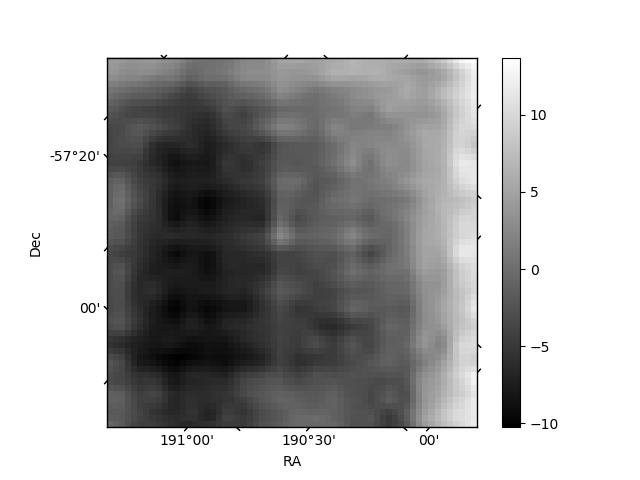
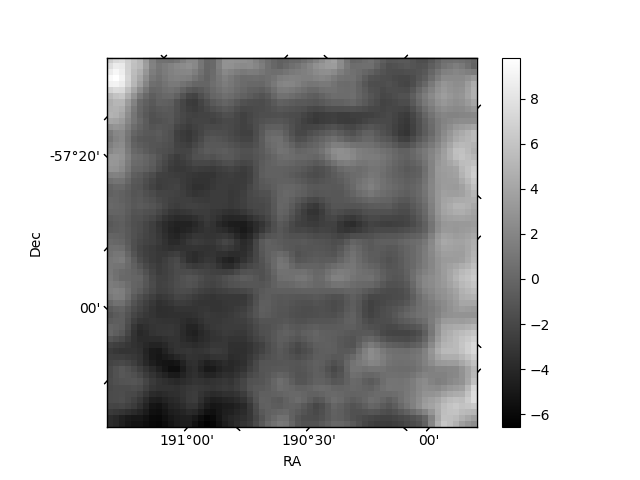
Histogram calculated using DETX and DETY for each event in the final _common_clean file
| Quadrant A | 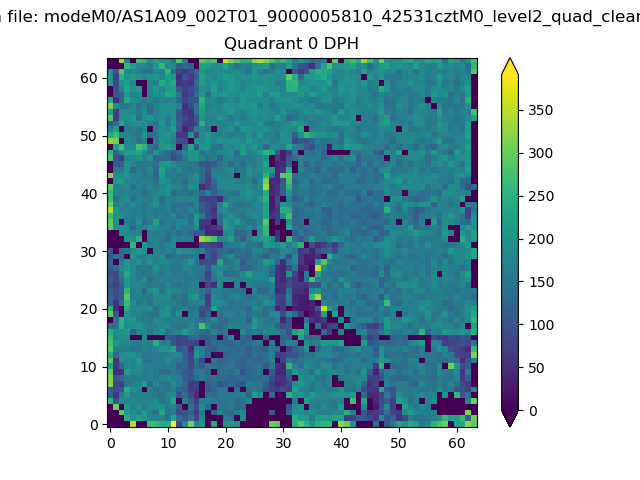 |
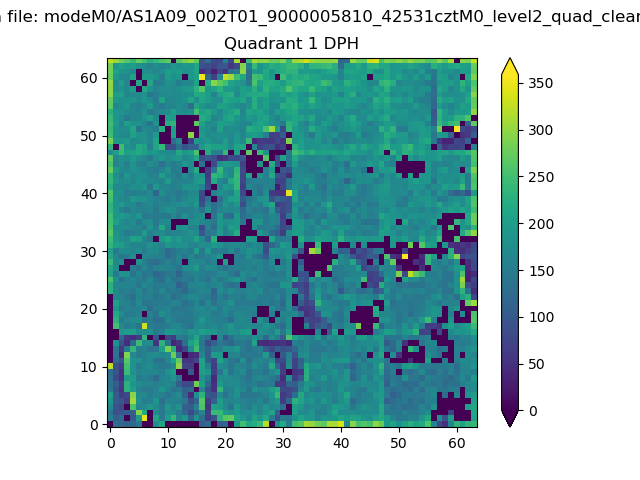 |
Quadrant B |
|---|---|---|---|
| Quadrant D |  |
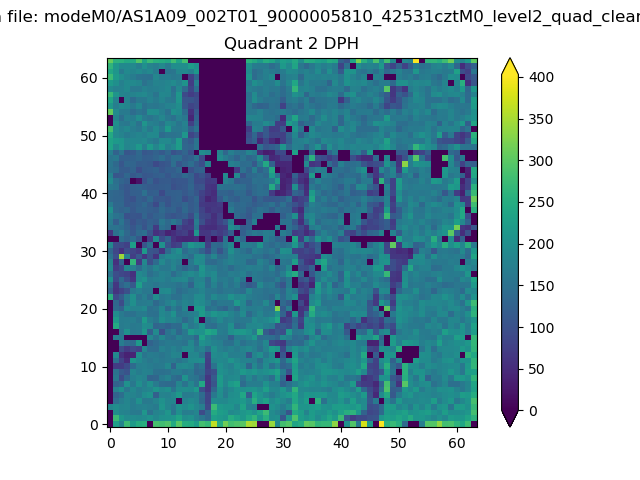 |
Quadrant C |
| Plot type | Count rate plots | Images |
|---|---|---|
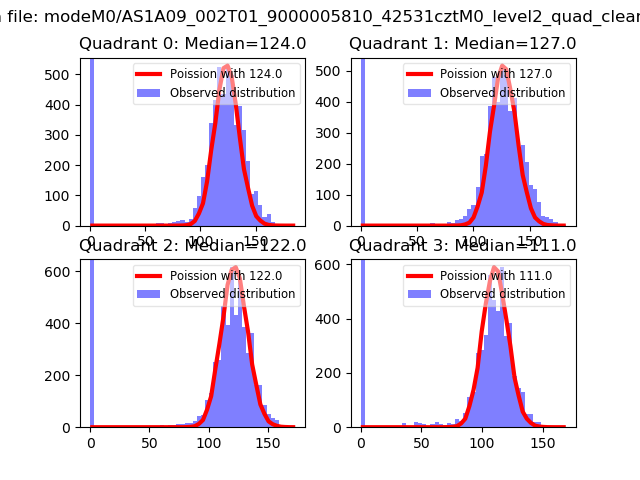
| Comparison with Poisson distribution Blue bars denote a histogram of data divided into 1 sec bins. Red curve is a Poisson curve with rate = median count rate of data. |
 |
 |
| Quadrant-wise count rates Data is divided into 100 sec bins |
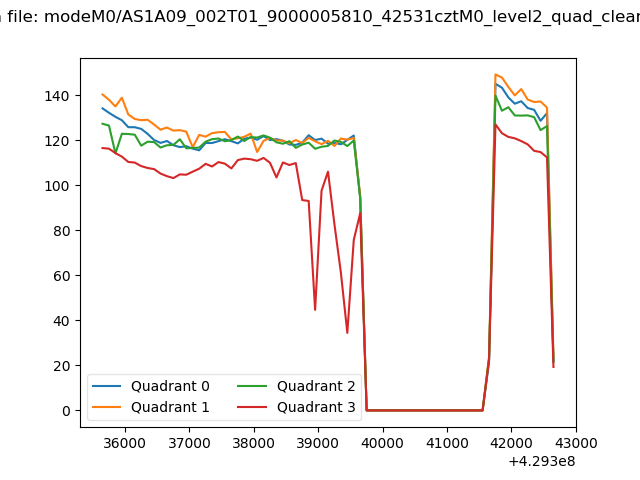 |
|
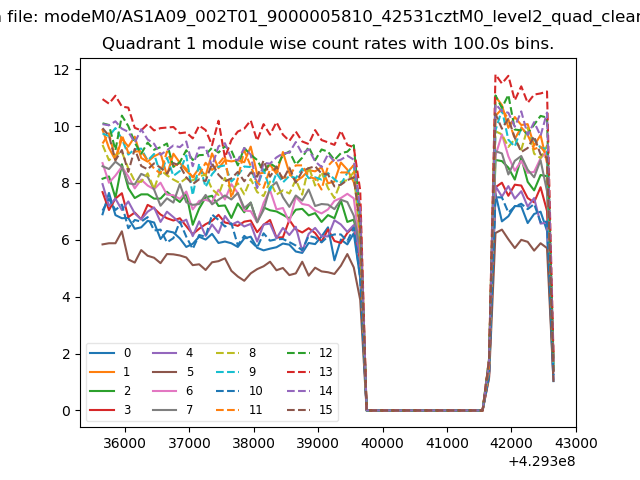
| Module-wise count rates for Quadrant A Data is divided into 100 sec bins |
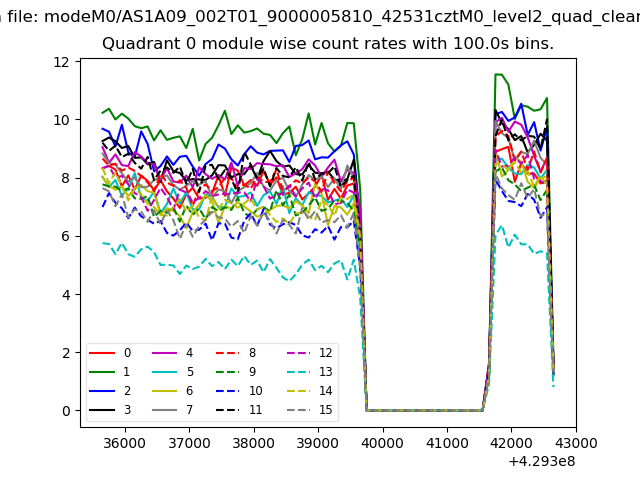 |
 |
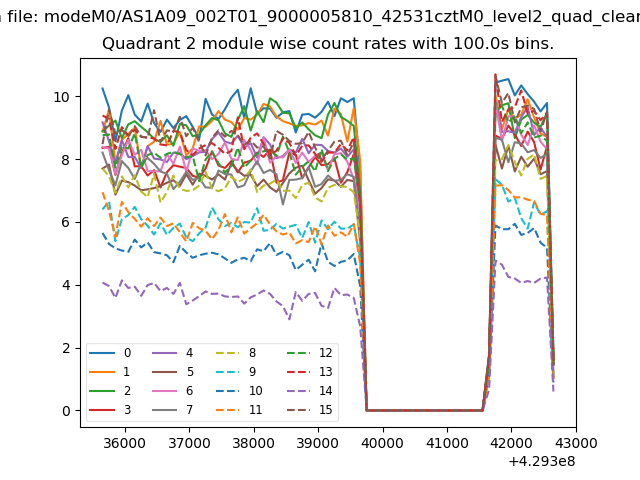
| Module-wise count rates for Quadrant B Data is divided into 100 sec bins |
 |
 |
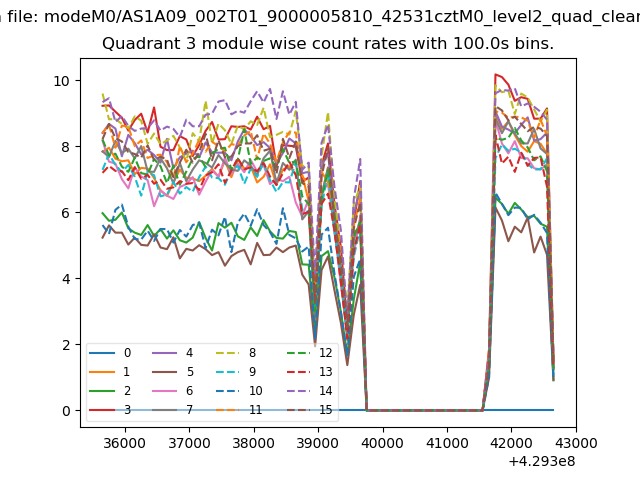
| Module-wise count rates for Quadrant C Data is divided into 100 sec bins |
 |
 |
| Module-wise count rates for Quadrant D Data is divided into 100 sec bins |
 |
 |
| Parameter | Plot |
|---|---|
| CZT HV Monitor | 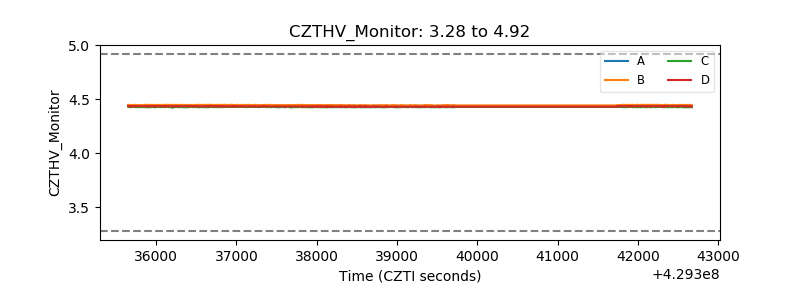 |
| D_VDD | 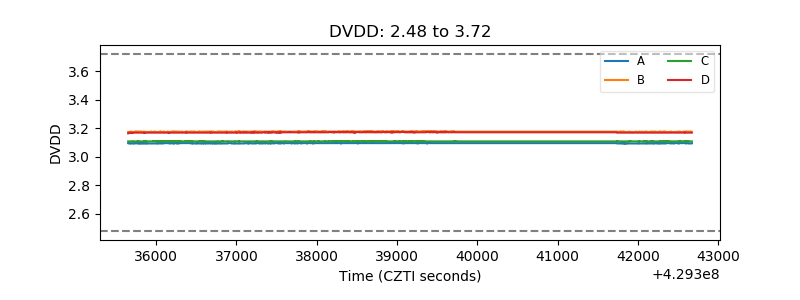 |
| Temperature 1 | 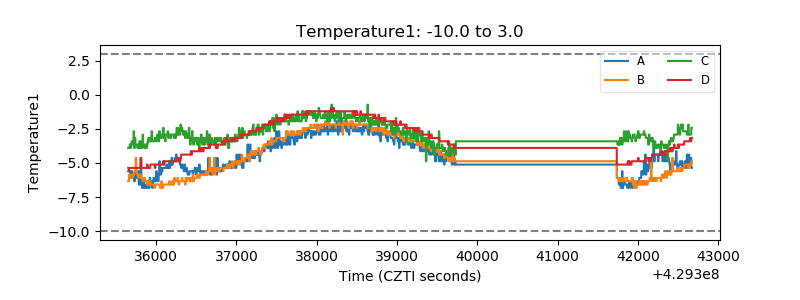 |
| Veto HV Monitor |  |
| Veto LLD | 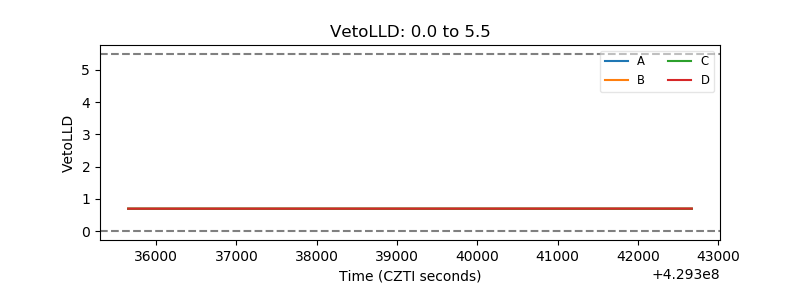 |
| Alpha Counter | 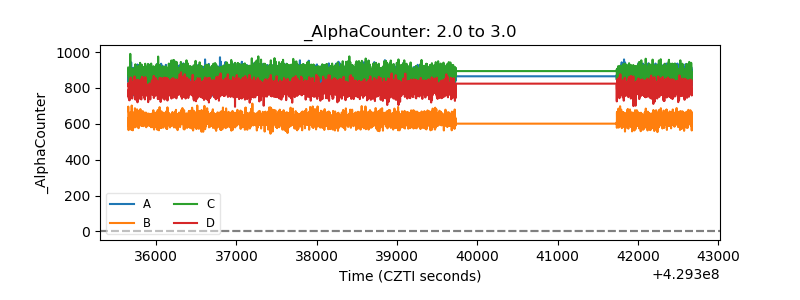 |
| _CPM_Rate |  |
| CZT Counter | 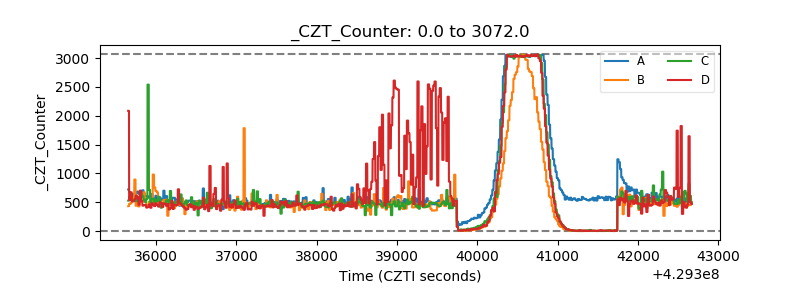 |
| +2.5 Volts monitor |  |
| +5 Volts monitor | 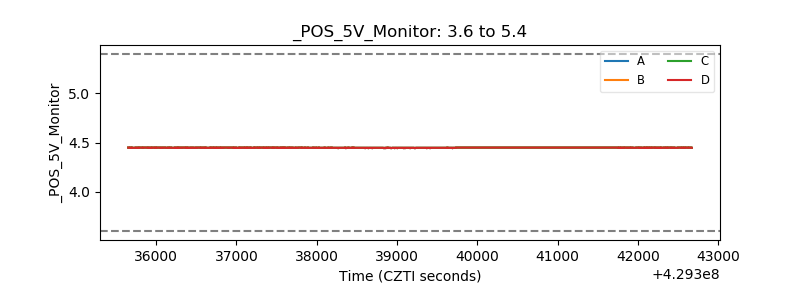 |
| _ROLL_ROT | 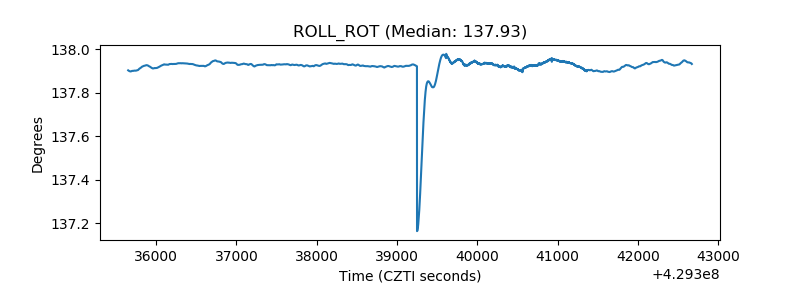 |
| _Roll_DEC | 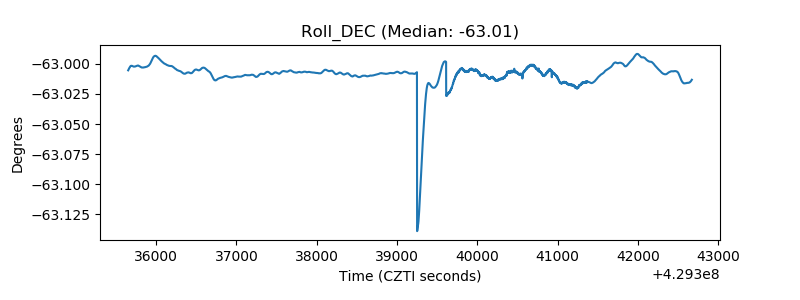 |
| _Roll_RA | 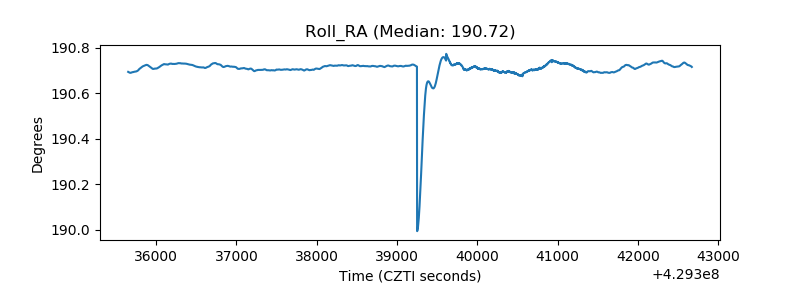 |
| Veto Counter | 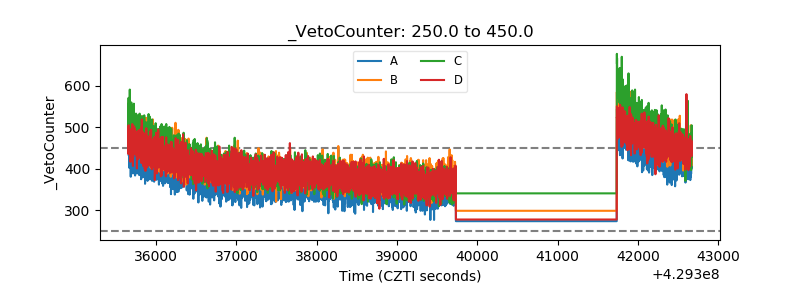 |