| Param | Original file | Final file |
|---|---|---|
| Filename | modeM0/AS1A09_002T01_9000005810_42532cztM0_level2.fits | modeM0/AS1A09_002T01_9000005810_42532cztM0_level2_quad_clean.evt |
| Size (bytes) | 294,128,640 | 93,816,000 |
| Size | 280.5 MB | 89.5 MB |
| Events in quadrant A | 2,843,436 | 635,617 |
| Events in quadrant B | 2,386,850 | 651,327 |
| Events in quadrant C | 2,562,888 | 629,287 |
| Events in quadrant D | 2,704,009 | 573,728 |
| Mode M0 | |||
|---|---|---|---|
| Quadrant | BADHDUFLAG | Total packets | Discarded packets |
| A | 0 | 11319 | 2 |
| B | 0 | 10318 | 2 |
| C | 0 | 10478 | 2 |
| D | 0 | 11357 | 2 |
| Mode M9 | |||
|---|---|---|---|
| Quadrant | BADHDUFLAG | Total packets | Discarded packets |
| A | 0 | 23 | 0 |
| B | 0 | 24 | 0 |
| C | 0 | 24 | 0 |
| D | 0 | 24 | 0 |
| Mode SS | |||
|---|---|---|---|
| Quadrant | BADHDUFLAG | Total packets | Discarded packets |
| A | 0 | 102 | 0 |
| B | 0 | 102 | 0 |
| C | 0 | 102 | 0 |
| D | 0 | 102 | 0 |
| Quadrant | Total seconds | Saturated seconds | Saturation percentage |
|---|---|---|---|
| A | 5007 | 11 | 0.219692% |
| B | 5007 | 10 | 0.199720% |
| C | 5007 | 4 | 0.079888% |
| D | 5007 | 48 | 0.958658% |
Noise dominated data is calculated using 1-second bins in cleaned event files. If a bin has >2000 counts, and if more than 50% of those come from <1% of pixels, then it is considered to be noise-dominated and hence unusable.
| Quadrant | # 1 sec bins | Bins with >0 counts | Bins with >2000 counts | High rate bins dominated by noise | Noise dominated (total time) | Noise dominated (detector-on time) | Marked lightcurve |
|---|---|---|---|---|---|---|---|
| A | 7068 | 5008 | 2 | 2 | 0.03% | 0.04% | 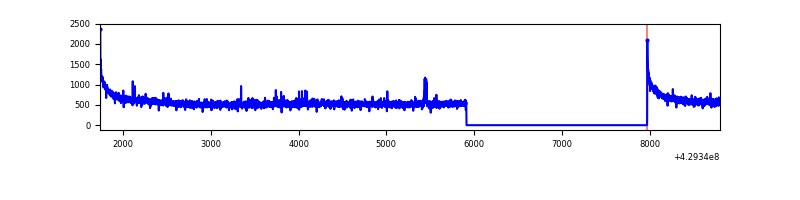 |
| B | 7068 | 5008 | 4 | 4 | 0.06% | 0.08% | 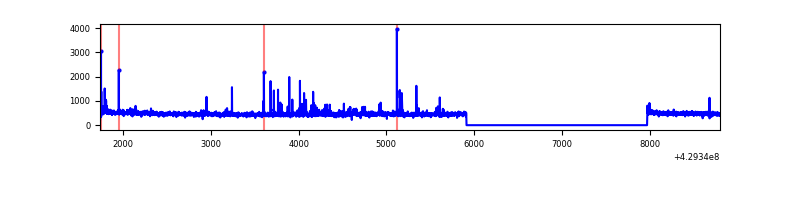 |
| C | 7068 | 5008 | 0 | 0 | 0.00% | 0.00% | 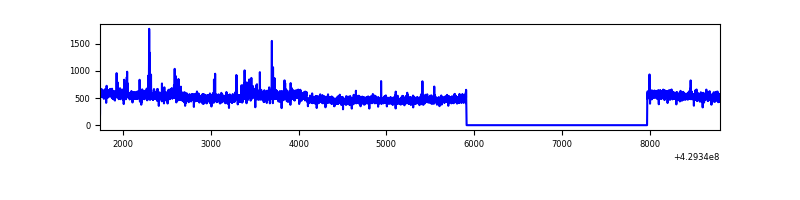 |
| D | 7068 | 5008 | 50 | 50 | 0.71% | 1.00% | 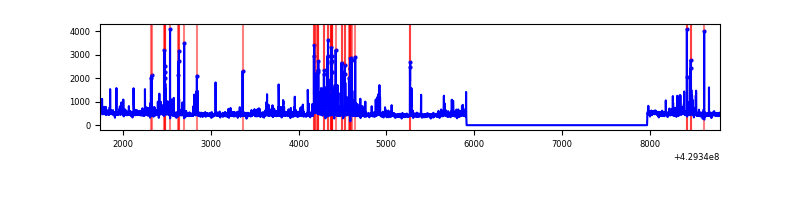 |
Top three noisy pixels from each quadrant. If the there are fewer than three noisy pixels in the level2.evt file, extra rows are filled as -1
| Pixel properties | Quadrant properties | ||||||
|---|---|---|---|---|---|---|---|
| Quadrant | DetID | PixID | Counts | Sigma | Mean | Median | Sigma |
| A | 10 | 83 | 538648 | 4561.35 | 585 | 575 | 118.0 |
| A | 7 | 3 | 15688 | 128.12 | 585 | 575 | 118.0 |
| A | 2 | 79 | 13655 | 110.88 | 585 | 575 | 118.0 |
| B | 5 | 255 | 66795 | 612.43 | 577 | 562 | 108.1 |
| B | 0 | 245 | 28757 | 260.71 | 577 | 562 | 108.1 |
| B | 5 | 172 | 15931 | 142.11 | 577 | 562 | 108.1 |
| C | 15 | 214 | 211954 | 1616.77 | 574 | 580 | 130.7 |
| C | 9 | 54 | 58105 | 440.0 | 574 | 580 | 130.7 |
| C | 0 | 239 | 32029 | 240.55 | 574 | 580 | 130.7 |
| D | 1 | 47 | 153216 | 1114.85 | 573 | 559 | 136.9 |
| D | 1 | 52 | 107012 | 777.42 | 573 | 559 | 136.9 |
| D | 12 | 6 | 104717 | 760.66 | 573 | 559 | 136.9 |
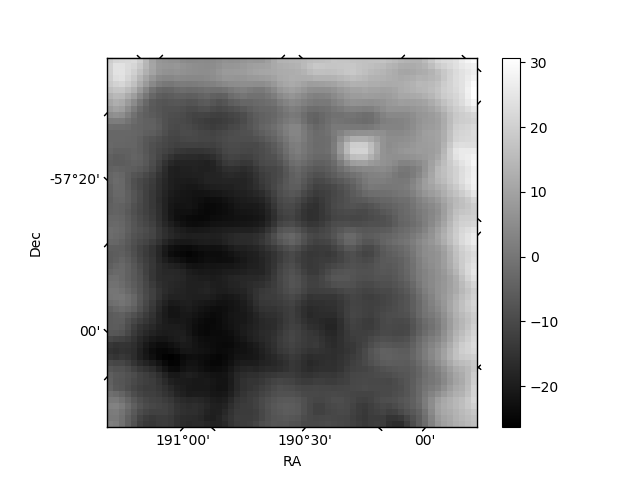
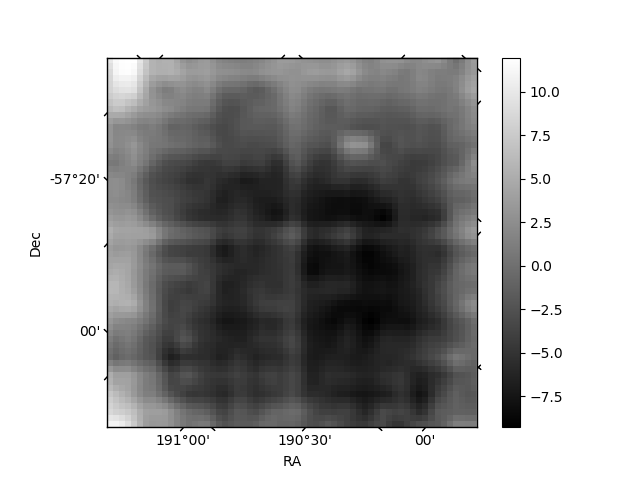
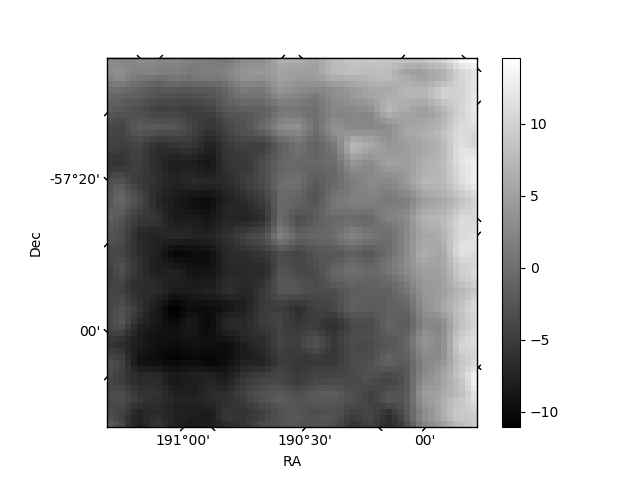
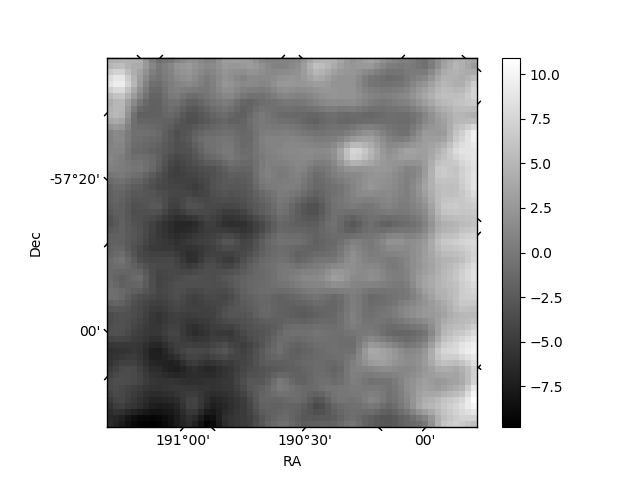
Histogram calculated using DETX and DETY for each event in the final _common_clean file
| Quadrant A | 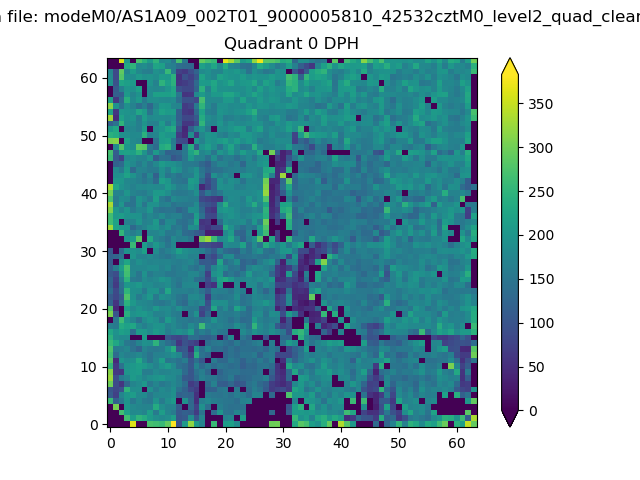 |
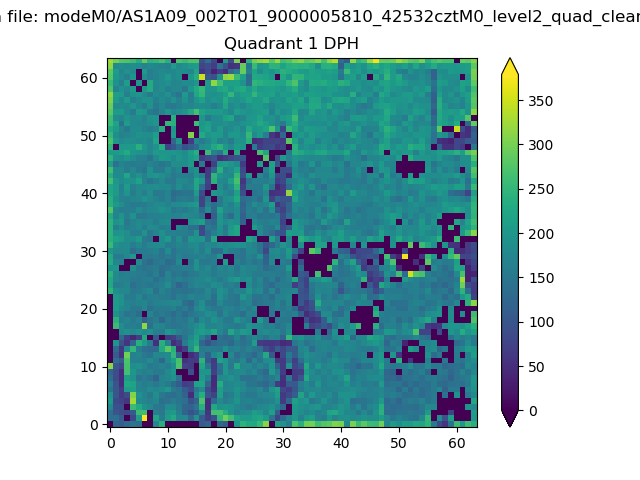 |
Quadrant B |
|---|---|---|---|
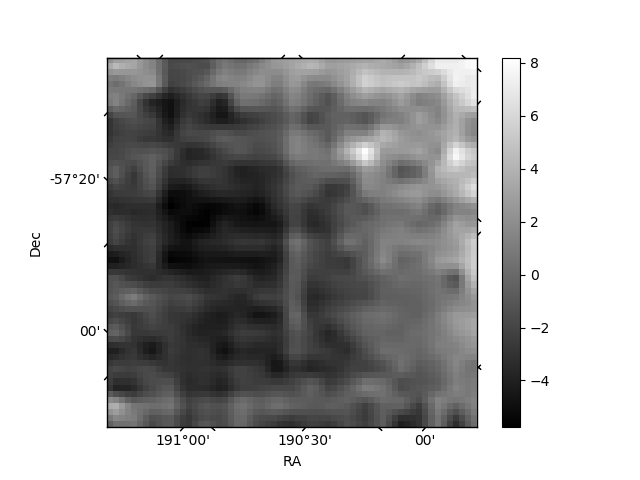
| Quadrant D |  |
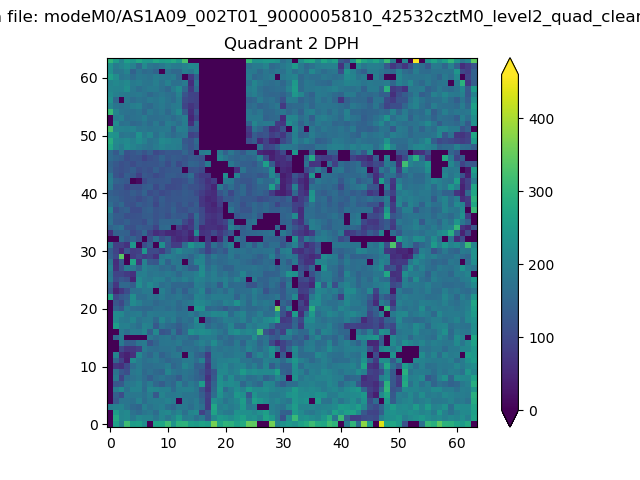 |
Quadrant C |
| Plot type | Count rate plots | Images |
|---|---|---|
| Comparison with Poisson distribution Blue bars denote a histogram of data divided into 1 sec bins. Red curve is a Poisson curve with rate = median count rate of data. |
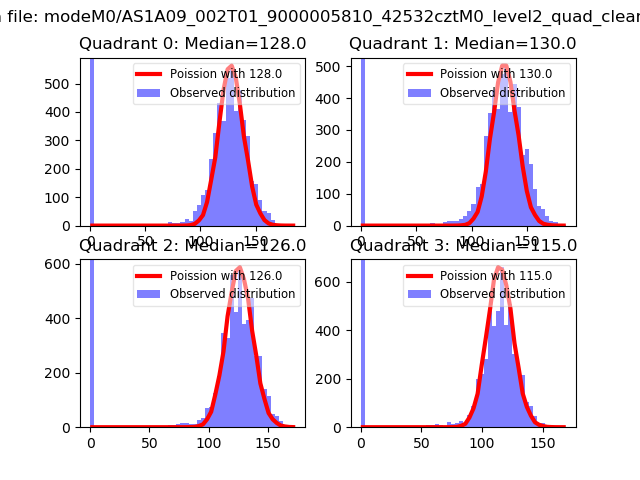 |
 |
| Quadrant-wise count rates Data is divided into 100 sec bins |
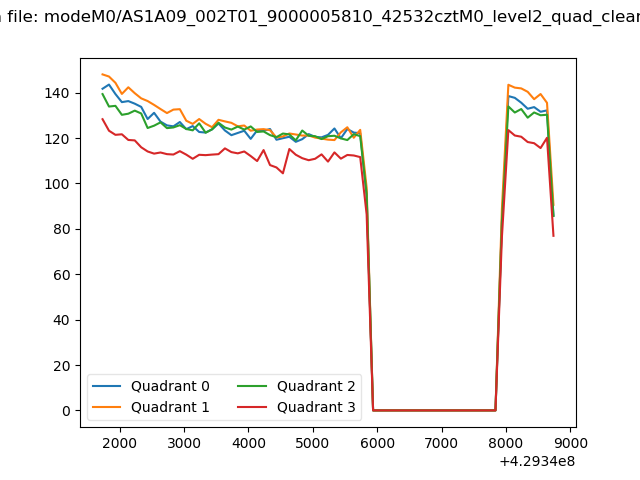 |
|
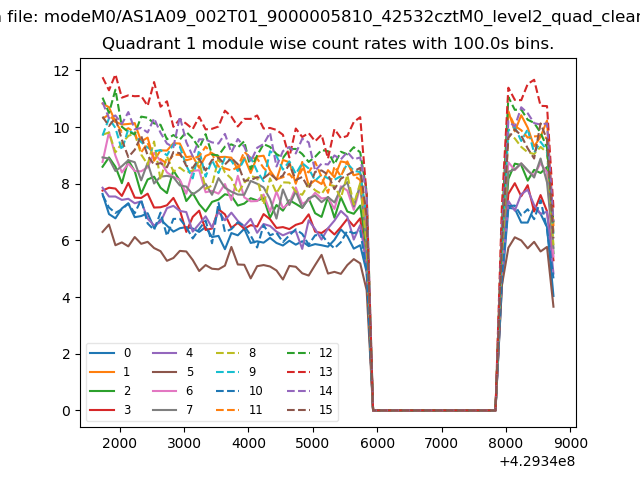
| Module-wise count rates for Quadrant A Data is divided into 100 sec bins |
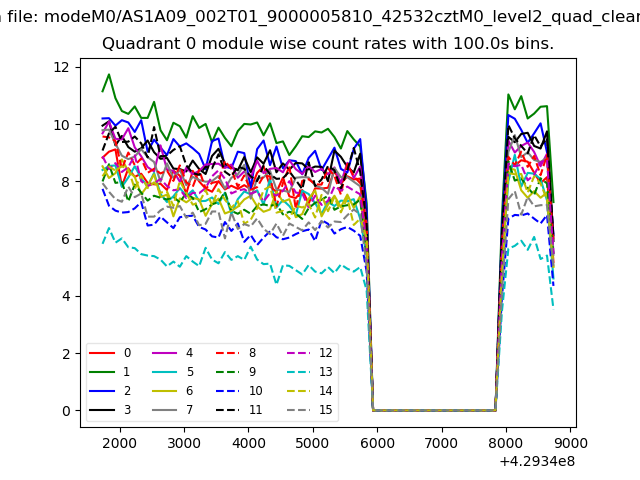 |
 |
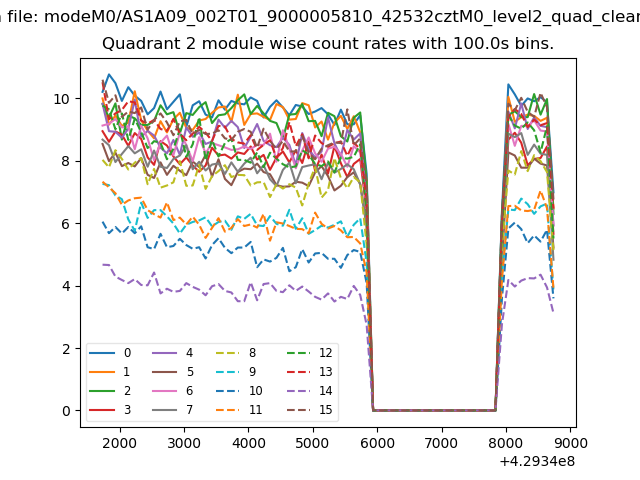
| Module-wise count rates for Quadrant B Data is divided into 100 sec bins |
 |
 |
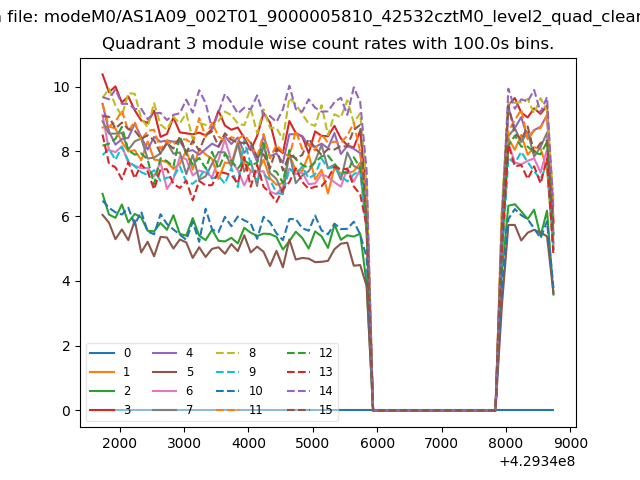
| Module-wise count rates for Quadrant C Data is divided into 100 sec bins |
 |
 |
| Module-wise count rates for Quadrant D Data is divided into 100 sec bins |
 |
 |
| Parameter | Plot |
|---|---|
| CZT HV Monitor | 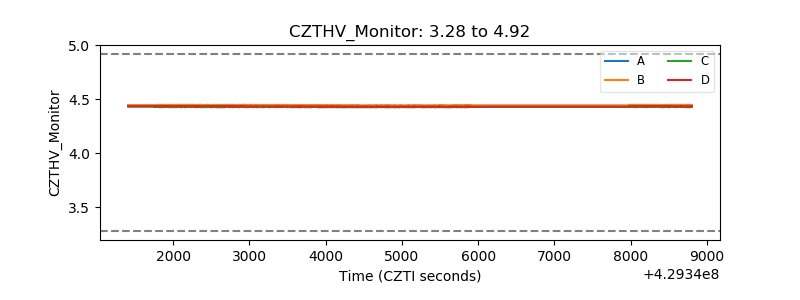 |
| D_VDD | 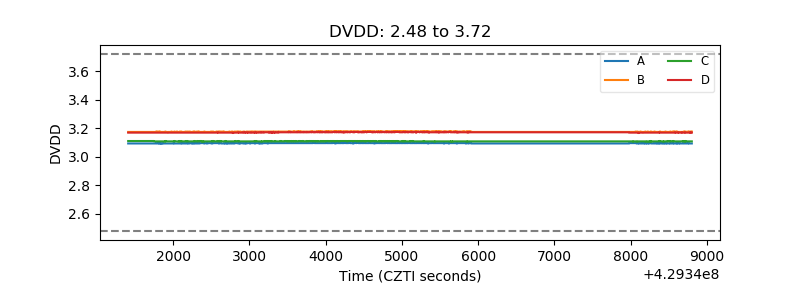 |
| Temperature 1 | 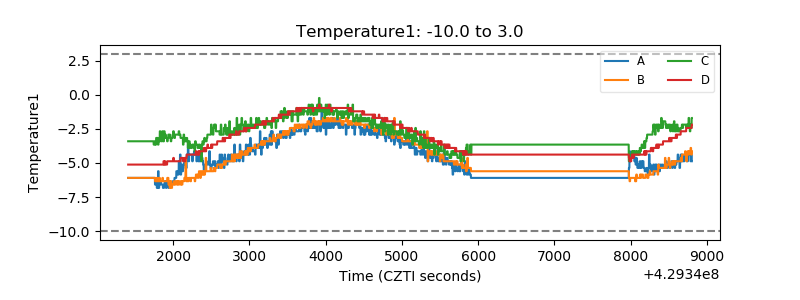 |
| Veto HV Monitor |  |
| Veto LLD | 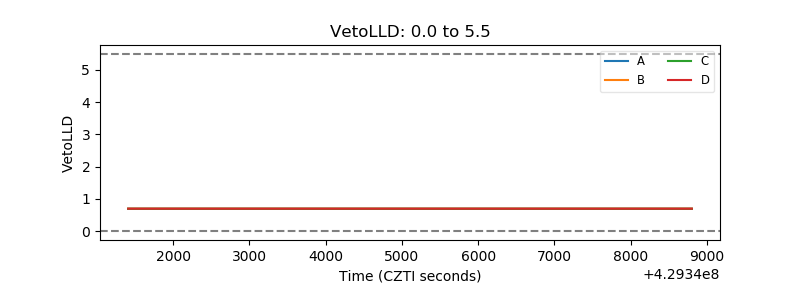 |
| Alpha Counter | 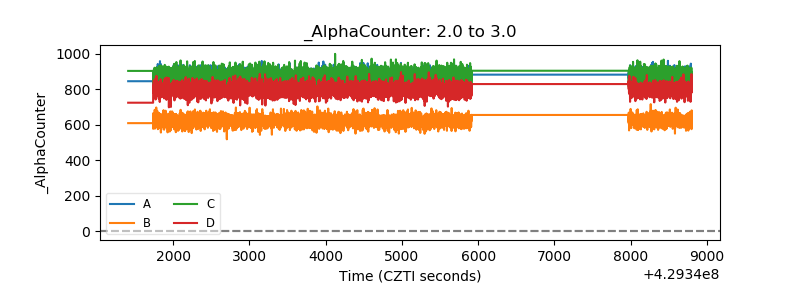 |
| _CPM_Rate |  |
| CZT Counter | 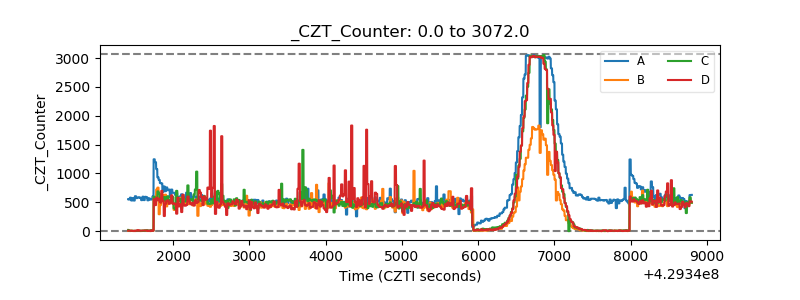 |
| +2.5 Volts monitor | 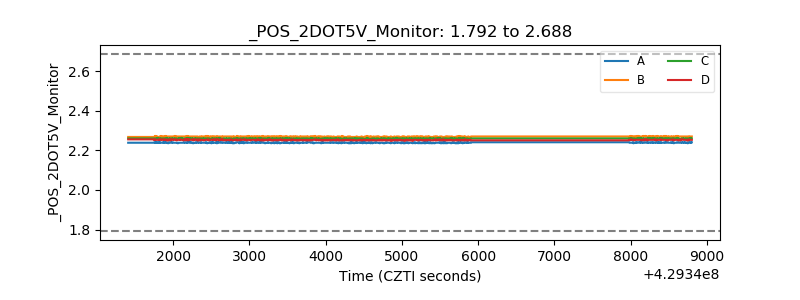 |
| +5 Volts monitor | 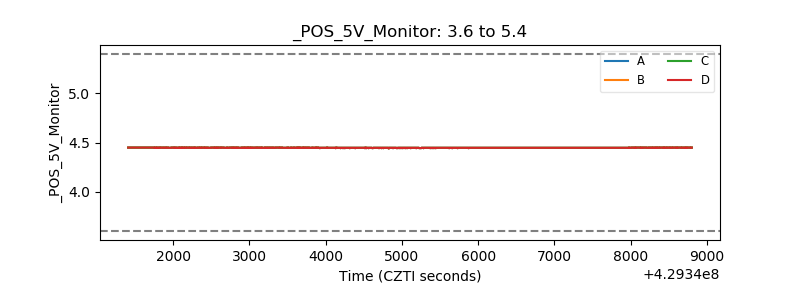 |
| _ROLL_ROT | 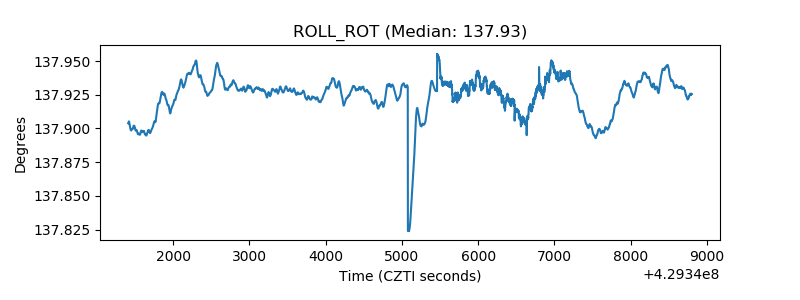 |
| _Roll_DEC | 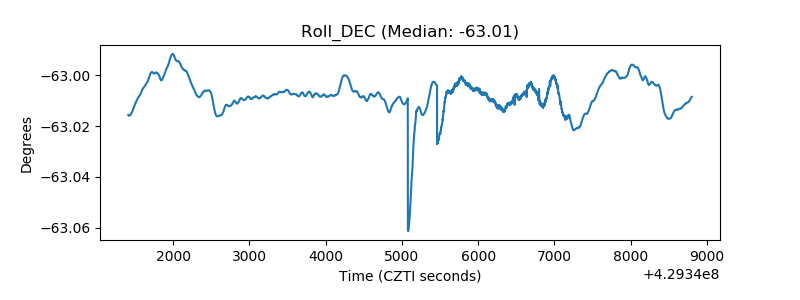 |
| _Roll_RA | 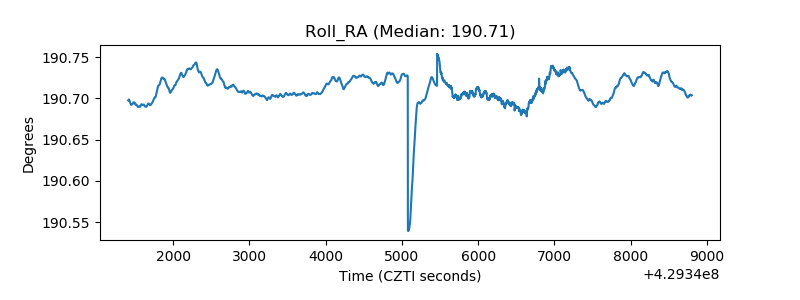 |
| Veto Counter | 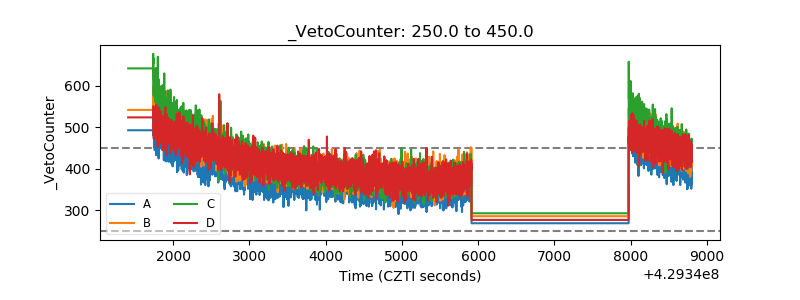 |