| Param | Original file | Final file |
|---|---|---|
| Filename | modeM0/AS1A09_002T01_9000005810_42533cztM0_level2.fits | modeM0/AS1A09_002T01_9000005810_42533cztM0_level2_quad_clean.evt |
| Size (bytes) | 289,307,520 | 92,298,240 |
| Size | 275.9 MB | 88.0 MB |
| Events in quadrant A | 2,799,928 | 627,400 |
| Events in quadrant B | 2,449,994 | 638,518 |
| Events in quadrant C | 2,530,137 | 615,400 |
| Events in quadrant D | 2,541,729 | 565,426 |
| Mode M0 | |||
|---|---|---|---|
| Quadrant | BADHDUFLAG | Total packets | Discarded packets |
| A | 0 | 11168 | 15 |
| B | 0 | 10501 | 8 |
| C | 0 | 10506 | 37 |
| D | 0 | 10854 | 7 |
| Mode M9 | |||
|---|---|---|---|
| Quadrant | BADHDUFLAG | Total packets | Discarded packets |
| A | 0 | 28 | 0 |
| B | 0 | 29 | 0 |
| C | 0 | 29 | 0 |
| D | 0 | 29 | 0 |
| Mode SS | |||
|---|---|---|---|
| Quadrant | BADHDUFLAG | Total packets | Discarded packets |
| A | 0 | 102 | 0 |
| B | 0 | 102 | 0 |
| C | 0 | 102 | 0 |
| D | 0 | 102 | 0 |
| Quadrant | Total seconds | Saturated seconds | Saturation percentage |
|---|---|---|---|
| A | 4967 | 10 | 0.201329% |
| B | 4970 | 27 | 0.543260% |
| C | 4962 | 12 | 0.241838% |
| D | 4970 | 27 | 0.543260% |
Noise dominated data is calculated using 1-second bins in cleaned event files. If a bin has >2000 counts, and if more than 50% of those come from <1% of pixels, then it is considered to be noise-dominated and hence unusable.
| Quadrant | # 1 sec bins | Bins with >0 counts | Bins with >2000 counts | High rate bins dominated by noise | Noise dominated (total time) | Noise dominated (detector-on time) | Marked lightcurve |
|---|---|---|---|---|---|---|---|
| A | 7096 | 4973 | 4 | 4 | 0.06% | 0.08% | 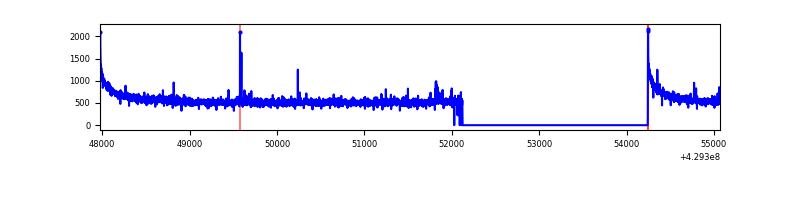 |
| B | 7096 | 4975 | 13 | 13 | 0.18% | 0.26% | 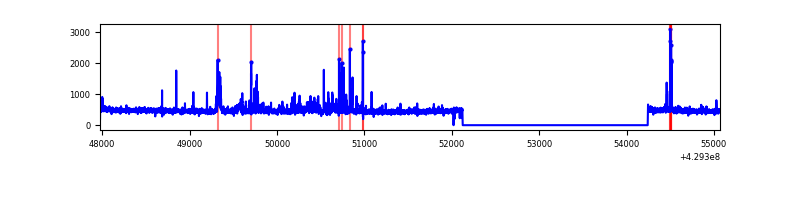 |
| C | 7096 | 4972 | 7 | 7 | 0.10% | 0.14% | 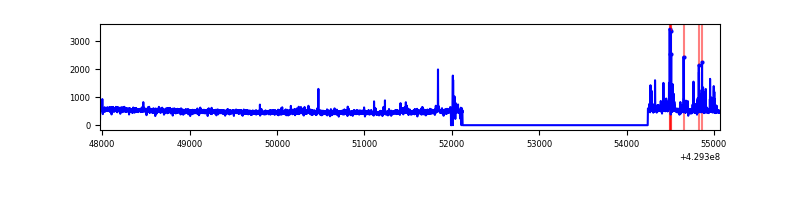 |
| D | 7096 | 4976 | 27 | 27 | 0.38% | 0.54% | 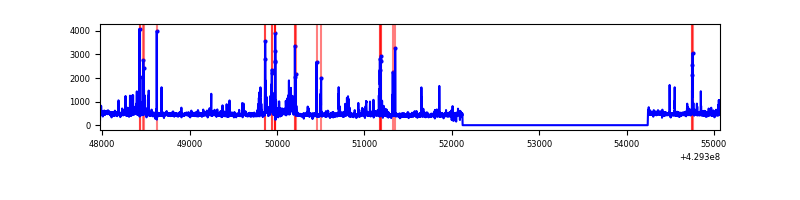 |
Top three noisy pixels from each quadrant. If the there are fewer than three noisy pixels in the level2.evt file, extra rows are filled as -1
| Pixel properties | Quadrant properties | ||||||
|---|---|---|---|---|---|---|---|
| Quadrant | DetID | PixID | Counts | Sigma | Mean | Median | Sigma |
| A | 10 | 83 | 538468 | 4633.54 | 571 | 562 | 116.1 |
| A | 13 | 248 | 23092 | 194.07 | 571 | 562 | 116.1 |
| A | 2 | 79 | 18853 | 157.55 | 571 | 562 | 116.1 |
| B | 0 | 245 | 123519 | 1164.22 | 564 | 551 | 105.6 |
| B | 5 | 255 | 50048 | 468.62 | 564 | 551 | 105.6 |
| B | 5 | 172 | 33775 | 314.55 | 564 | 551 | 105.6 |
| C | 15 | 214 | 211193 | 1637.77 | 556 | 561 | 128.6 |
| C | 15 | 111 | 99872 | 772.19 | 556 | 561 | 128.6 |
| C | 0 | 239 | 24412 | 185.45 | 556 | 561 | 128.6 |
| D | 1 | 52 | 109626 | 801.71 | 559 | 546 | 136.1 |
| D | 12 | 33 | 82790 | 604.47 | 559 | 546 | 136.1 |
| D | 12 | 233 | 50960 | 370.53 | 559 | 546 | 136.1 |
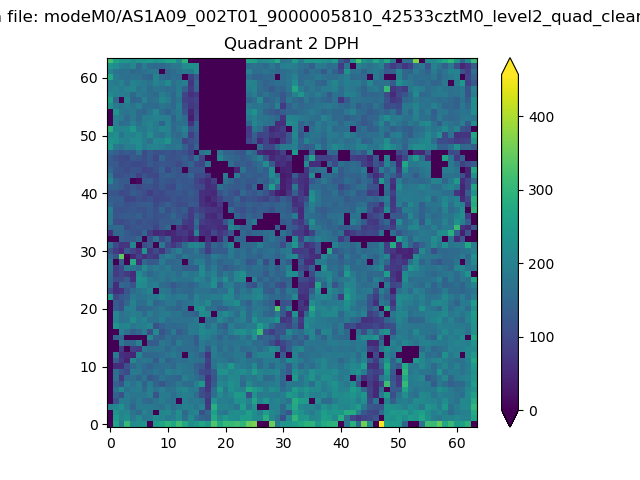
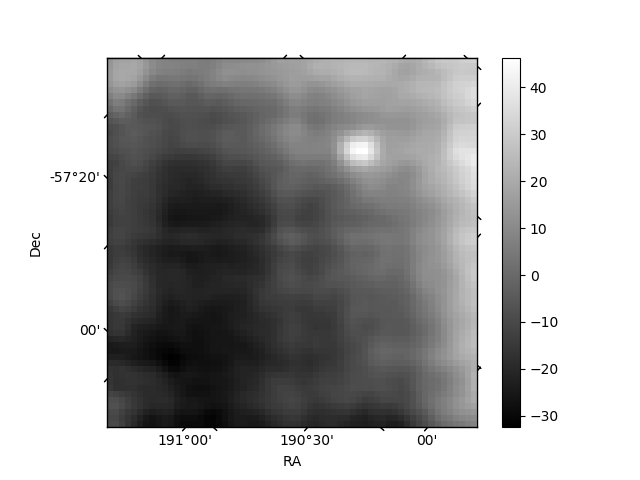
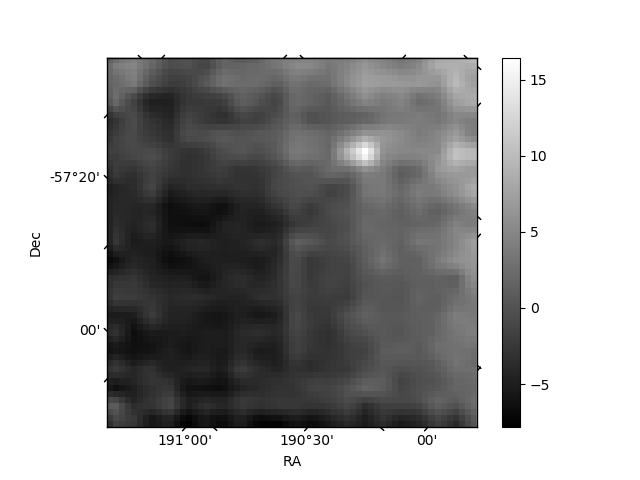
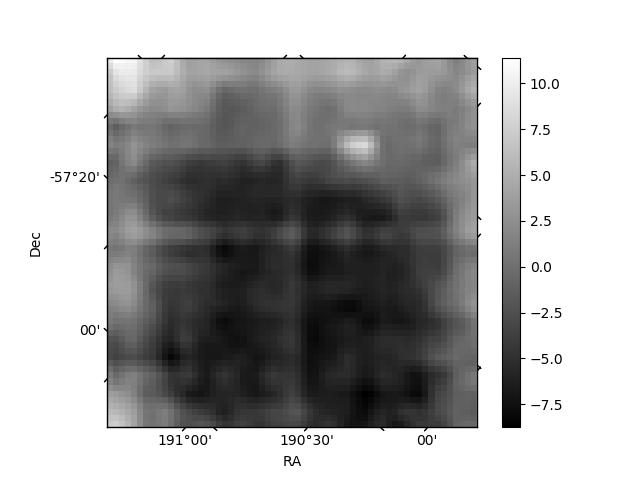
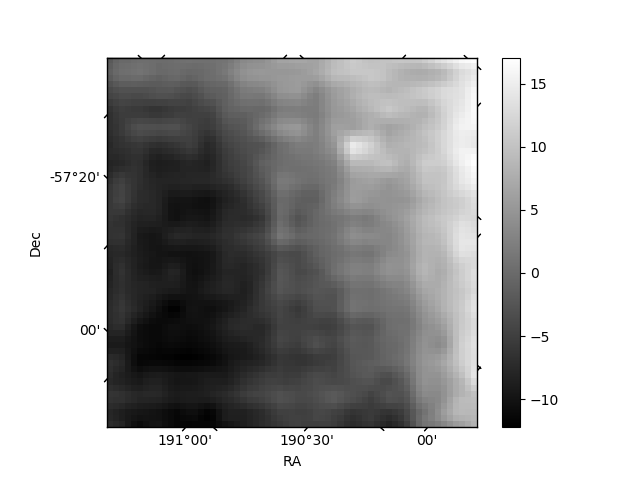
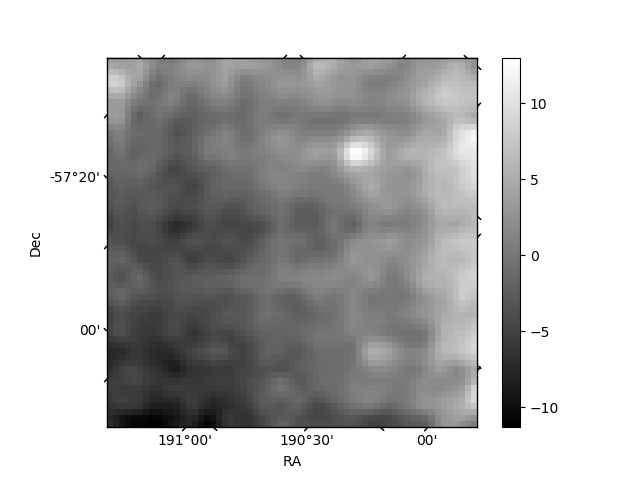
Histogram calculated using DETX and DETY for each event in the final _common_clean file
| Quadrant A | 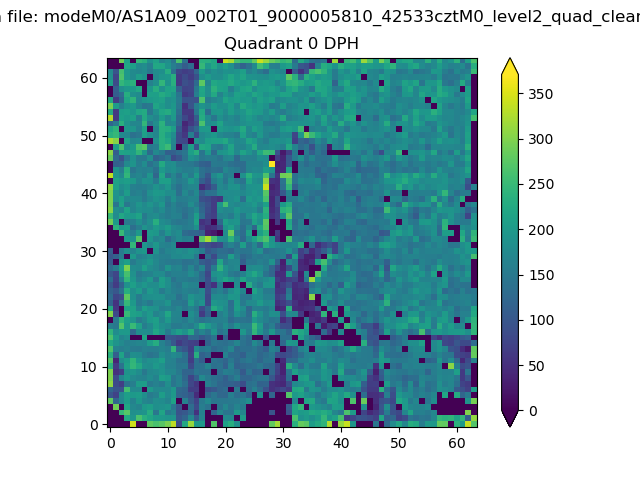 |
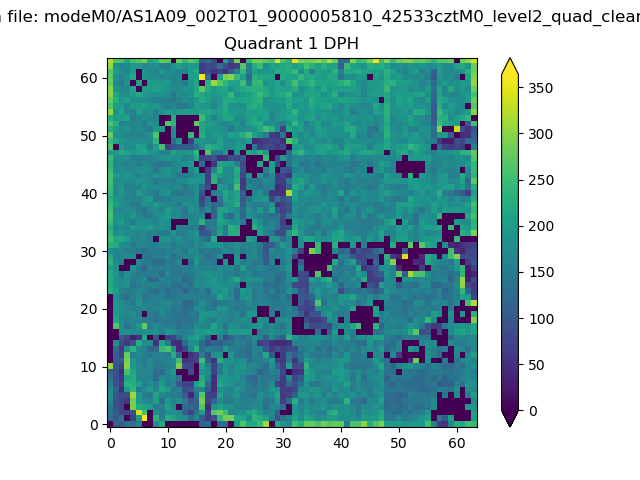 |
Quadrant B |
|---|---|---|---|
| Quadrant D | 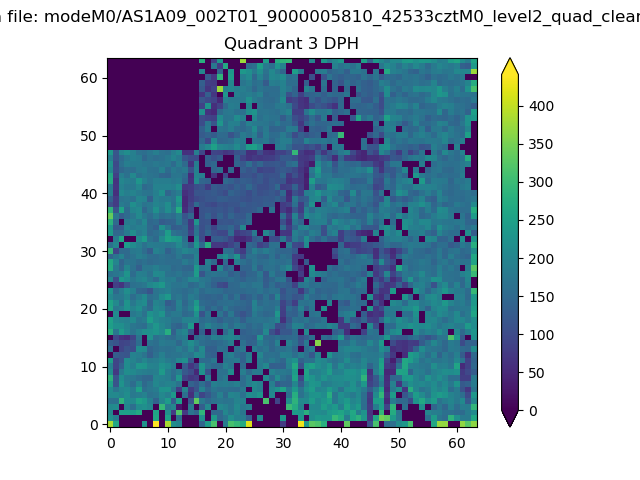 |
 |
Quadrant C |
| Plot type | Count rate plots | Images |
|---|---|---|
| Comparison with Poisson distribution Blue bars denote a histogram of data divided into 1 sec bins. Red curve is a Poisson curve with rate = median count rate of data. |
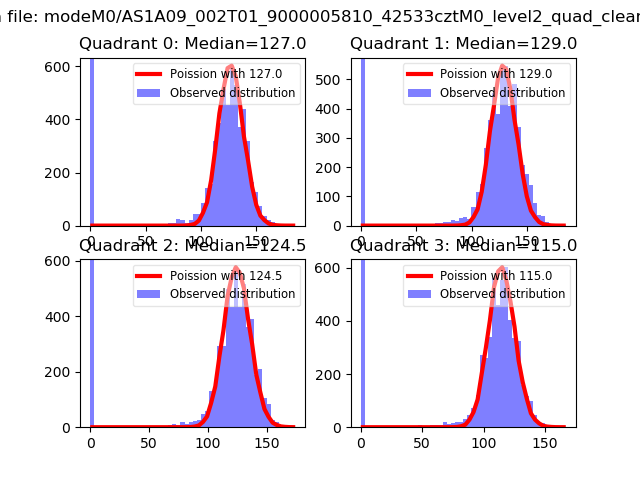 |
 |
| Quadrant-wise count rates Data is divided into 100 sec bins |
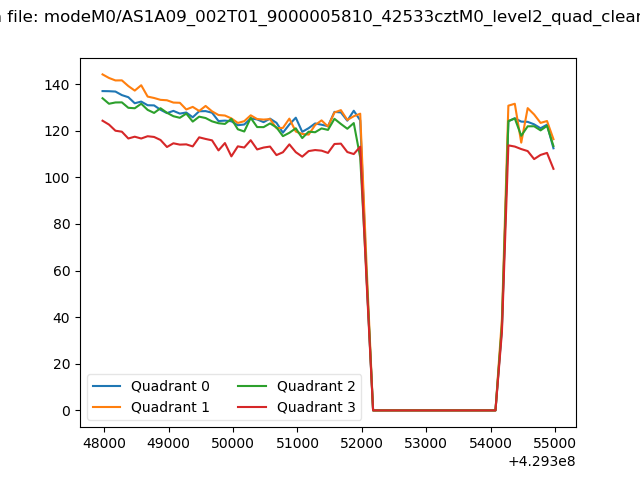 |
|
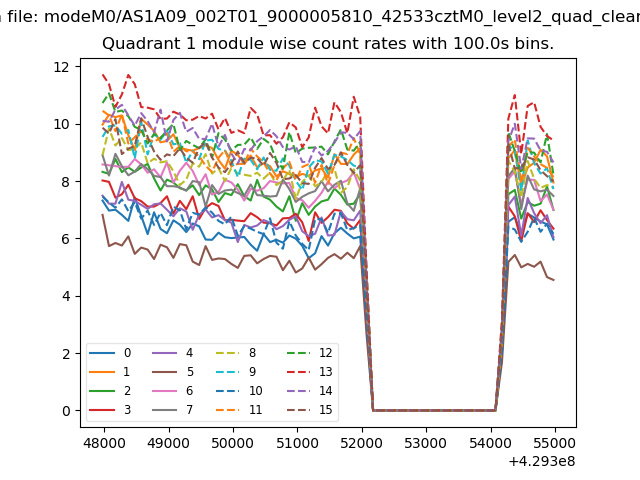
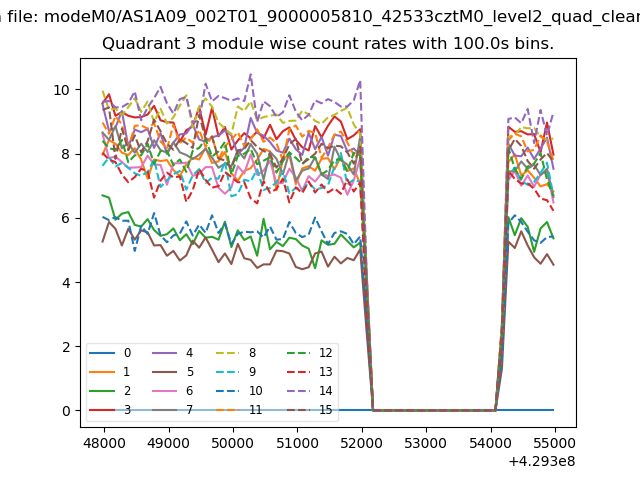
| Module-wise count rates for Quadrant A Data is divided into 100 sec bins |
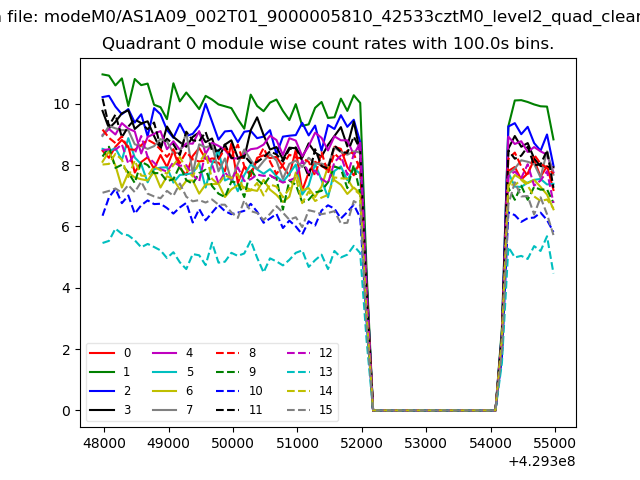 |
 |
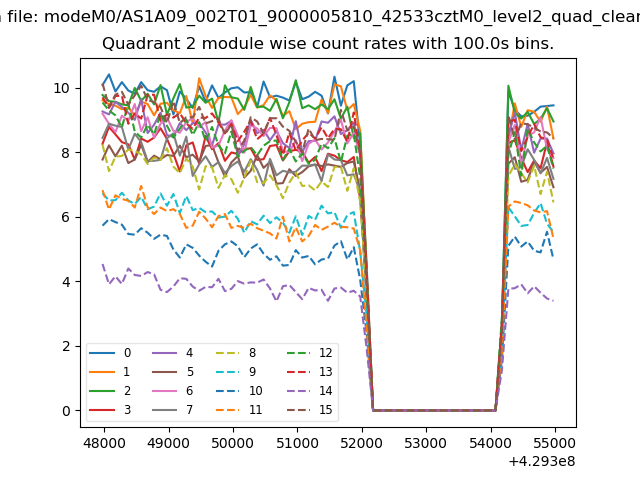
| Module-wise count rates for Quadrant B Data is divided into 100 sec bins |
 |
 |
| Module-wise count rates for Quadrant C Data is divided into 100 sec bins |
 |
 |
| Module-wise count rates for Quadrant D Data is divided into 100 sec bins |
 |
 |
| Parameter | Plot |
|---|---|
| CZT HV Monitor | 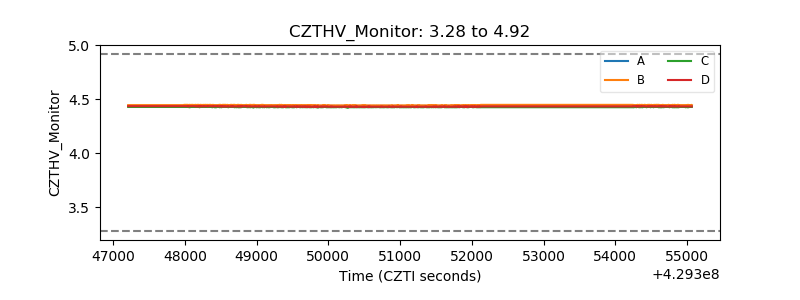 |
| D_VDD | 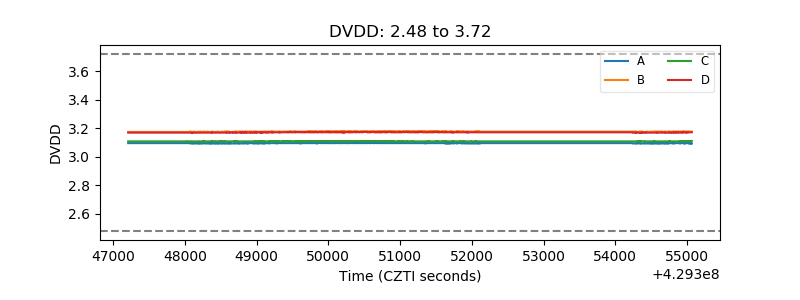 |
| Temperature 1 | 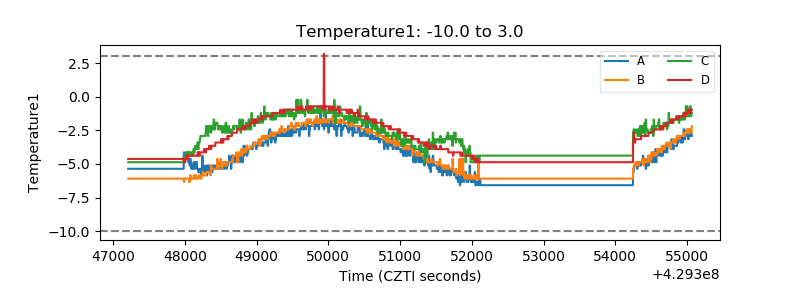 |
| Veto HV Monitor | 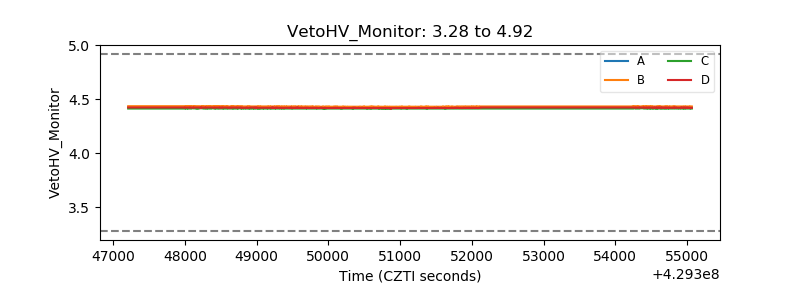 |
| Veto LLD | 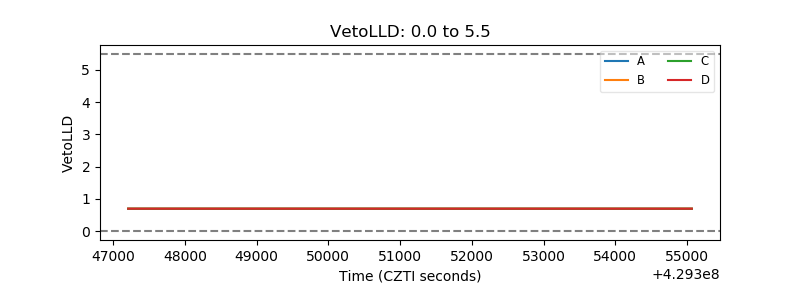 |
| Alpha Counter | 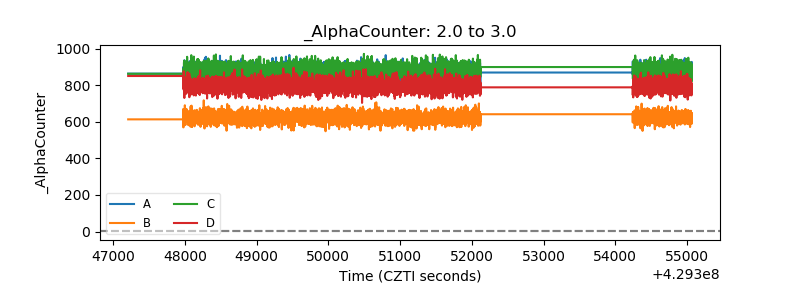 |
| _CPM_Rate | 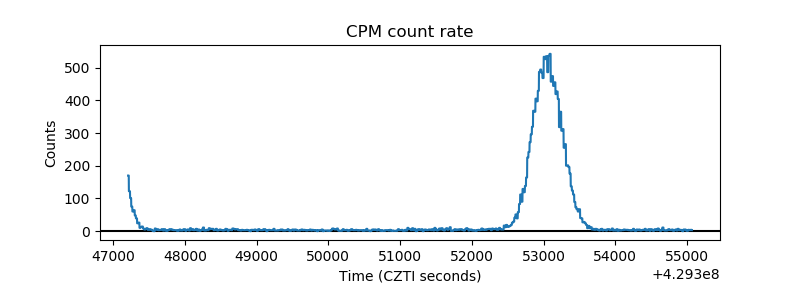 |
| CZT Counter | 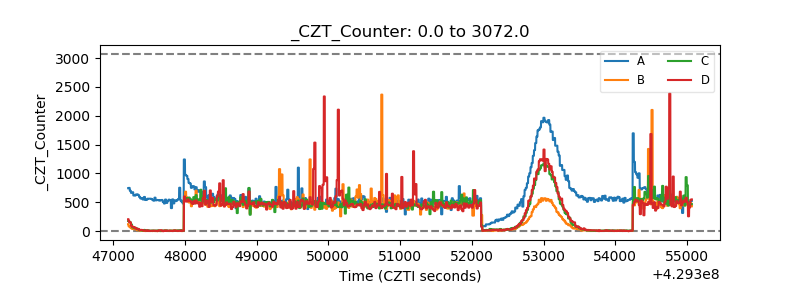 |
| +2.5 Volts monitor | 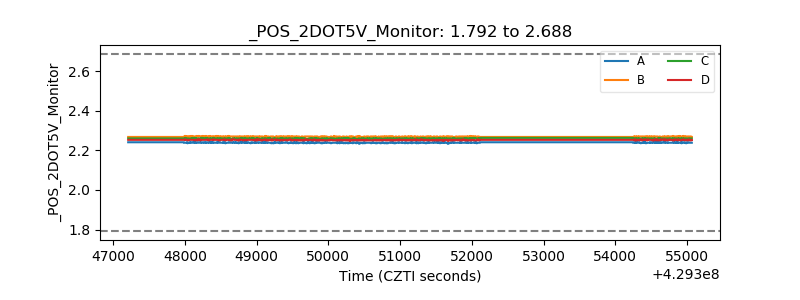 |
| +5 Volts monitor | 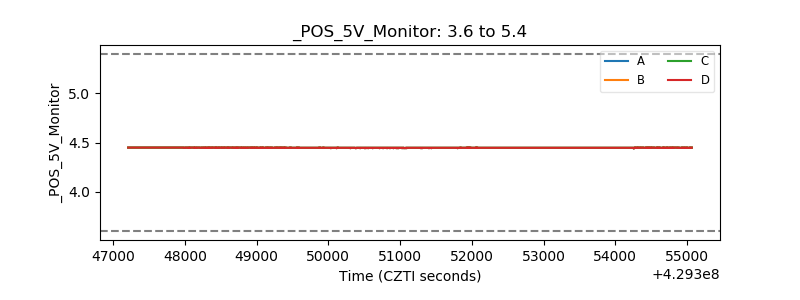 |
| _ROLL_ROT | 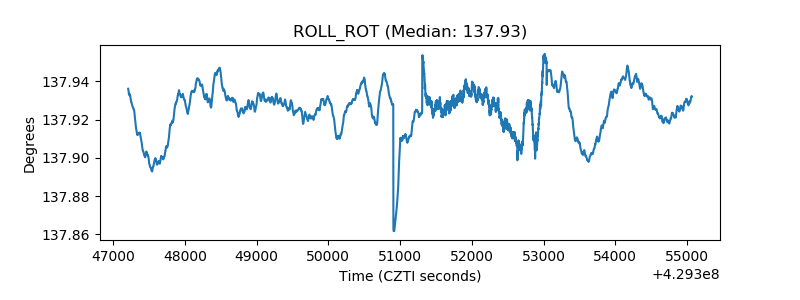 |
| _Roll_DEC | 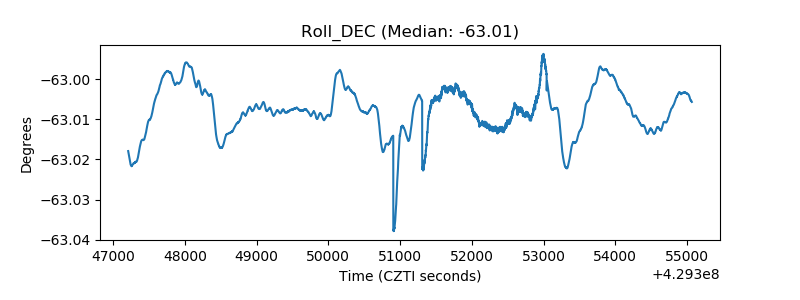 |
| _Roll_RA | 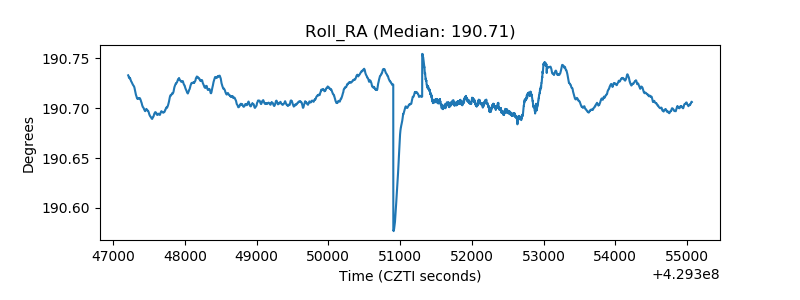 |
| Veto Counter | 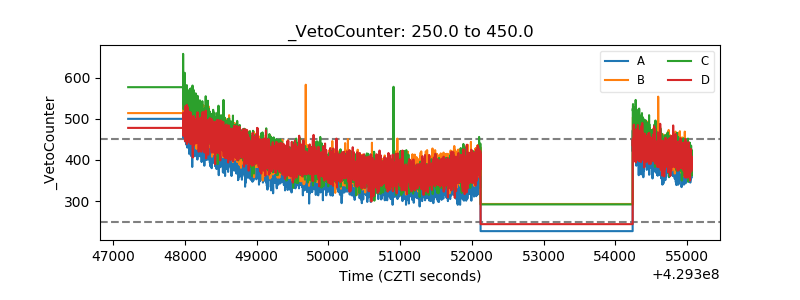 |