| Param | Original file | Final file |
|---|---|---|
| Filename | modeM0/AS1A09_002T01_9000005810_42534cztM0_level2.fits | modeM0/AS1A09_002T01_9000005810_42534cztM0_level2_quad_clean.evt |
| Size (bytes) | 300,804,480 | 90,662,400 |
| Size | 286.9 MB | 86.5 MB |
| Events in quadrant A | 2,864,176 | 611,265 |
| Events in quadrant B | 2,435,993 | 616,201 |
| Events in quadrant C | 2,526,175 | 605,234 |
| Events in quadrant D | 2,902,578 | 548,156 |
| Mode M0 | |||
|---|---|---|---|
| Quadrant | BADHDUFLAG | Total packets | Discarded packets |
| A | 0 | 11492 | 2 |
| B | 0 | 10888 | 2 |
| C | 0 | 10845 | 2 |
| D | 0 | 12184 | 2 |
| Mode M9 | |||
|---|---|---|---|
| Quadrant | BADHDUFLAG | Total packets | Discarded packets |
| A | 0 | 21 | 0 |
| B | 0 | 21 | 0 |
| C | 0 | 21 | 0 |
| D | 0 | 21 | 0 |
| Mode SS | |||
|---|---|---|---|
| Quadrant | BADHDUFLAG | Total packets | Discarded packets |
| A | 0 | 106 | 0 |
| B | 0 | 106 | 0 |
| C | 0 | 106 | 0 |
| D | 0 | 106 | 0 |
| Quadrant | Total seconds | Saturated seconds | Saturation percentage |
|---|---|---|---|
| A | 5205 | 12 | 0.230548% |
| B | 5205 | 30 | 0.576369% |
| C | 5205 | 11 | 0.211335% |
| D | 5205 | 125 | 2.401537% |
Noise dominated data is calculated using 1-second bins in cleaned event files. If a bin has >2000 counts, and if more than 50% of those come from <1% of pixels, then it is considered to be noise-dominated and hence unusable.
| Quadrant | # 1 sec bins | Bins with >0 counts | Bins with >2000 counts | High rate bins dominated by noise | Noise dominated (total time) | Noise dominated (detector-on time) | Marked lightcurve |
|---|---|---|---|---|---|---|---|
| A | 7297 | 5206 | 16 | 16 | 0.22% | 0.31% | 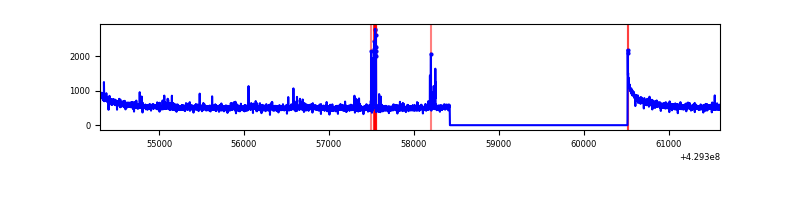 |
| B | 7297 | 5206 | 16 | 16 | 0.22% | 0.31% | 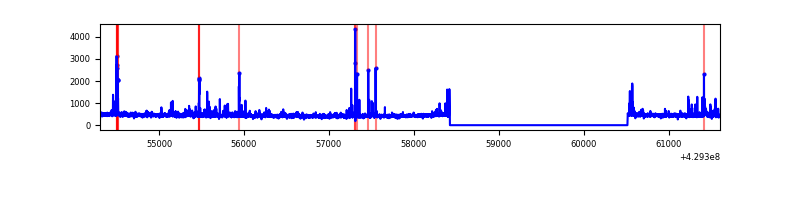 |
| C | 7297 | 5206 | 10 | 10 | 0.14% | 0.19% | 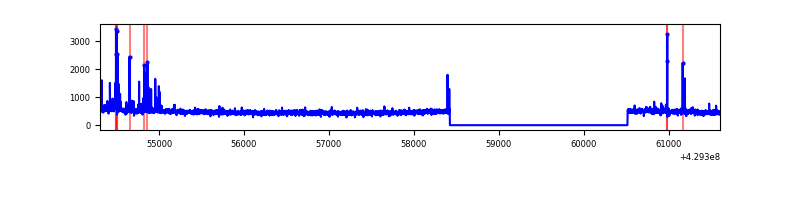 |
| D | 7297 | 5206 | 118 | 118 | 1.62% | 2.27% | 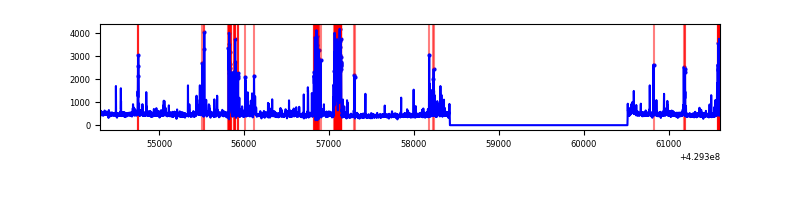 |
Top three noisy pixels from each quadrant. If the there are fewer than three noisy pixels in the level2.evt file, extra rows are filled as -1
| Pixel properties | Quadrant properties | ||||||
|---|---|---|---|---|---|---|---|
| Quadrant | DetID | PixID | Counts | Sigma | Mean | Median | Sigma |
| A | 10 | 83 | 539710 | 4587.08 | 574 | 563 | 117.5 |
| A | 13 | 248 | 69902 | 589.94 | 574 | 563 | 117.5 |
| A | 2 | 79 | 32884 | 274.99 | 574 | 563 | 117.5 |
| B | 0 | 245 | 89233 | 827.09 | 563 | 549 | 107.2 |
| B | 5 | 172 | 70451 | 651.92 | 563 | 549 | 107.2 |
| B | 5 | 255 | 44422 | 409.17 | 563 | 549 | 107.2 |
| C | 15 | 214 | 221300 | 1729.59 | 555 | 560 | 127.6 |
| C | 15 | 111 | 85407 | 664.81 | 555 | 560 | 127.6 |
| C | 9 | 54 | 16043 | 121.32 | 555 | 560 | 127.6 |
| D | 12 | 233 | 265819 | 1966.75 | 556 | 543 | 134.9 |
| D | 2 | 249 | 182707 | 1350.56 | 556 | 543 | 134.9 |
| D | 1 | 52 | 66755 | 490.89 | 556 | 543 | 134.9 |
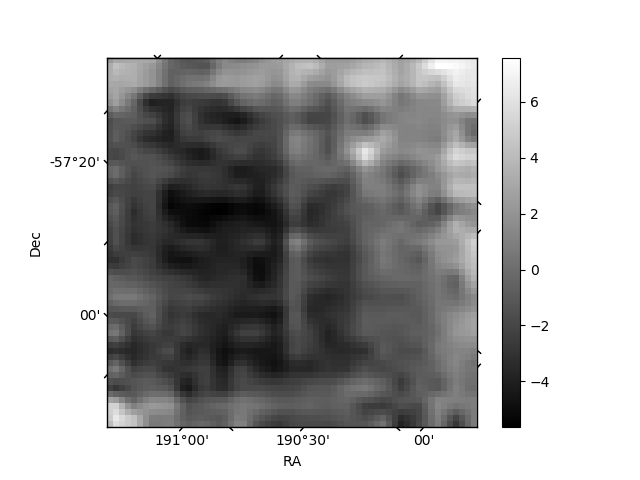
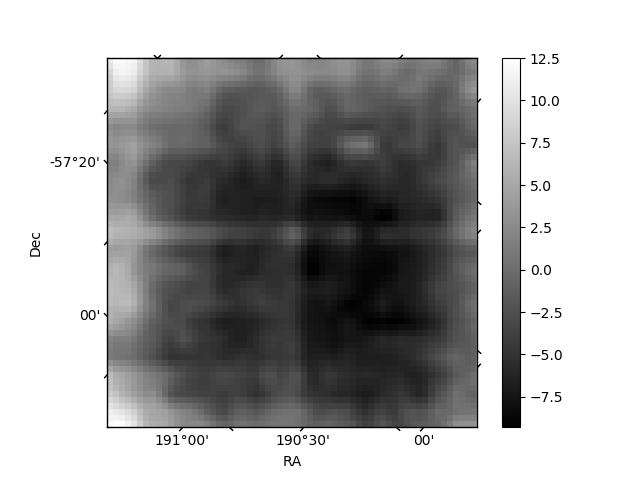
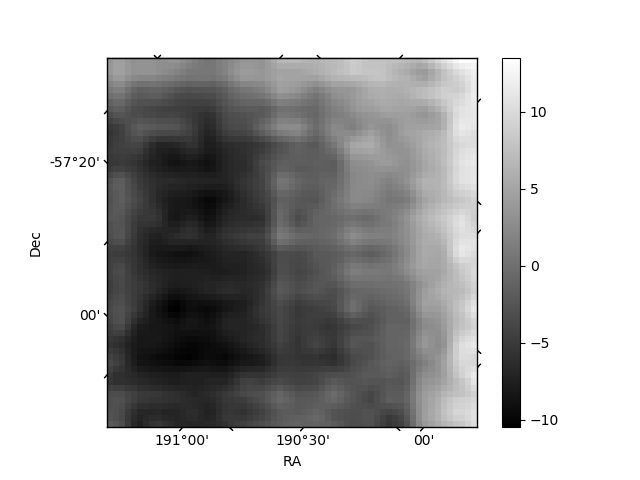
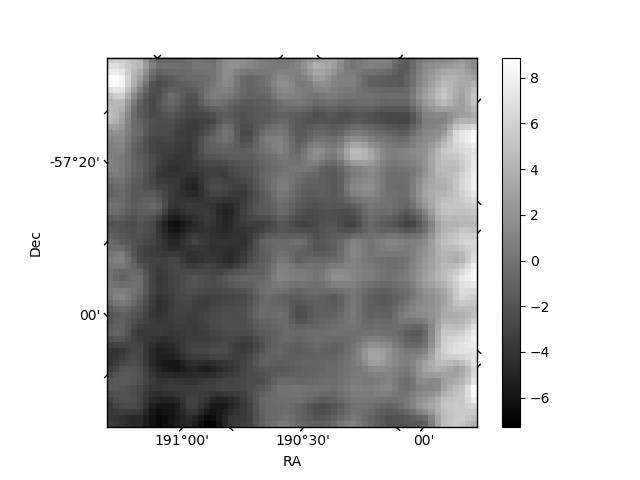
Histogram calculated using DETX and DETY for each event in the final _common_clean file
| Quadrant A | 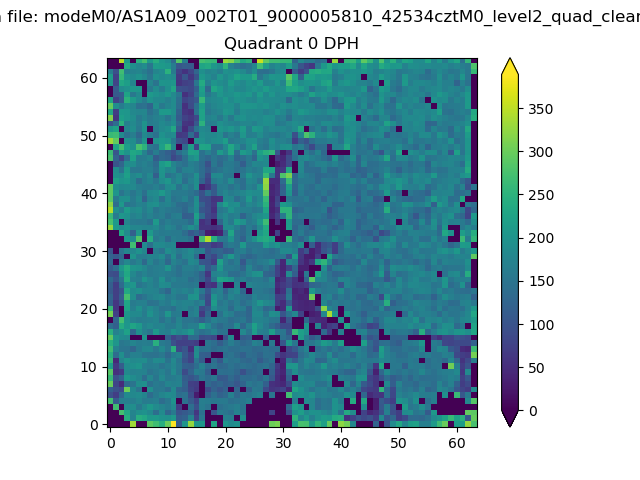 |
 |
Quadrant B |
|---|---|---|---|
| Quadrant D | 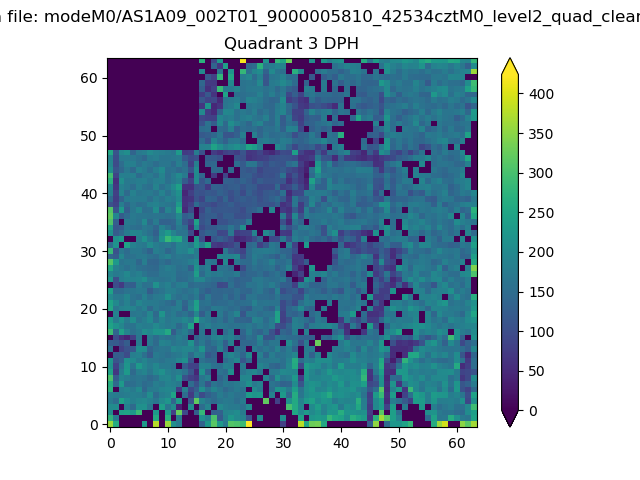 |
 |
Quadrant C |
| Plot type | Count rate plots | Images |
|---|---|---|
| Comparison with Poisson distribution Blue bars denote a histogram of data divided into 1 sec bins. Red curve is a Poisson curve with rate = median count rate of data. |
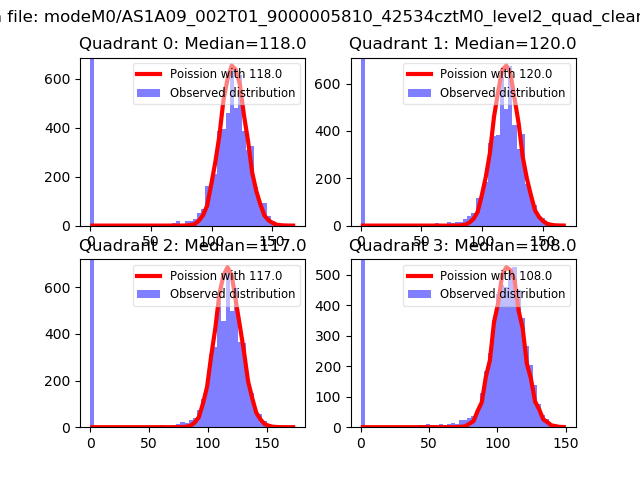 |
 |
| Quadrant-wise count rates Data is divided into 100 sec bins |
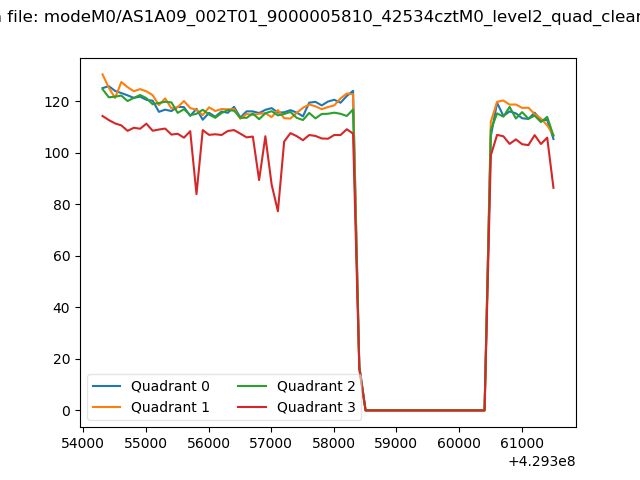 |
|
| Module-wise count rates for Quadrant A Data is divided into 100 sec bins |
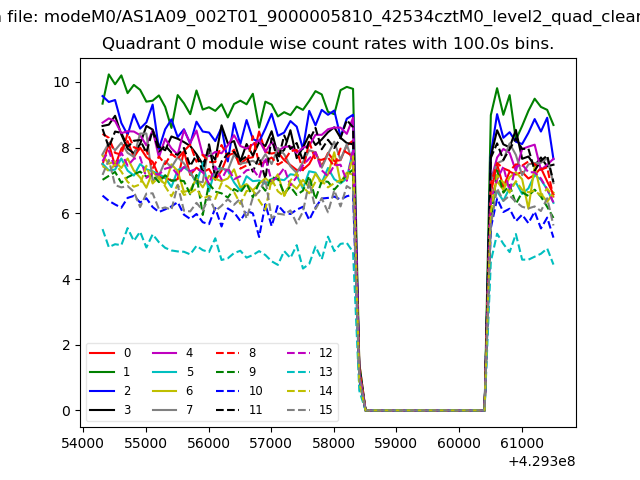 |
 |
| Module-wise count rates for Quadrant B Data is divided into 100 sec bins |
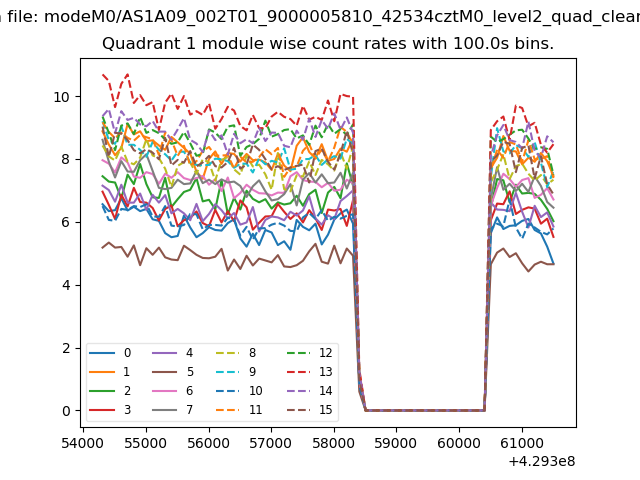 |
 |
| Module-wise count rates for Quadrant C Data is divided into 100 sec bins |
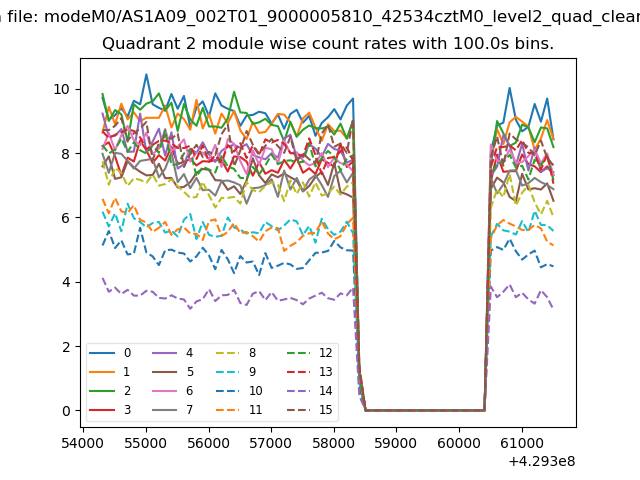 |
 |
| Module-wise count rates for Quadrant D Data is divided into 100 sec bins |
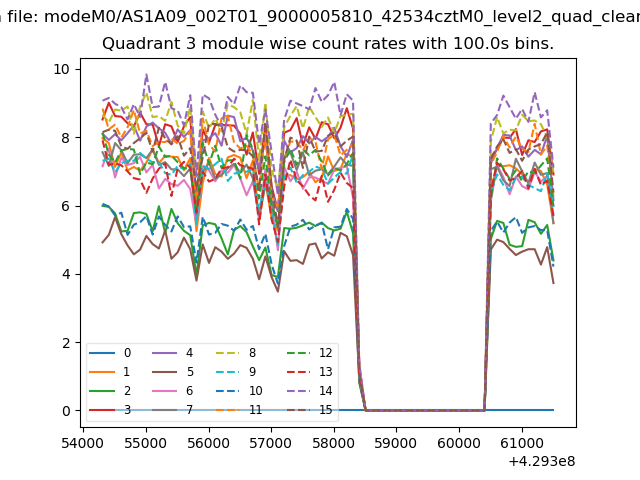 |
 |
| Parameter | Plot |
|---|---|
| CZT HV Monitor | 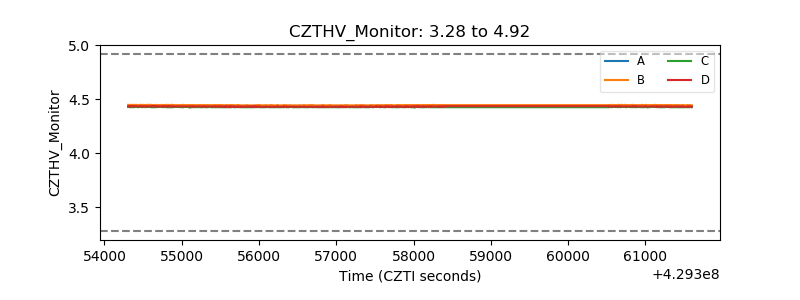 |
| D_VDD | 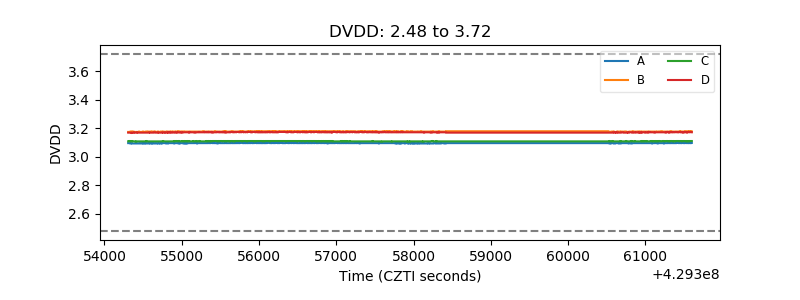 |
| Temperature 1 | 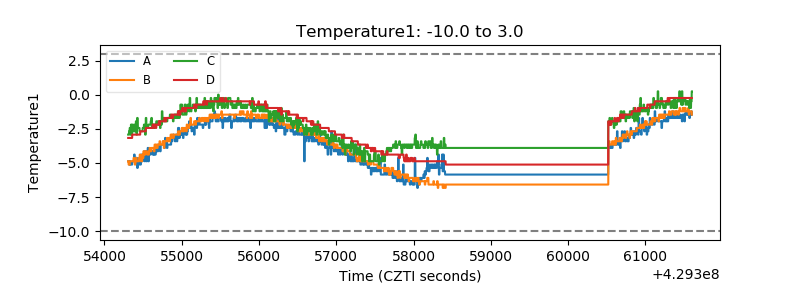 |
| Veto HV Monitor | 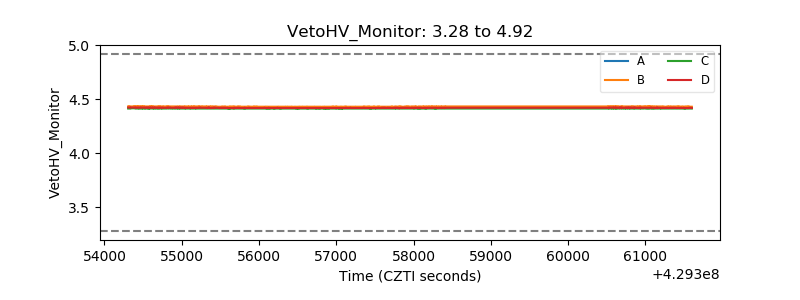 |
| Veto LLD | 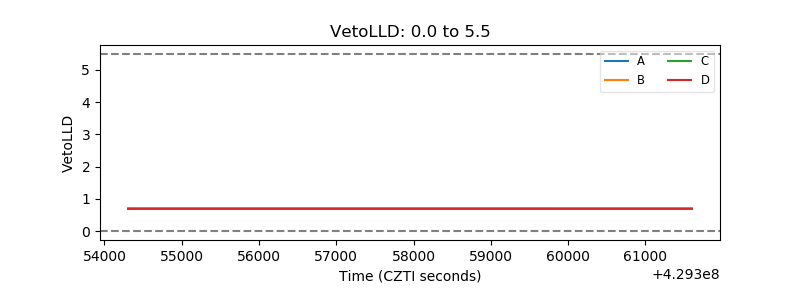 |
| Alpha Counter | 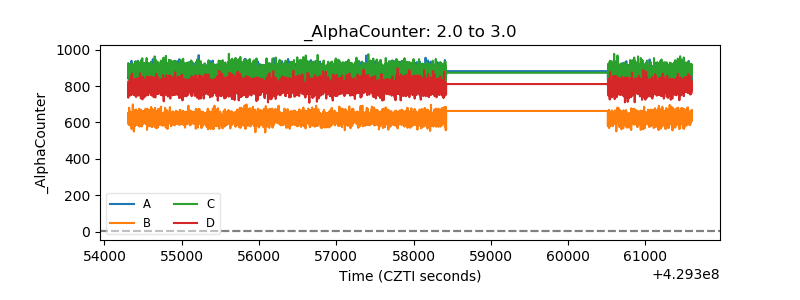 |
| _CPM_Rate | 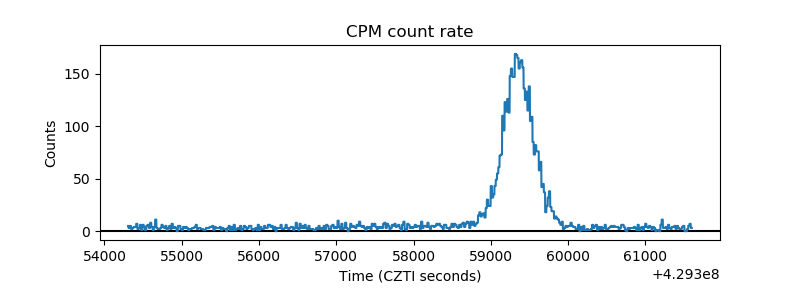 |
| CZT Counter | 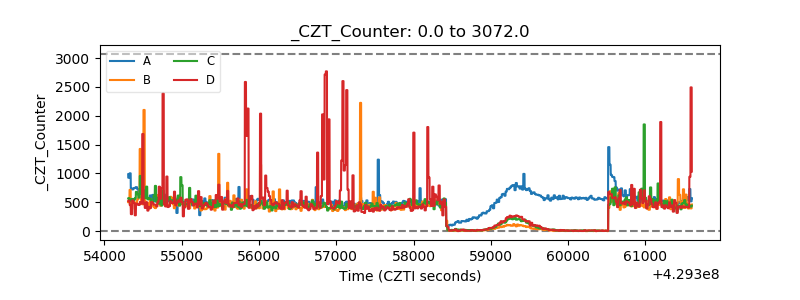 |
| +2.5 Volts monitor | 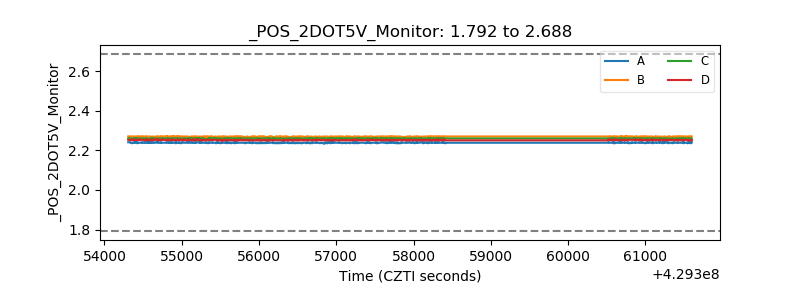 |
| +5 Volts monitor | 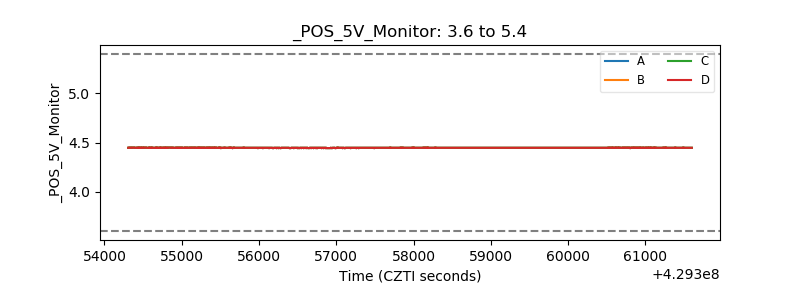 |
| _ROLL_ROT | 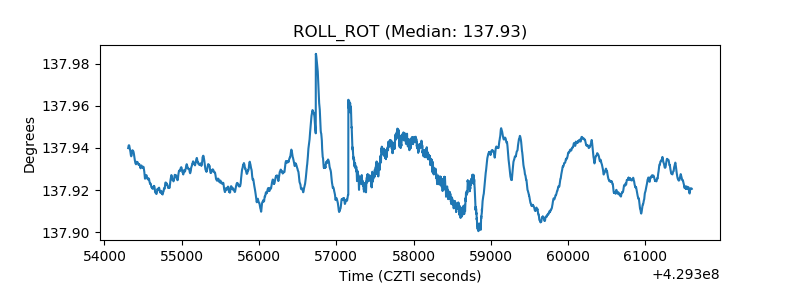 |
| _Roll_DEC | 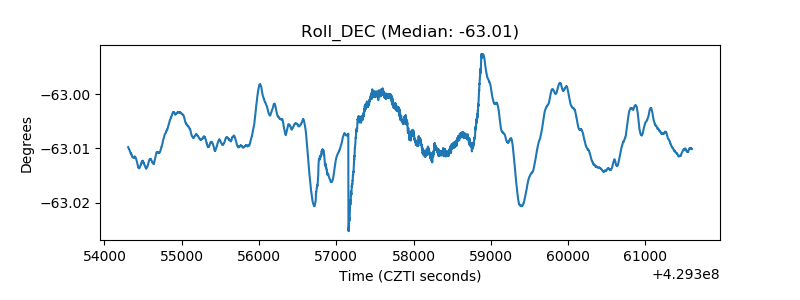 |
| _Roll_RA | 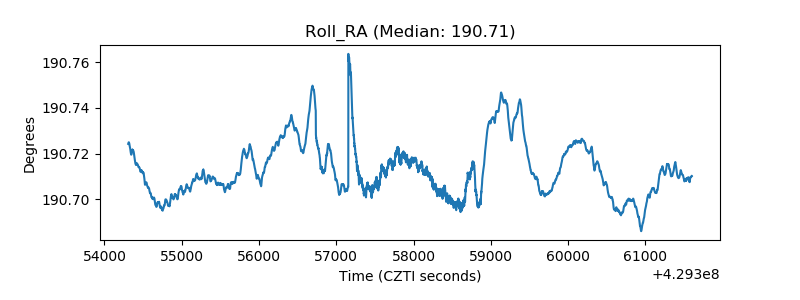 |
| Veto Counter | 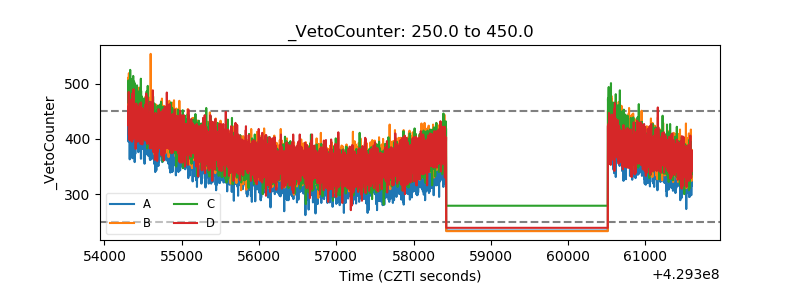 |