| Param | Original file | Final file |
|---|---|---|
| Filename | modeM0/AS1A09_002T01_9000005810_42535cztM0_level2.fits | modeM0/AS1A09_002T01_9000005810_42535cztM0_level2_quad_clean.evt |
| Size (bytes) | 304,741,440 | 89,660,160 |
| Size | 290.6 MB | 85.5 MB |
| Events in quadrant A | 2,855,676 | 600,771 |
| Events in quadrant B | 2,637,546 | 600,394 |
| Events in quadrant C | 2,624,967 | 592,365 |
| Events in quadrant D | 2,746,533 | 548,132 |
| Mode M0 | |||
|---|---|---|---|
| Quadrant | BADHDUFLAG | Total packets | Discarded packets |
| A | 0 | 11643 | 2 |
| B | 0 | 11684 | 2 |
| C | 0 | 11290 | 2 |
| D | 0 | 11954 | 2 |
| Mode M9 | |||
|---|---|---|---|
| Quadrant | BADHDUFLAG | Total packets | Discarded packets |
| A | 0 | 19 | 0 |
| B | 0 | 19 | 0 |
| C | 0 | 19 | 0 |
| D | 0 | 19 | 0 |
| Mode SS | |||
|---|---|---|---|
| Quadrant | BADHDUFLAG | Total packets | Discarded packets |
| A | 0 | 108 | 0 |
| B | 0 | 108 | 0 |
| C | 0 | 108 | 0 |
| D | 0 | 108 | 0 |
| Quadrant | Total seconds | Saturated seconds | Saturation percentage |
|---|---|---|---|
| A | 5333 | 7 | 0.131258% |
| B | 5334 | 91 | 1.706037% |
| C | 5333 | 26 | 0.487530% |
| D | 5333 | 52 | 0.975061% |
Noise dominated data is calculated using 1-second bins in cleaned event files. If a bin has >2000 counts, and if more than 50% of those come from <1% of pixels, then it is considered to be noise-dominated and hence unusable.
| Quadrant | # 1 sec bins | Bins with >0 counts | Bins with >2000 counts | High rate bins dominated by noise | Noise dominated (total time) | Noise dominated (detector-on time) | Marked lightcurve |
|---|---|---|---|---|---|---|---|
| A | 7245 | 5334 | 5 | 5 | 0.07% | 0.09% | 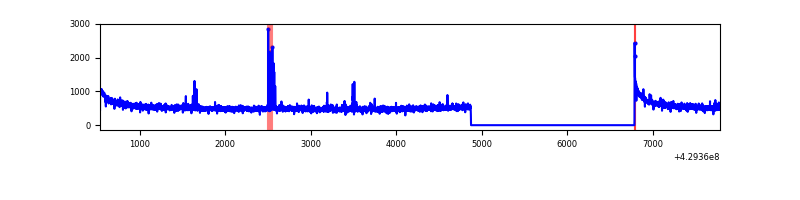 |
| B | 7246 | 5335 | 72 | 72 | 0.99% | 1.35% | 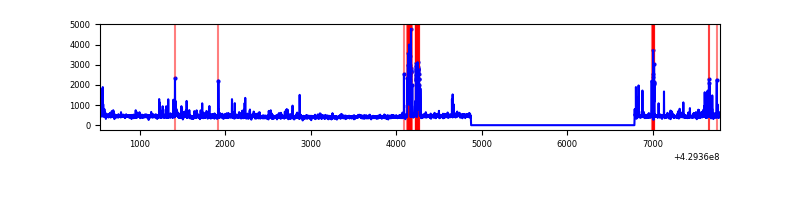 |
| C | 7245 | 5334 | 21 | 21 | 0.29% | 0.39% | 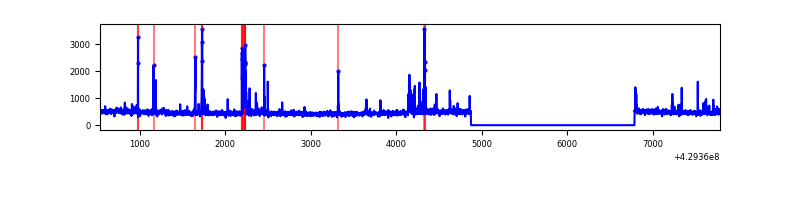 |
| D | 7245 | 5334 | 48 | 48 | 0.66% | 0.90% | 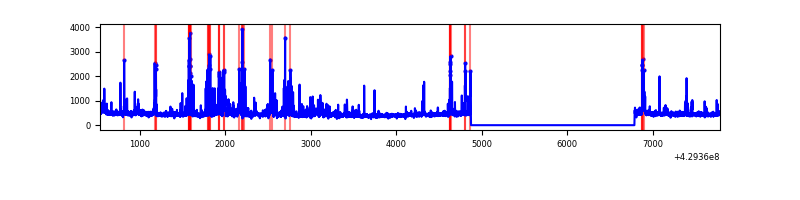 |
Top three noisy pixels from each quadrant. If the there are fewer than three noisy pixels in the level2.evt file, extra rows are filled as -1
| Pixel properties | Quadrant properties | ||||||
|---|---|---|---|---|---|---|---|
| Quadrant | DetID | PixID | Counts | Sigma | Mean | Median | Sigma |
| A | 10 | 83 | 575166 | 4910.98 | 574 | 564 | 117.0 |
| A | 2 | 79 | 39316 | 331.2 | 574 | 564 | 117.0 |
| A | 13 | 248 | 11258 | 91.4 | 574 | 564 | 117.0 |
| B | 5 | 172 | 255962 | 2391.99 | 561 | 546 | 106.8 |
| B | 0 | 245 | 105734 | 985.09 | 561 | 546 | 106.8 |
| B | 5 | 255 | 34446 | 317.48 | 561 | 546 | 106.8 |
| C | 15 | 214 | 224643 | 1756.61 | 553 | 556 | 127.6 |
| C | 5 | 250 | 153304 | 1197.39 | 553 | 556 | 127.6 |
| C | 14 | 254 | 25500 | 195.54 | 553 | 556 | 127.6 |
| D | 2 | 249 | 127388 | 927.8 | 558 | 543 | 136.7 |
| D | 12 | 233 | 108357 | 788.6 | 558 | 543 | 136.7 |
| D | 1 | 52 | 105364 | 766.71 | 558 | 543 | 136.7 |
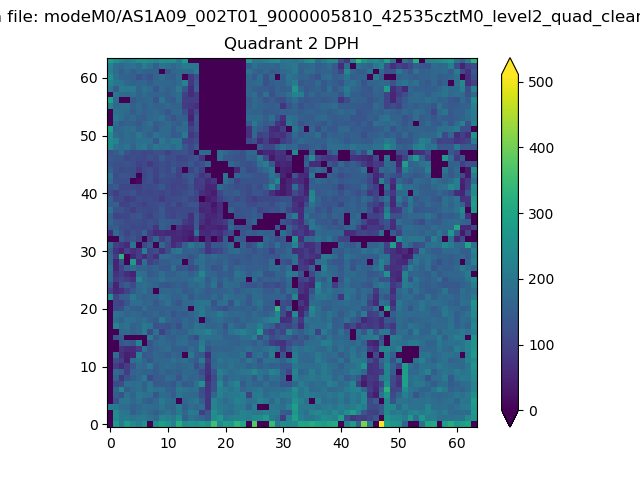
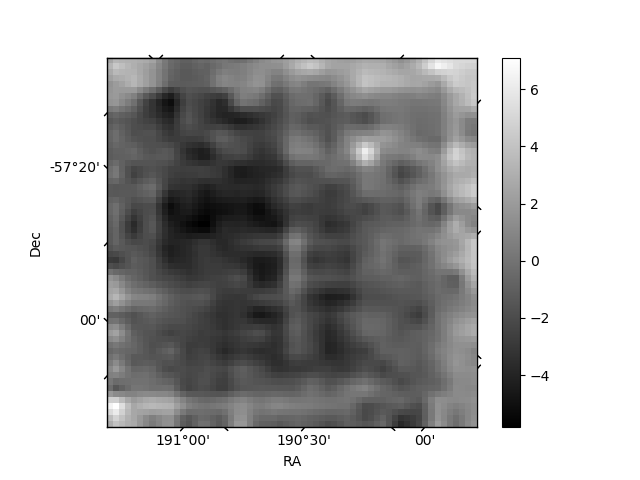
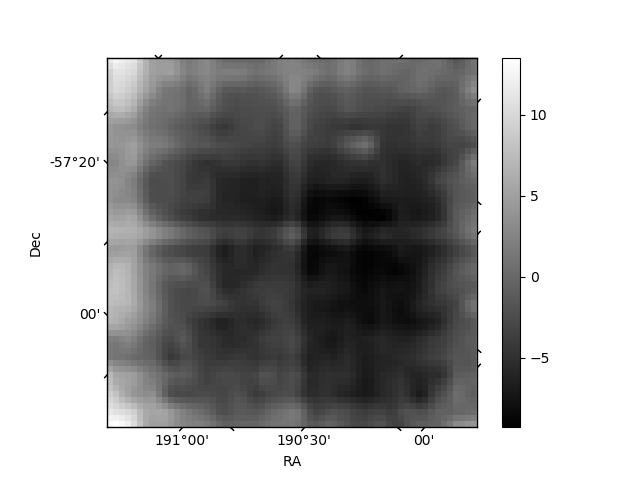
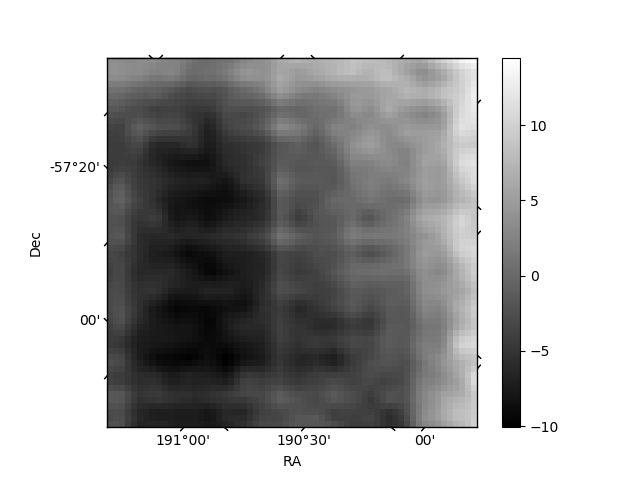
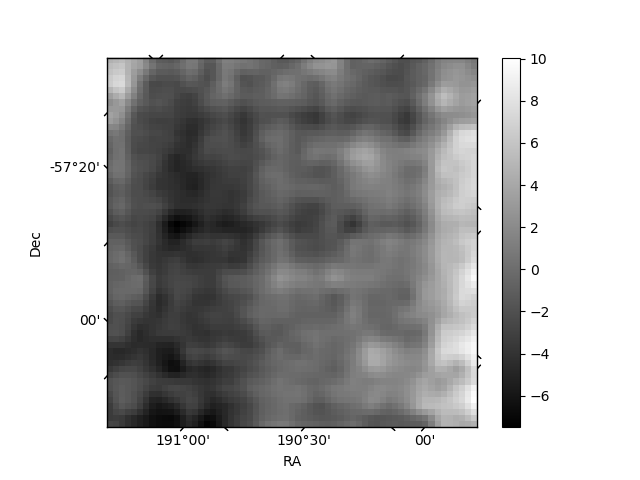
Histogram calculated using DETX and DETY for each event in the final _common_clean file
| Quadrant A |  |
 |
Quadrant B |
|---|---|---|---|
| Quadrant D | 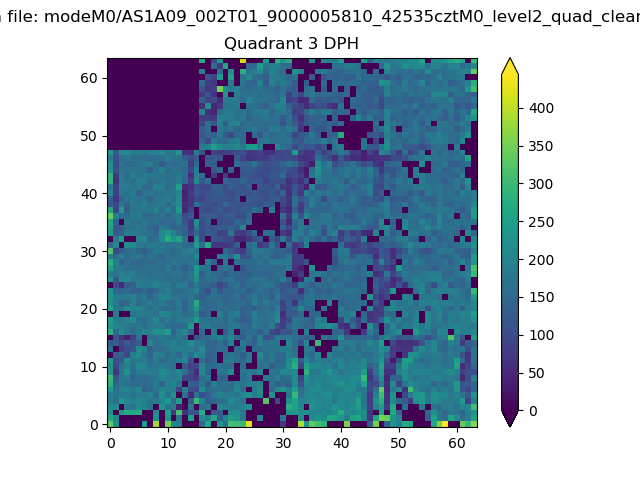 |
 |
Quadrant C |
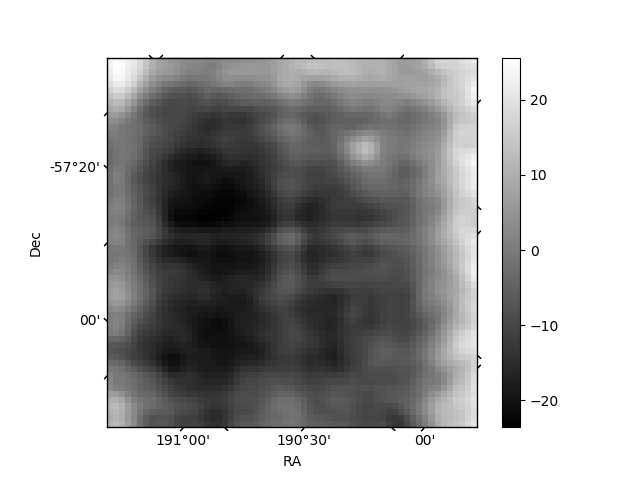
| Plot type | Count rate plots | Images |
|---|---|---|
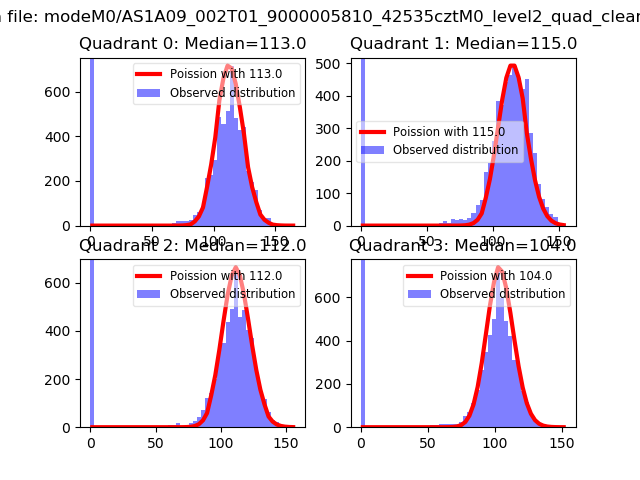
| Comparison with Poisson distribution Blue bars denote a histogram of data divided into 1 sec bins. Red curve is a Poisson curve with rate = median count rate of data. |
 |
 |
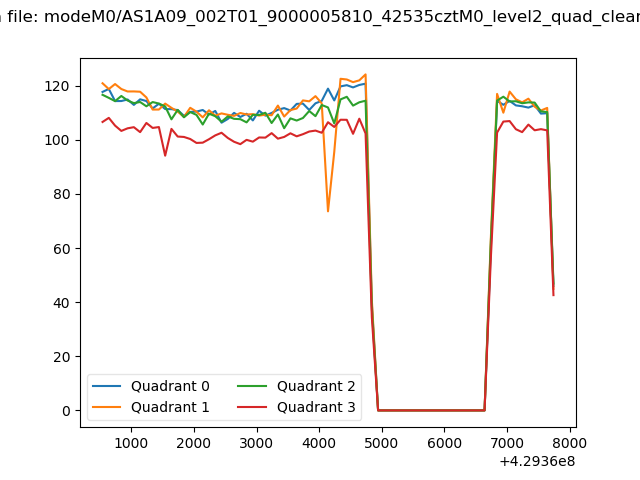
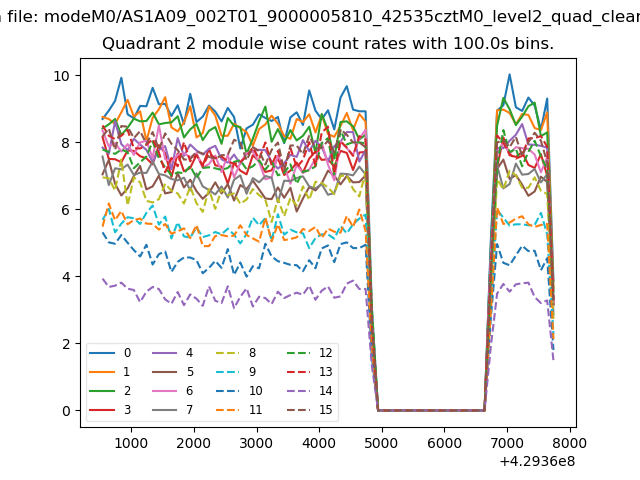
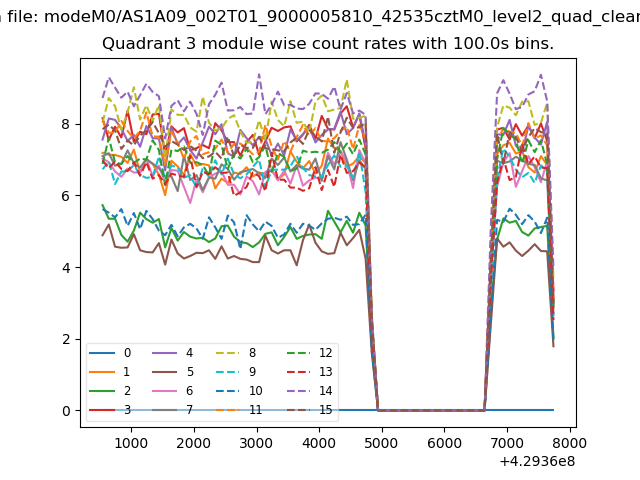
| Quadrant-wise count rates Data is divided into 100 sec bins |
 |
|
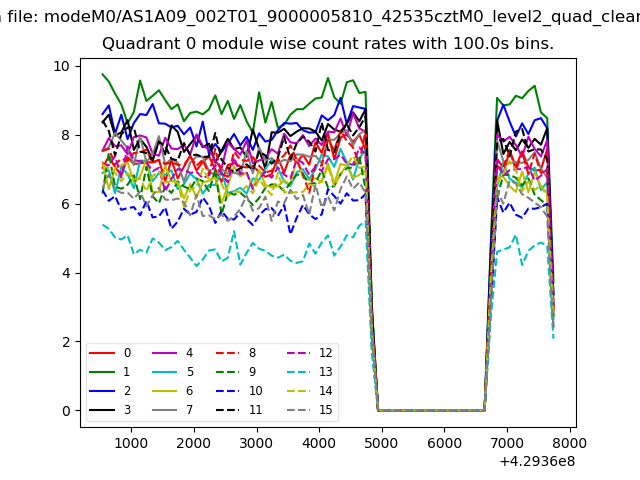
| Module-wise count rates for Quadrant A Data is divided into 100 sec bins |
 |
 |
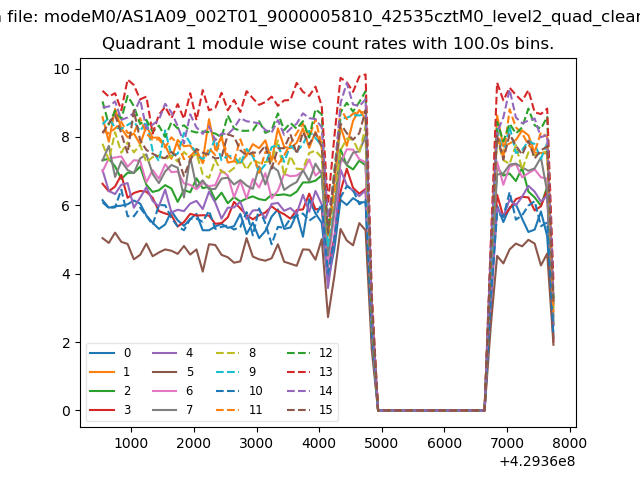
| Module-wise count rates for Quadrant B Data is divided into 100 sec bins |
 |
 |
| Module-wise count rates for Quadrant C Data is divided into 100 sec bins |
 |
 |
| Module-wise count rates for Quadrant D Data is divided into 100 sec bins |
 |
 |
| Parameter | Plot |
|---|---|
| CZT HV Monitor | 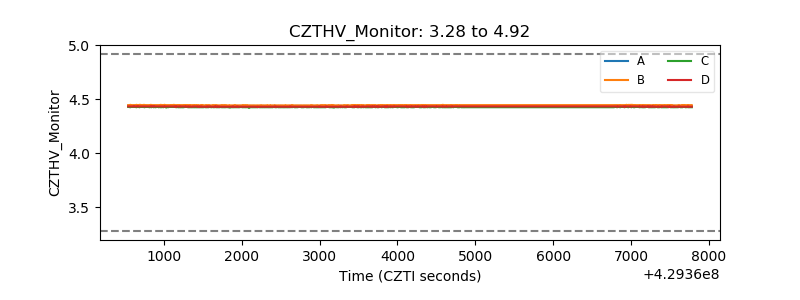 |
| D_VDD | 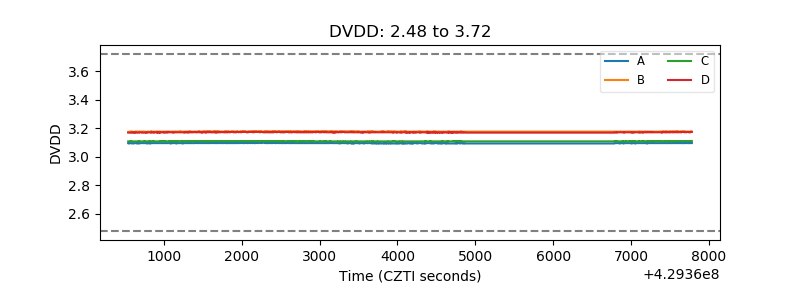 |
| Temperature 1 | 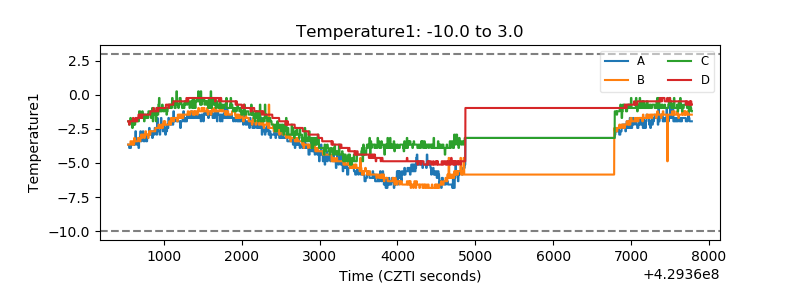 |
| Veto HV Monitor | 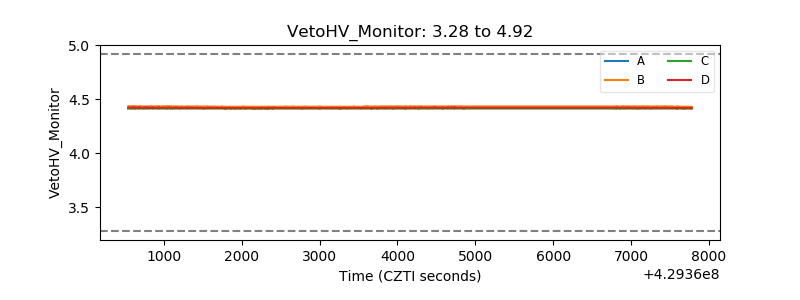 |
| Veto LLD | 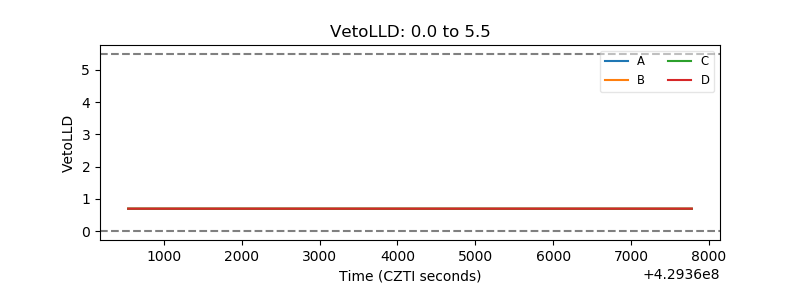 |
| Alpha Counter | 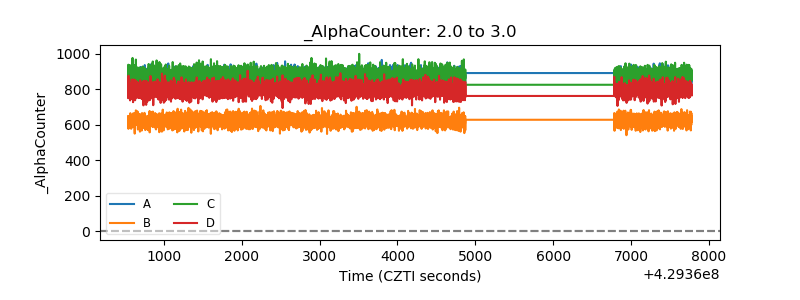 |
| _CPM_Rate | 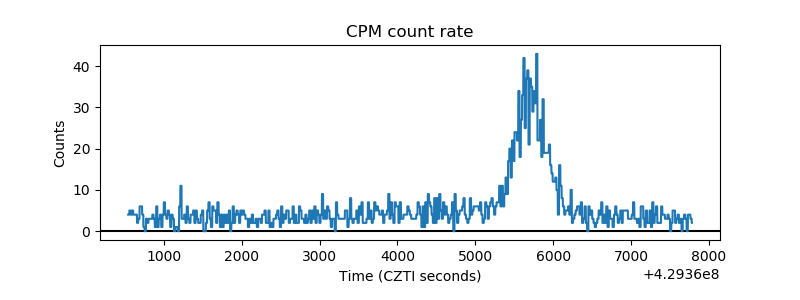 |
| CZT Counter | 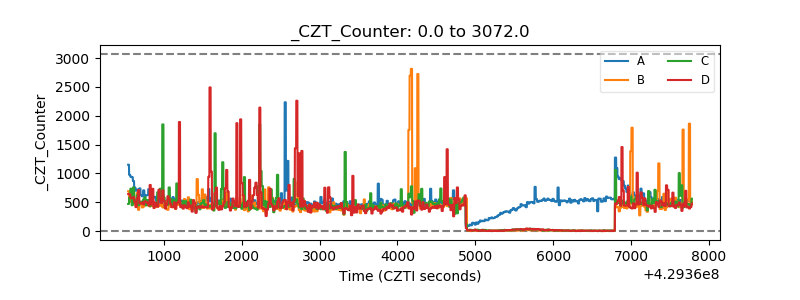 |
| +2.5 Volts monitor | 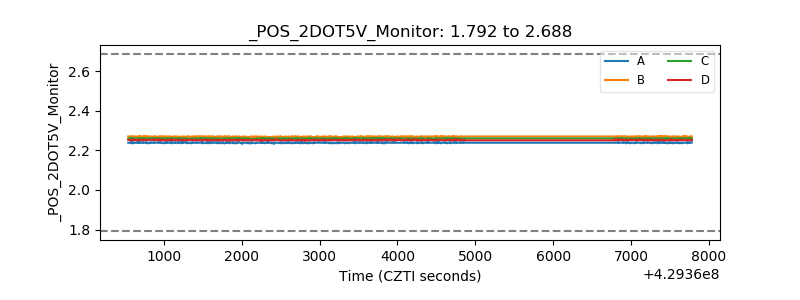 |
| +5 Volts monitor | 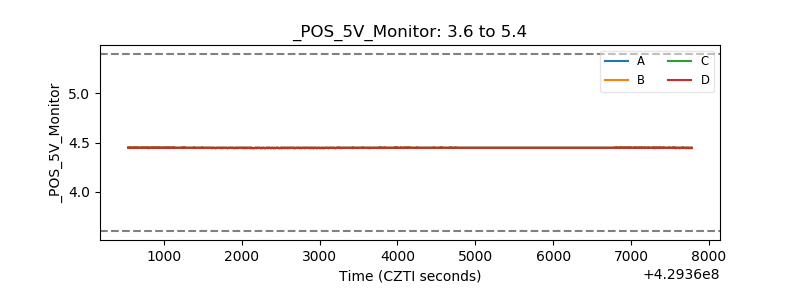 |
| _ROLL_ROT | 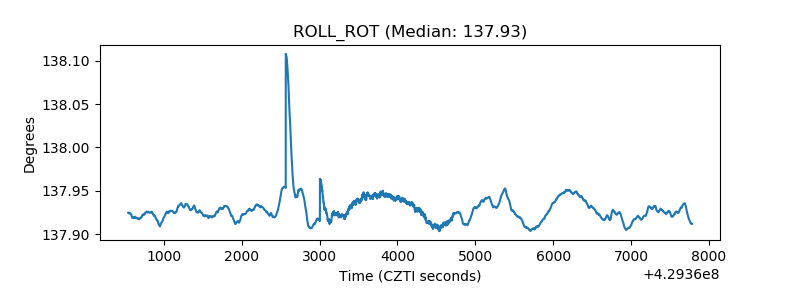 |
| _Roll_DEC |  |
| _Roll_RA | 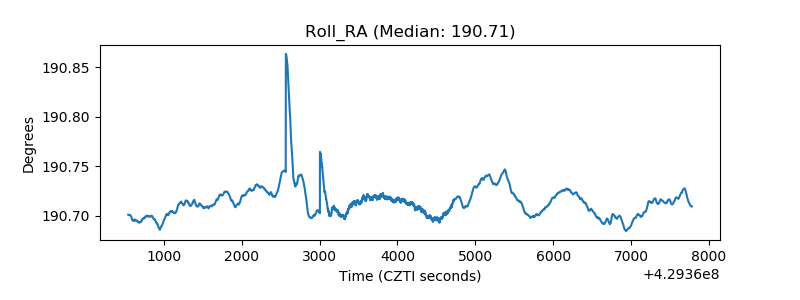 |
| Veto Counter | 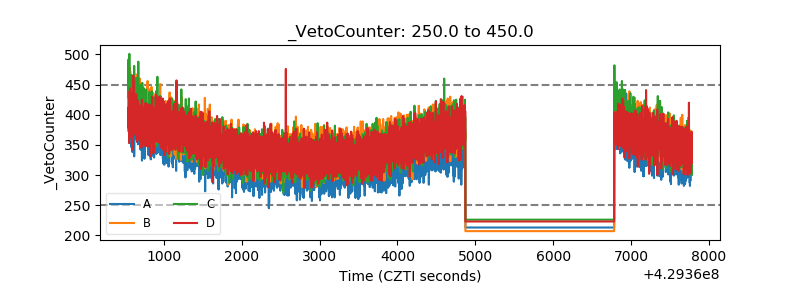 |