| Param | Original file | Final file |
|---|---|---|
| Filename | modeM0/AS1A09_002T01_9000005810_42536cztM0_level2.fits | modeM0/AS1A09_002T01_9000005810_42536cztM0_level2_quad_clean.evt |
| Size (bytes) | 327,519,360 | 93,280,320 |
| Size | 312.3 MB | 89.0 MB |
| Events in quadrant A | 3,006,927 | 629,478 |
| Events in quadrant B | 3,145,165 | 618,731 |
| Events in quadrant C | 2,710,006 | 616,636 |
| Events in quadrant D | 2,824,920 | 567,631 |
| Mode M0 | |||
|---|---|---|---|
| Quadrant | BADHDUFLAG | Total packets | Discarded packets |
| A | 0 | 12312 | 2 |
| B | 0 | 13389 | 2 |
| C | 0 | 11683 | 2 |
| D | 0 | 12457 | 2 |
| Mode M9 | |||
|---|---|---|---|
| Quadrant | BADHDUFLAG | Total packets | Discarded packets |
| A | 0 | 16 | 0 |
| B | 0 | 16 | 0 |
| C | 0 | 17 | 0 |
| D | 0 | 17 | 0 |
| Mode SS | |||
|---|---|---|---|
| Quadrant | BADHDUFLAG | Total packets | Discarded packets |
| A | 0 | 114 | 0 |
| B | 0 | 114 | 0 |
| C | 0 | 114 | 0 |
| D | 0 | 114 | 0 |
| Quadrant | Total seconds | Saturated seconds | Saturation percentage |
|---|---|---|---|
| A | 5604 | 12 | 0.214133% |
| B | 5604 | 208 | 3.711635% |
| C | 5604 | 14 | 0.249822% |
| D | 5604 | 60 | 1.070664% |
Noise dominated data is calculated using 1-second bins in cleaned event files. If a bin has >2000 counts, and if more than 50% of those come from <1% of pixels, then it is considered to be noise-dominated and hence unusable.
| Quadrant | # 1 sec bins | Bins with >0 counts | Bins with >2000 counts | High rate bins dominated by noise | Noise dominated (total time) | Noise dominated (detector-on time) | Marked lightcurve |
|---|---|---|---|---|---|---|---|
| A | 7188 | 5605 | 11 | 11 | 0.15% | 0.20% | 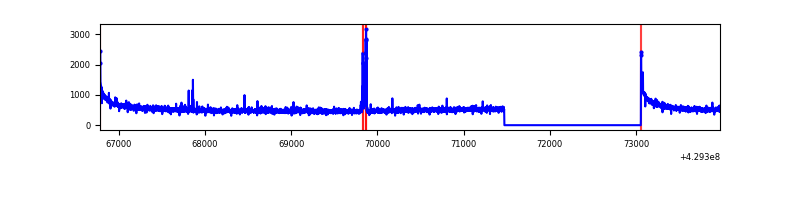 |
| B | 7188 | 5605 | 150 | 150 | 2.09% | 2.68% | 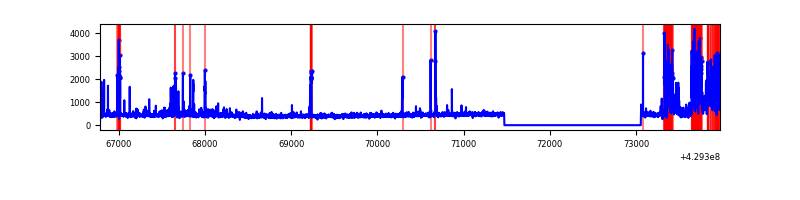 |
| C | 7188 | 5605 | 9 | 9 | 0.13% | 0.16% | 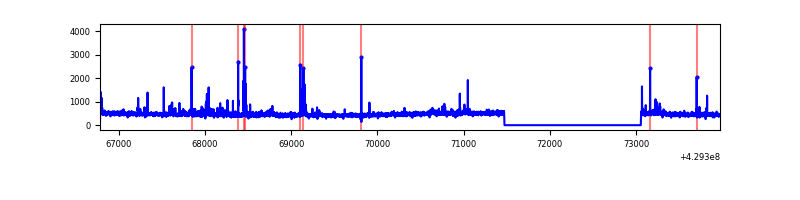 |
| D | 7188 | 5605 | 50 | 50 | 0.70% | 0.89% | 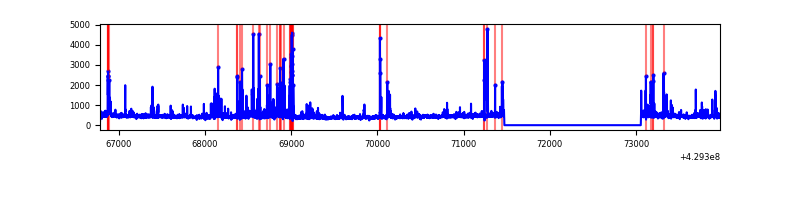 |
Top three noisy pixels from each quadrant. If the there are fewer than three noisy pixels in the level2.evt file, extra rows are filled as -1
| Pixel properties | Quadrant properties | ||||||
|---|---|---|---|---|---|---|---|
| Quadrant | DetID | PixID | Counts | Sigma | Mean | Median | Sigma |
| A | 10 | 83 | 603975 | 4871.26 | 603 | 592 | 123.9 |
| A | 13 | 248 | 51688 | 412.51 | 603 | 592 | 123.9 |
| A | 2 | 79 | 18920 | 147.97 | 603 | 592 | 123.9 |
| B | 5 | 172 | 558643 | 4874.44 | 590 | 576 | 114.5 |
| B | 0 | 245 | 183897 | 1601.22 | 590 | 576 | 114.5 |
| B | 5 | 255 | 48341 | 417.2 | 590 | 576 | 114.5 |
| C | 15 | 214 | 234236 | 1732.91 | 582 | 586 | 134.8 |
| C | 14 | 254 | 162742 | 1202.66 | 582 | 586 | 134.8 |
| C | 5 | 250 | 24609 | 178.17 | 582 | 586 | 134.8 |
| D | 12 | 233 | 240023 | 1644.37 | 584 | 569 | 145.6 |
| D | 1 | 52 | 108336 | 740.05 | 584 | 569 | 145.6 |
| D | 1 | 47 | 49767 | 337.85 | 584 | 569 | 145.6 |
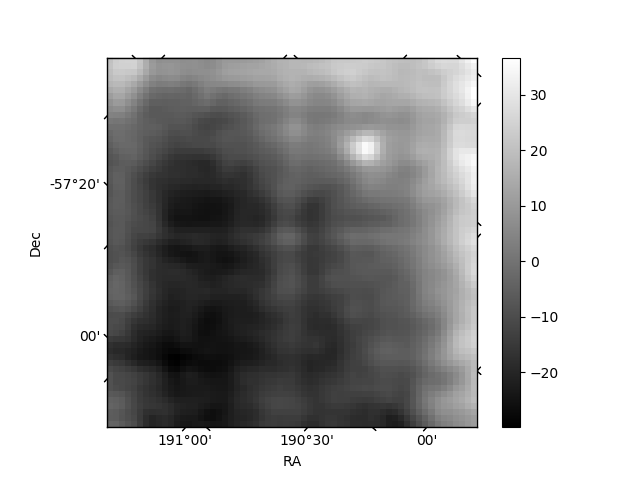
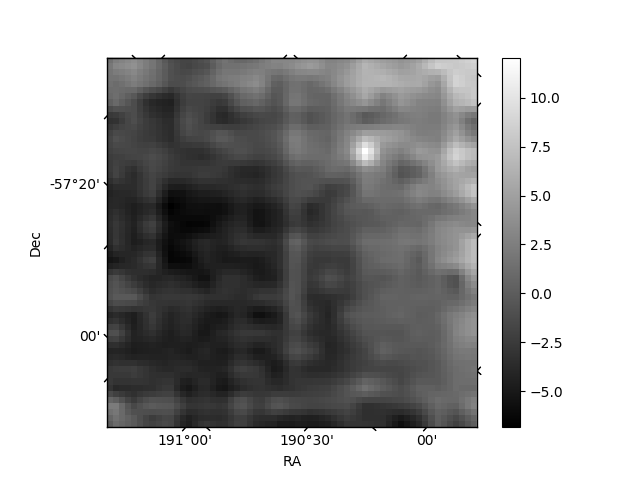
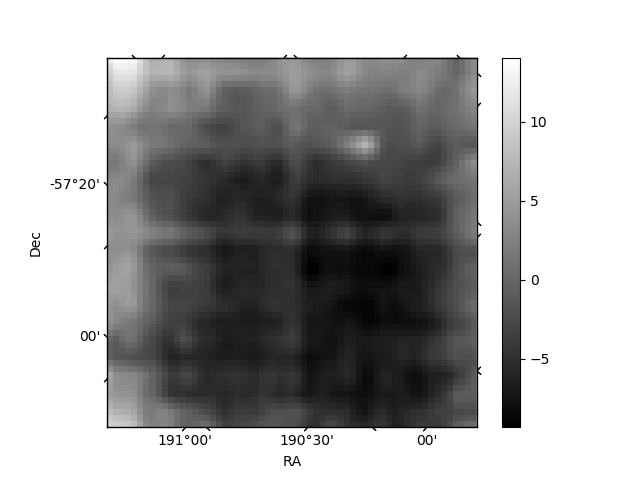
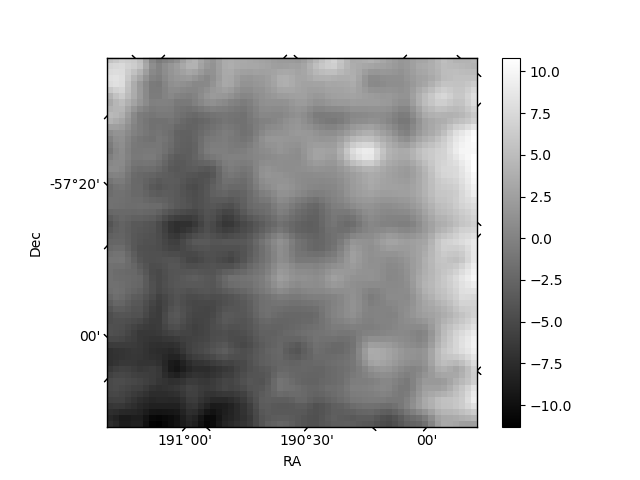
Histogram calculated using DETX and DETY for each event in the final _common_clean file
| Quadrant A | 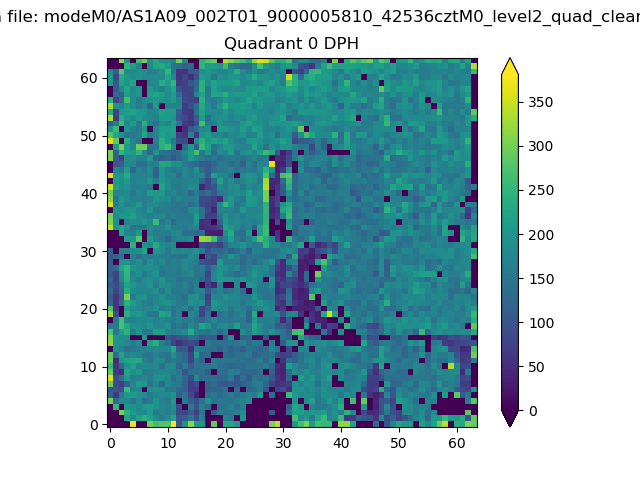 |
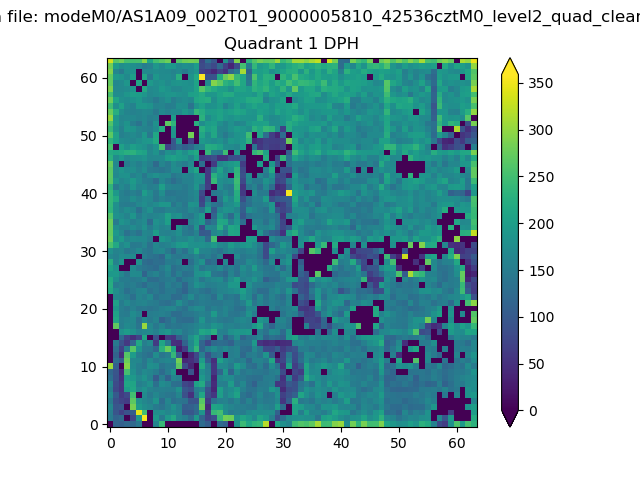 |
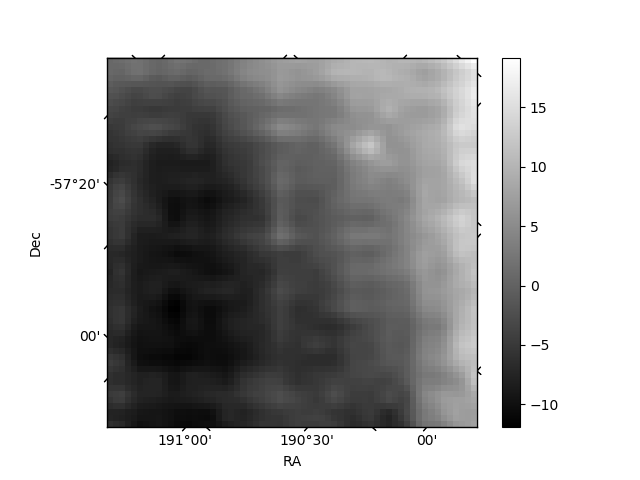
Quadrant B |
|---|---|---|---|
| Quadrant D |  |
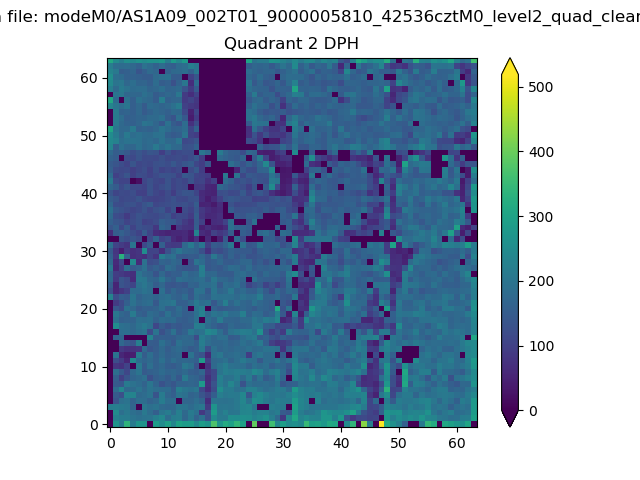 |
Quadrant C |
| Plot type | Count rate plots | Images |
|---|---|---|
| Comparison with Poisson distribution Blue bars denote a histogram of data divided into 1 sec bins. Red curve is a Poisson curve with rate = median count rate of data. |
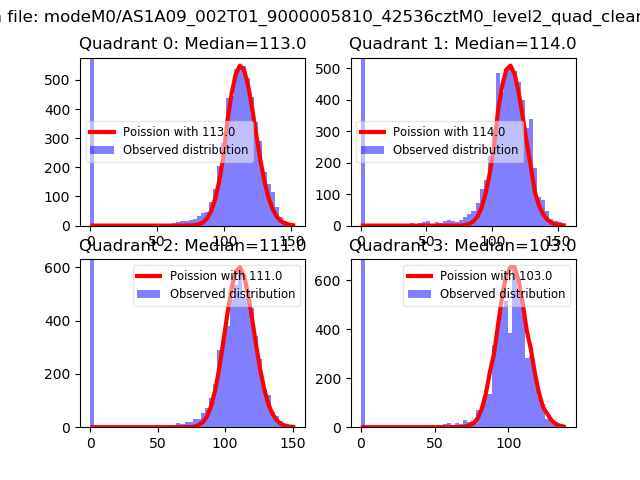 |
 |
| Quadrant-wise count rates Data is divided into 100 sec bins |
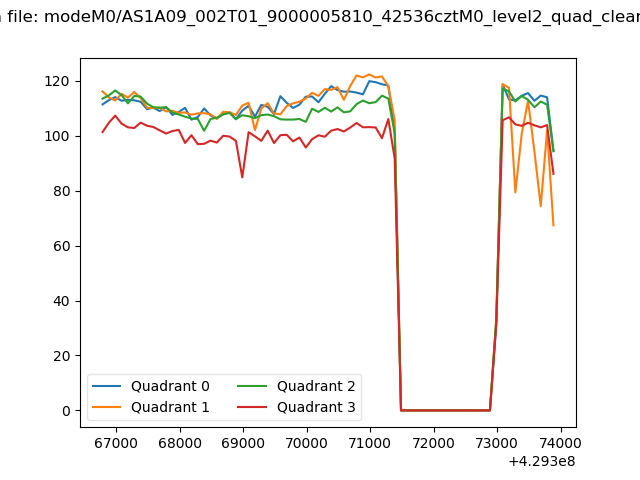 |
|
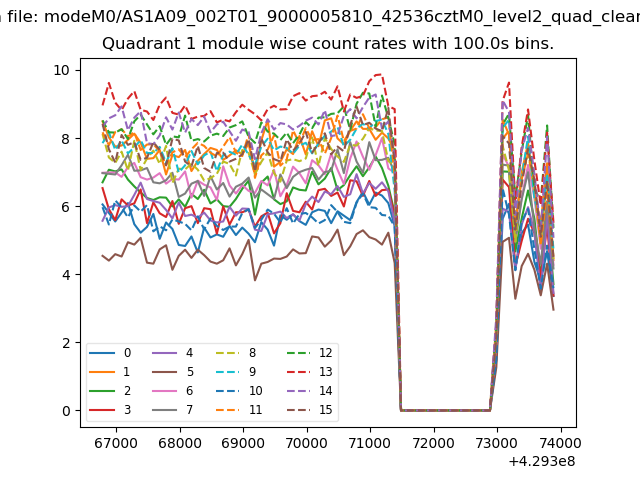
| Module-wise count rates for Quadrant A Data is divided into 100 sec bins |
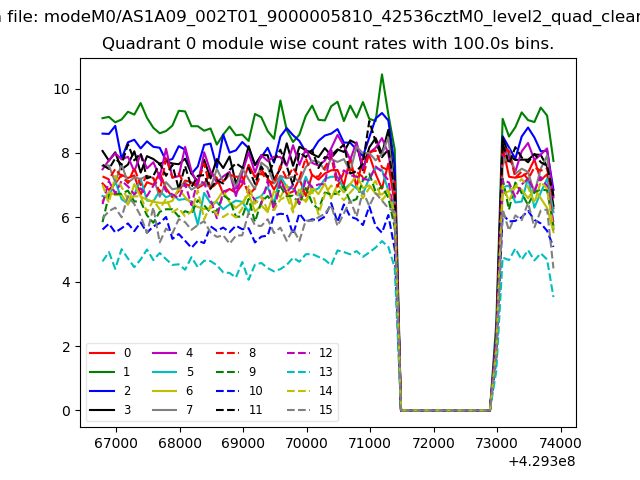 |
 |
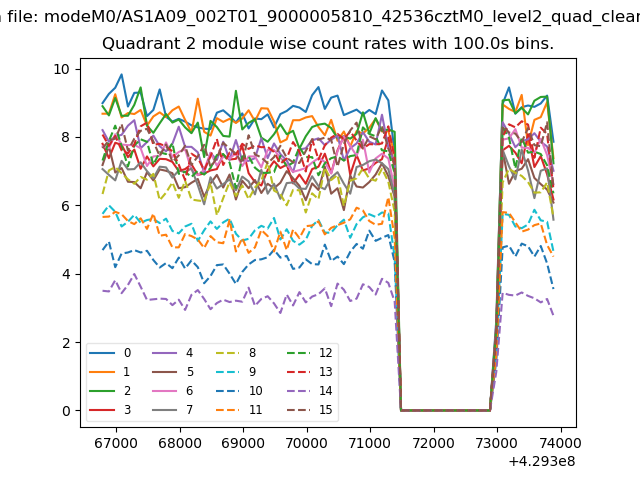
| Module-wise count rates for Quadrant B Data is divided into 100 sec bins |
 |
 |
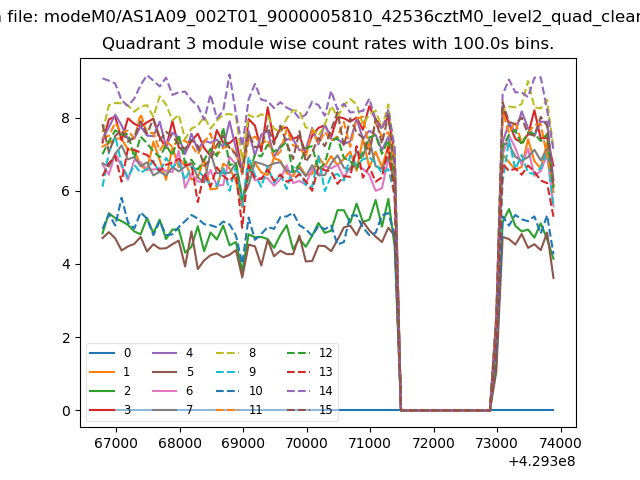
| Module-wise count rates for Quadrant C Data is divided into 100 sec bins |
 |
 |
| Module-wise count rates for Quadrant D Data is divided into 100 sec bins |
 |
 |
| Parameter | Plot |
|---|---|
| CZT HV Monitor | 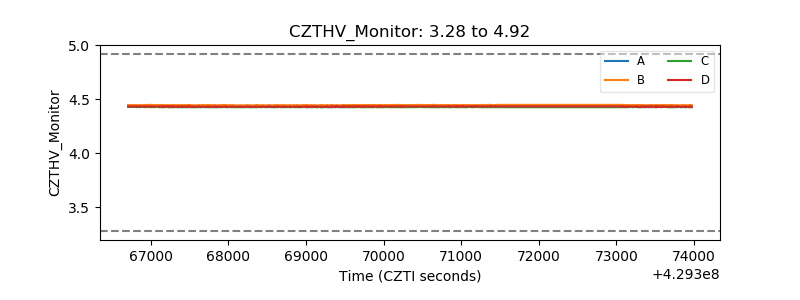 |
| D_VDD | 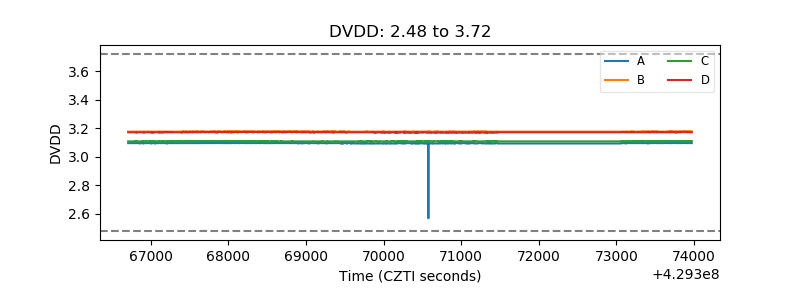 |
| Temperature 1 | 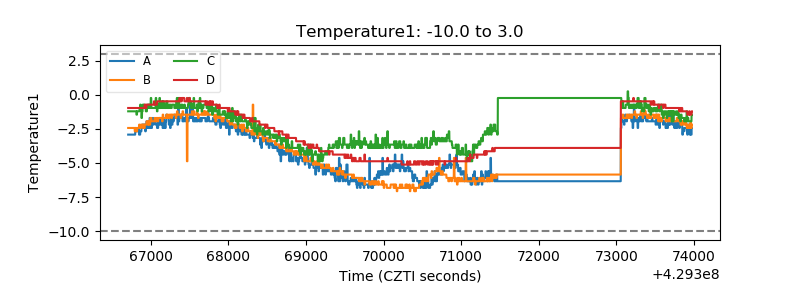 |
| Veto HV Monitor |  |
| Veto LLD | 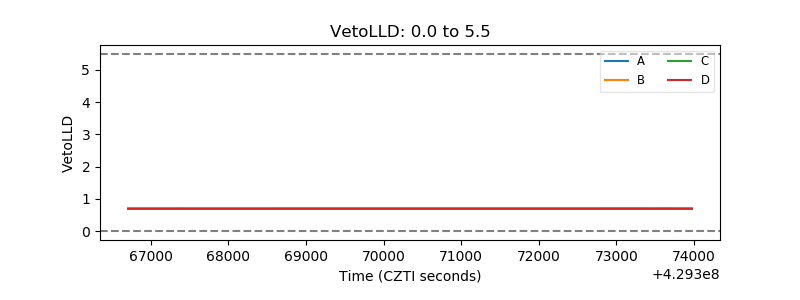 |
| Alpha Counter | 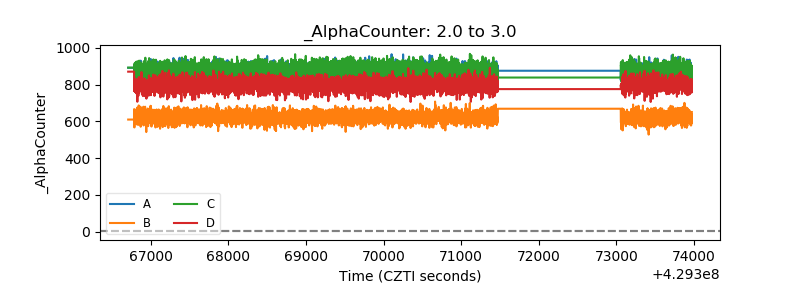 |
| _CPM_Rate | 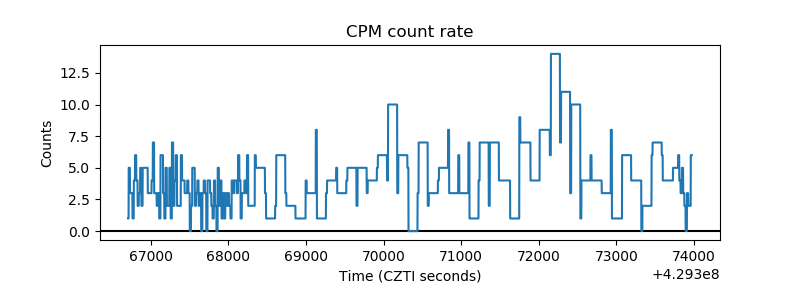 |
| CZT Counter | 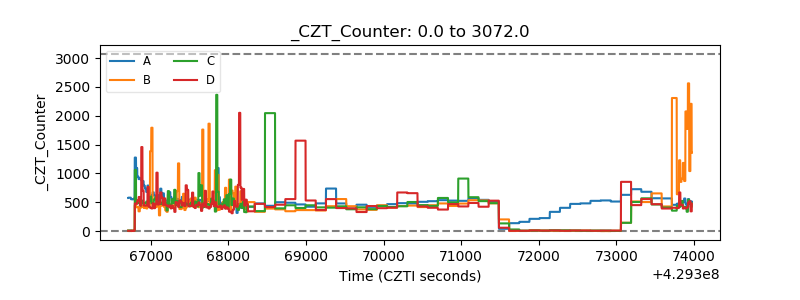 |
| +2.5 Volts monitor | 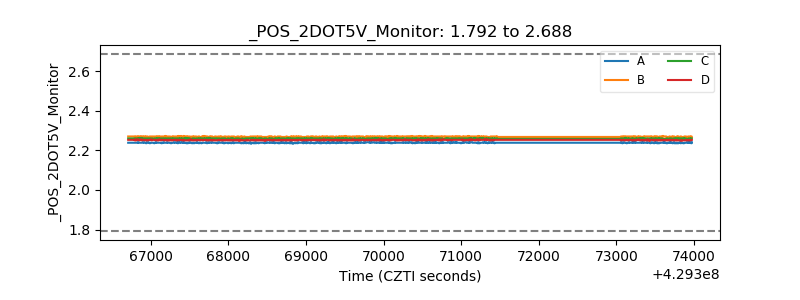 |
| +5 Volts monitor | 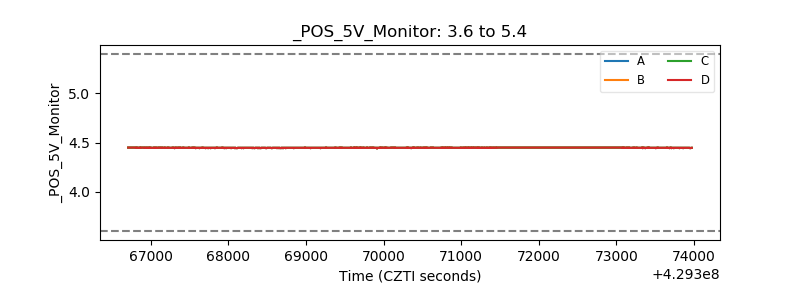 |
| _ROLL_ROT |  |
| _Roll_DEC | 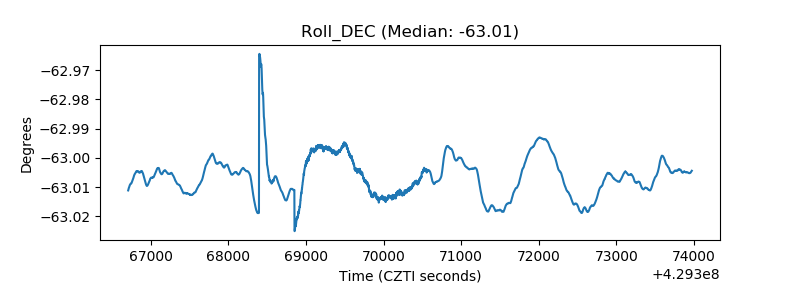 |
| _Roll_RA | 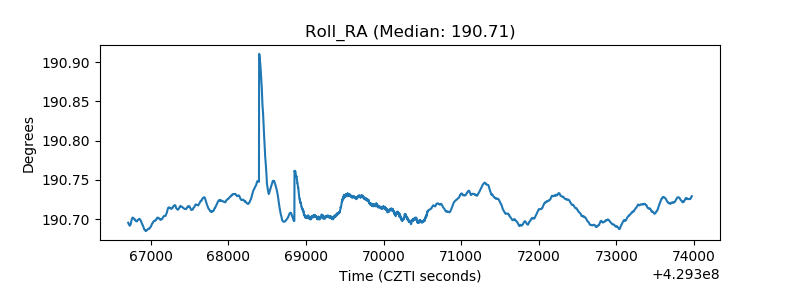 |
| Veto Counter | 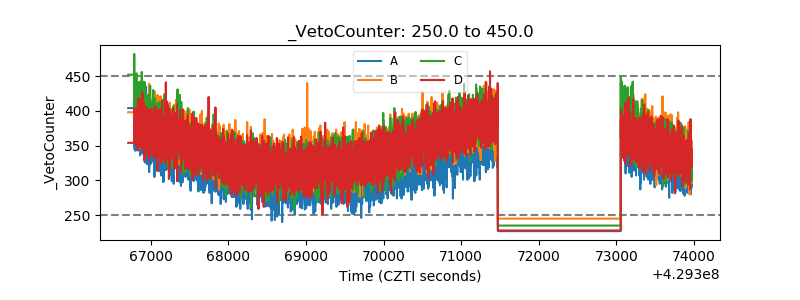 |