| Param | Original file | Final file |
|---|---|---|
| Filename | modeM0/AS1A09_002T01_9000005810_42537cztM0_level2.fits | modeM0/AS1A09_002T01_9000005810_42537cztM0_level2_quad_clean.evt |
| Size (bytes) | 401,837,760 | 93,689,280 |
| Size | 383.2 MB | 89.3 MB |
| Events in quadrant A | 3,080,682 | 649,560 |
| Events in quadrant B | 3,340,800 | 636,092 |
| Events in quadrant C | 5,106,700 | 564,969 |
| Events in quadrant D | 2,897,521 | 582,644 |
| Mode M0 | |||
|---|---|---|---|
| Quadrant | BADHDUFLAG | Total packets | Discarded packets |
| A | 0 | 12568 | 2 |
| B | 0 | 14070 | 2 |
| C | 0 | 19054 | 2 |
| D | 0 | 12690 | 2 |
| Mode M9 | |||
|---|---|---|---|
| Quadrant | BADHDUFLAG | Total packets | Discarded packets |
| A | 0 | 15 | 0 |
| B | 0 | 16 | 0 |
| C | 0 | 16 | 0 |
| D | 0 | 16 | 0 |
| Mode SS | |||
|---|---|---|---|
| Quadrant | BADHDUFLAG | Total packets | Discarded packets |
| A | 0 | 118 | 0 |
| B | 0 | 118 | 0 |
| C | 0 | 118 | 0 |
| D | 0 | 118 | 0 |
| Quadrant | Total seconds | Saturated seconds | Saturation percentage |
|---|---|---|---|
| A | 5767 | 17 | 0.294781% |
| B | 5767 | 216 | 3.745448% |
| C | 5767 | 833 | 14.444252% |
| D | 5767 | 23 | 0.398821% |
Noise dominated data is calculated using 1-second bins in cleaned event files. If a bin has >2000 counts, and if more than 50% of those come from <1% of pixels, then it is considered to be noise-dominated and hence unusable.
| Quadrant | # 1 sec bins | Bins with >0 counts | Bins with >2000 counts | High rate bins dominated by noise | Noise dominated (total time) | Noise dominated (detector-on time) | Marked lightcurve |
|---|---|---|---|---|---|---|---|
| A | 7109 | 5768 | 9 | 9 | 0.13% | 0.16% | 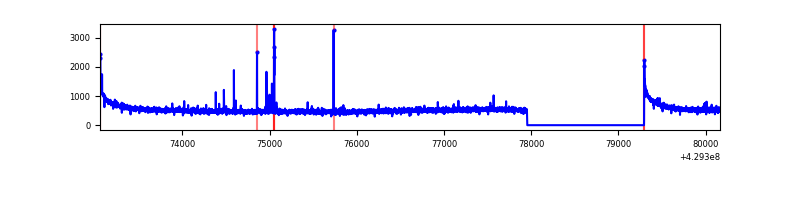 |
| B | 7109 | 5768 | 149 | 149 | 2.10% | 2.58% | 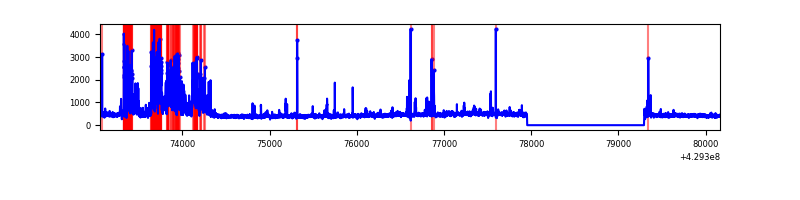 |
| C | 7109 | 5768 | 676 | 676 | 9.51% | 11.72% | 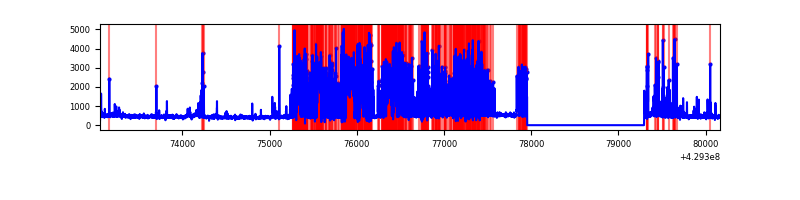 |
| D | 7109 | 5768 | 28 | 28 | 0.39% | 0.49% | 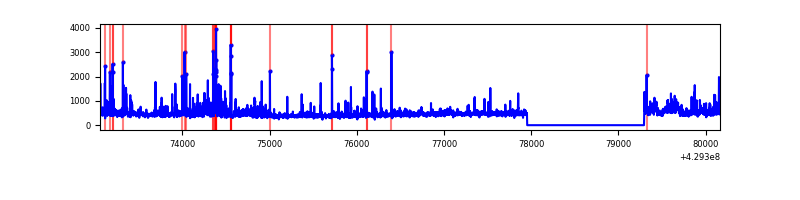 |
Top three noisy pixels from each quadrant. If the there are fewer than three noisy pixels in the level2.evt file, extra rows are filled as -1
| Pixel properties | Quadrant properties | ||||||
|---|---|---|---|---|---|---|---|
| Quadrant | DetID | PixID | Counts | Sigma | Mean | Median | Sigma |
| A | 10 | 83 | 608696 | 4741.19 | 621 | 609 | 128.3 |
| A | 13 | 248 | 32848 | 251.36 | 621 | 609 | 128.3 |
| A | 2 | 79 | 26139 | 199.05 | 621 | 609 | 128.3 |
| B | 5 | 172 | 667188 | 5666.09 | 610 | 594 | 117.6 |
| B | 0 | 245 | 215244 | 1824.53 | 610 | 594 | 117.6 |
| B | 5 | 255 | 56641 | 476.4 | 610 | 594 | 117.6 |
| C | 5 | 250 | 2094832 | 15634.74 | 573 | 581 | 133.9 |
| C | 5 | 233 | 464499 | 3463.41 | 573 | 581 | 133.9 |
| C | 15 | 214 | 229033 | 1705.52 | 573 | 581 | 133.9 |
| D | 1 | 52 | 149083 | 988.32 | 605 | 589 | 150.2 |
| D | 12 | 233 | 103320 | 683.74 | 605 | 589 | 150.2 |
| D | 2 | 16 | 94790 | 626.96 | 605 | 589 | 150.2 |
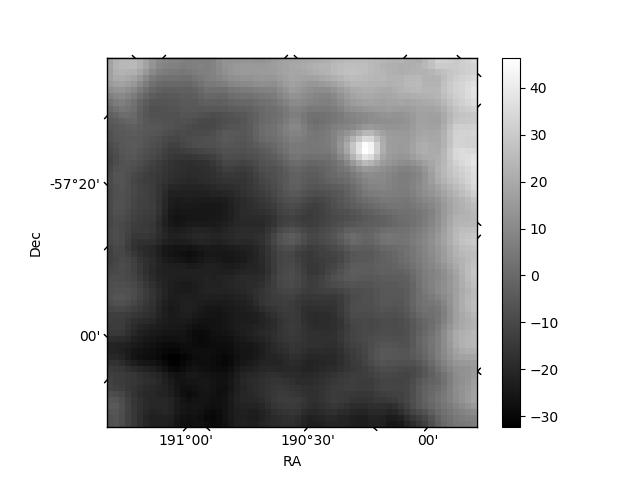
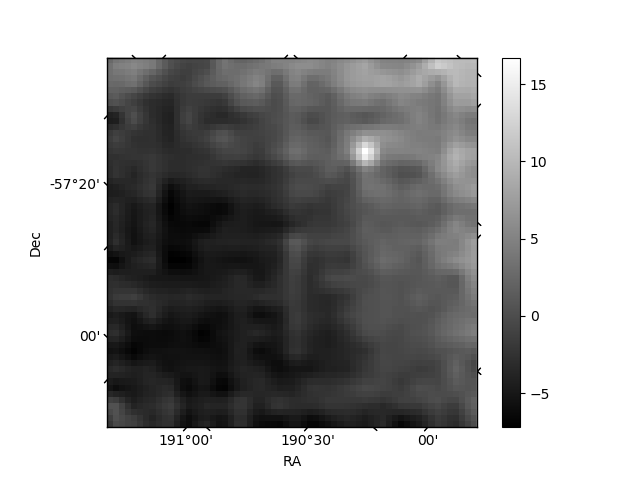
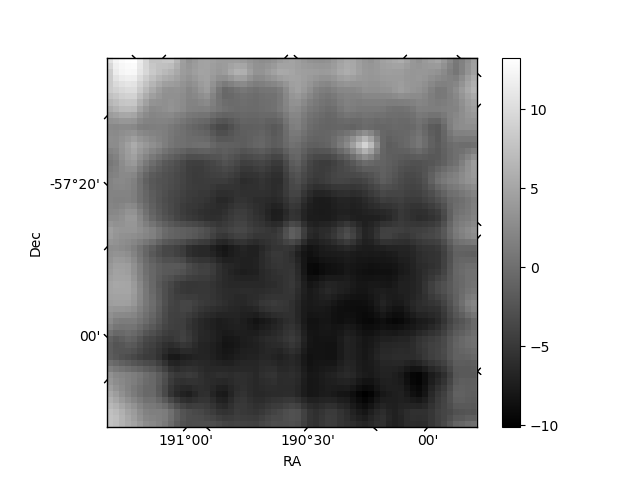
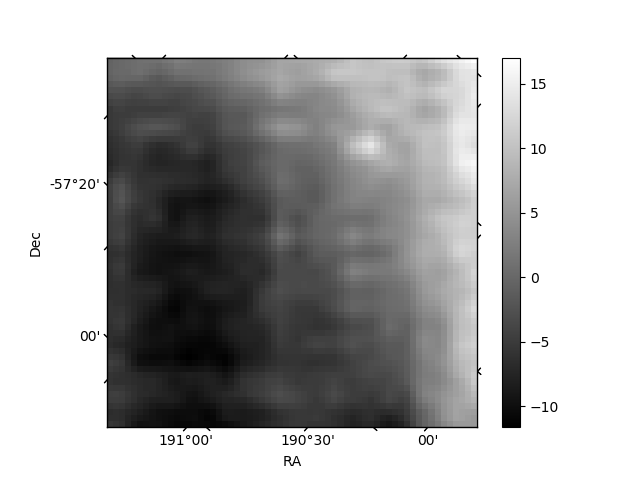
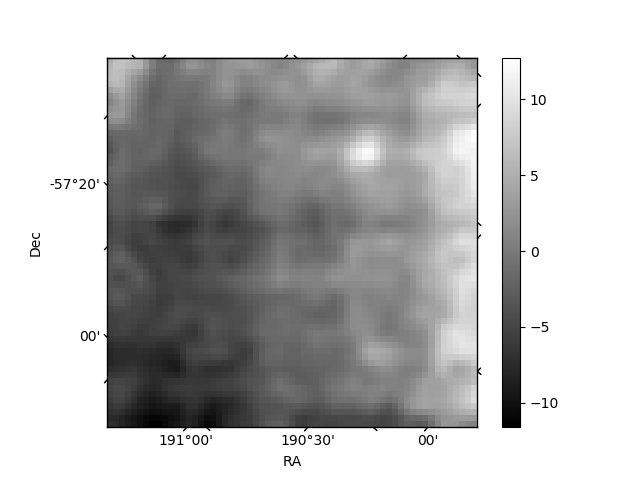
Histogram calculated using DETX and DETY for each event in the final _common_clean file
| Quadrant A | 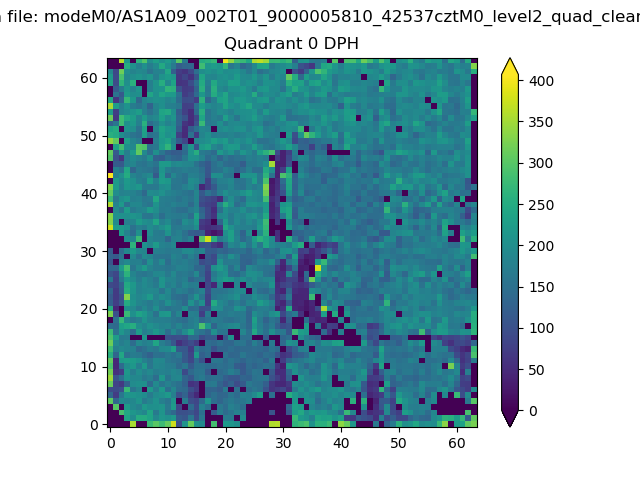 |
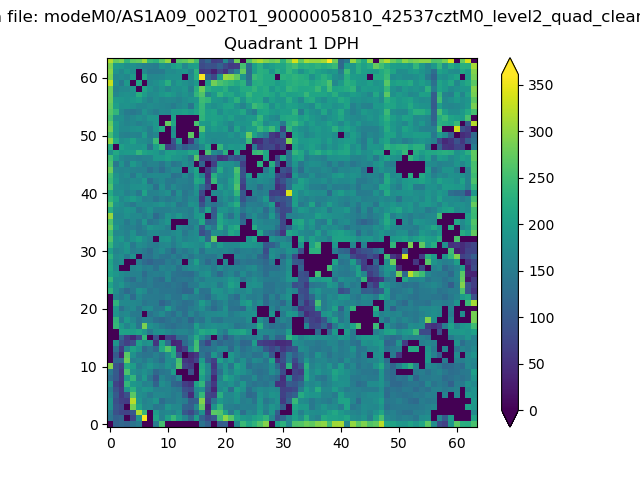 |
Quadrant B |
|---|---|---|---|
| Quadrant D | 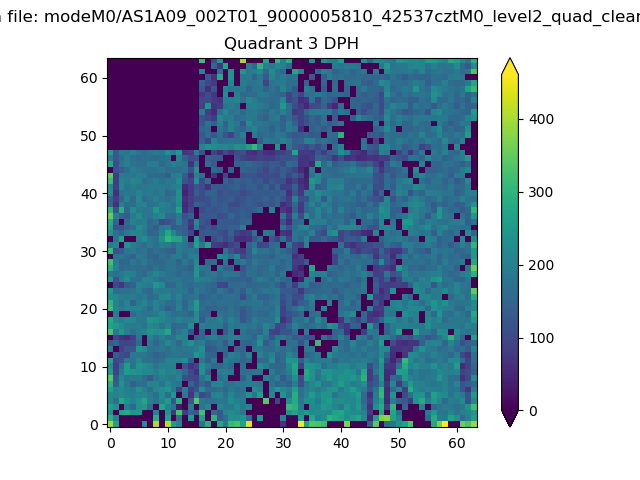 |
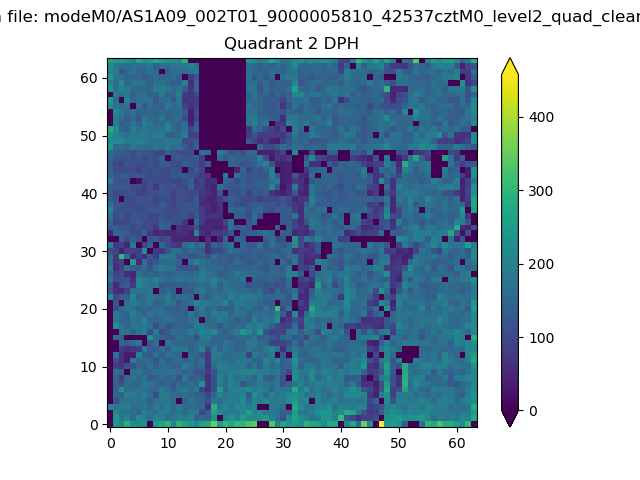 |
Quadrant C |
| Plot type | Count rate plots | Images |
|---|---|---|
| Comparison with Poisson distribution Blue bars denote a histogram of data divided into 1 sec bins. Red curve is a Poisson curve with rate = median count rate of data. |
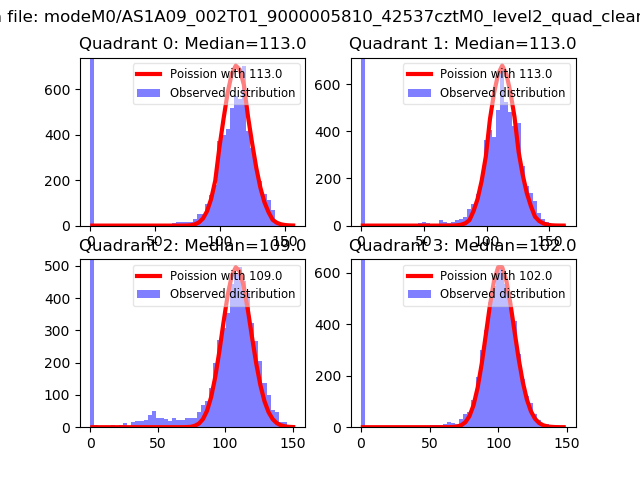 |
 |
| Quadrant-wise count rates Data is divided into 100 sec bins |
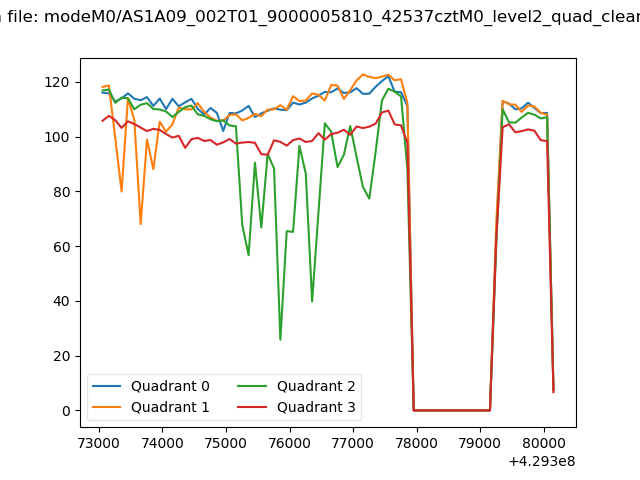 |
|
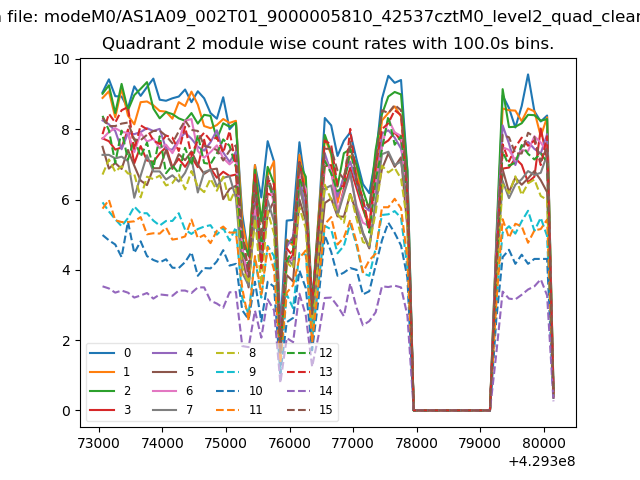
| Module-wise count rates for Quadrant A Data is divided into 100 sec bins |
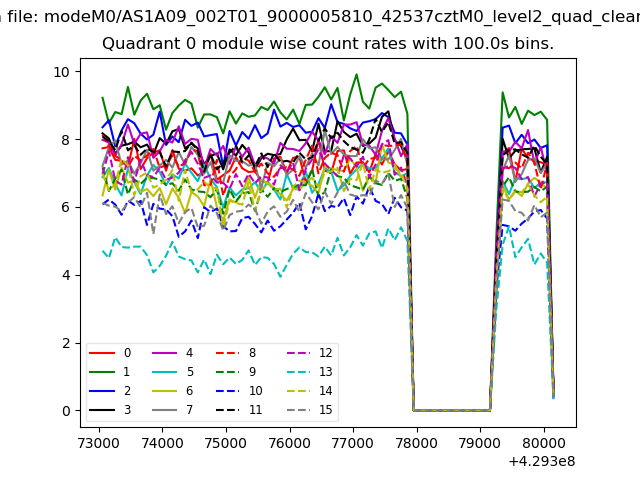 |
 |
| Module-wise count rates for Quadrant B Data is divided into 100 sec bins |
 |
 |
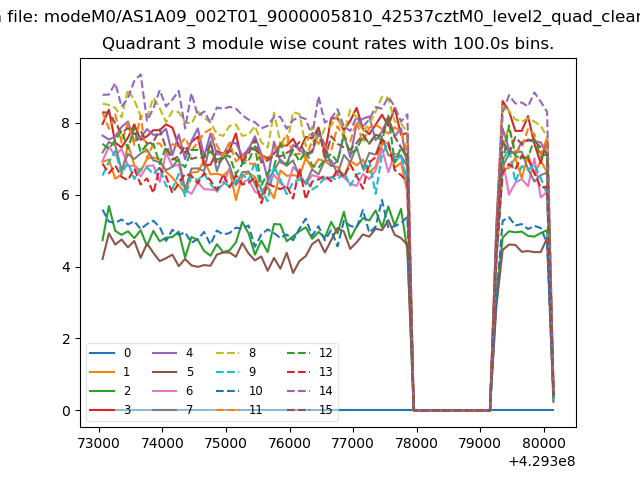
| Module-wise count rates for Quadrant C Data is divided into 100 sec bins |
 |
 |
| Module-wise count rates for Quadrant D Data is divided into 100 sec bins |
 |
 |
| Parameter | Plot |
|---|---|
| CZT HV Monitor |  |
| D_VDD | 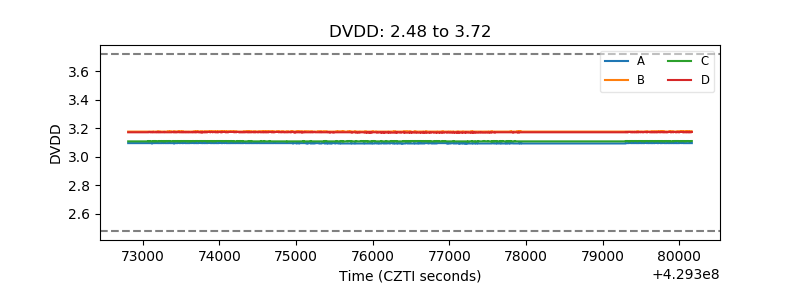 |
| Temperature 1 | 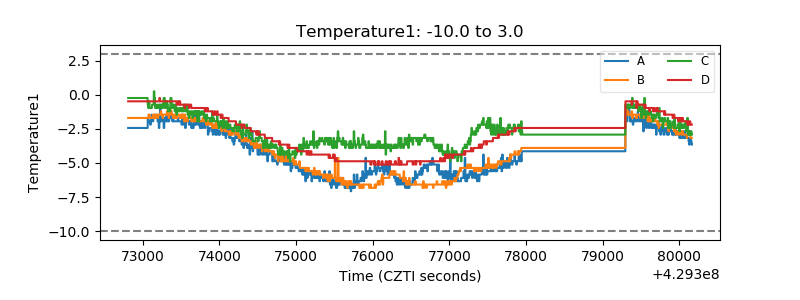 |
| Veto HV Monitor | 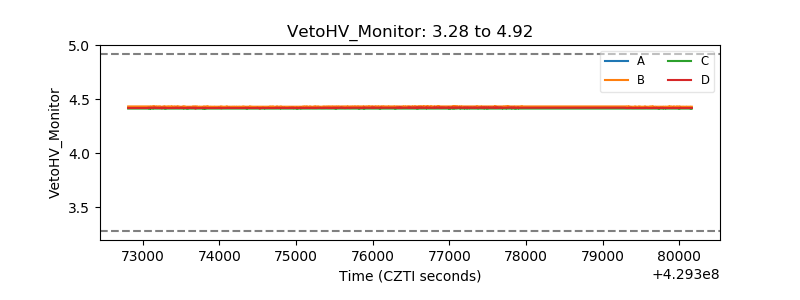 |
| Veto LLD | 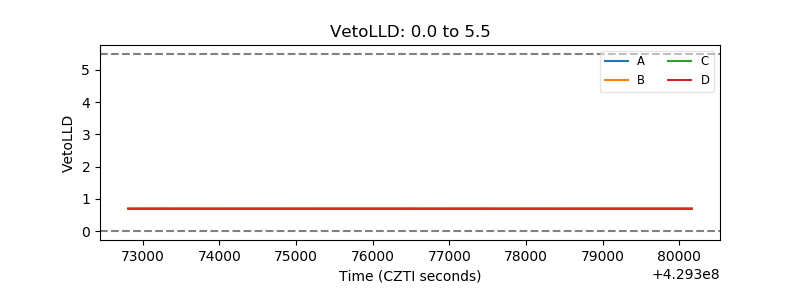 |
| Alpha Counter | 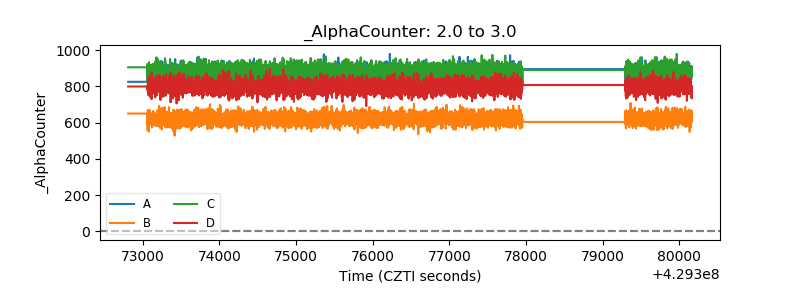 |
| _CPM_Rate | 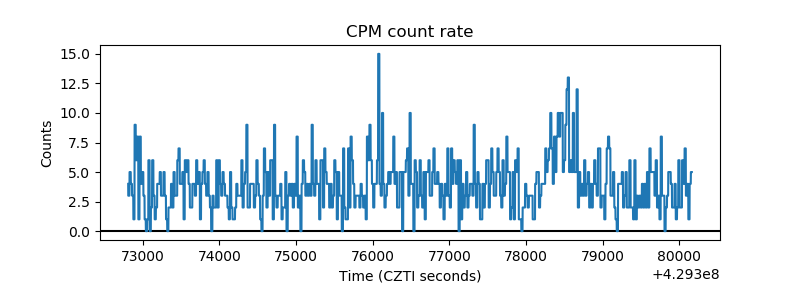 |
| CZT Counter | 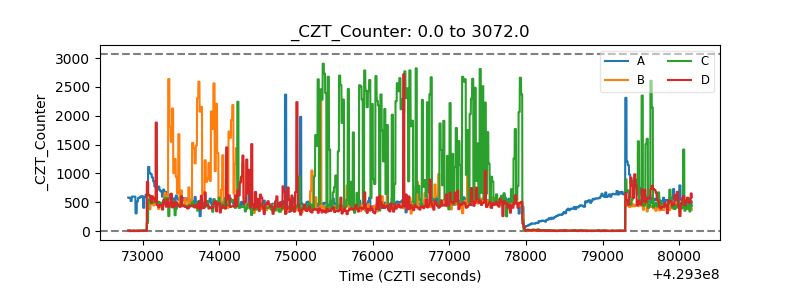 |
| +2.5 Volts monitor | 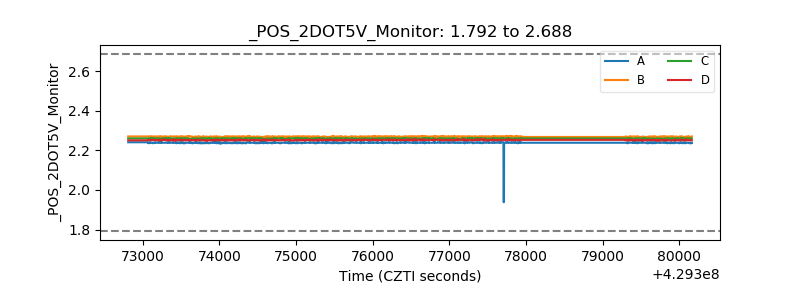 |
| +5 Volts monitor |  |
| _ROLL_ROT | 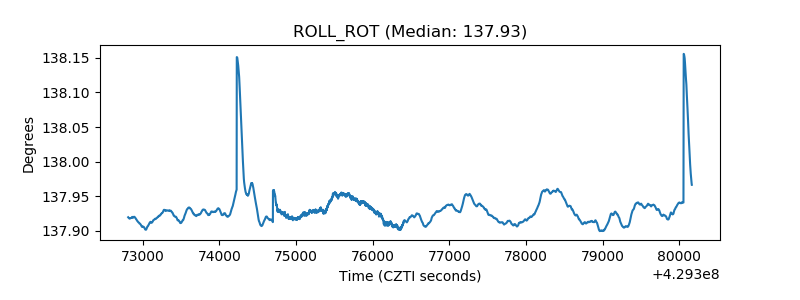 |
| _Roll_DEC | 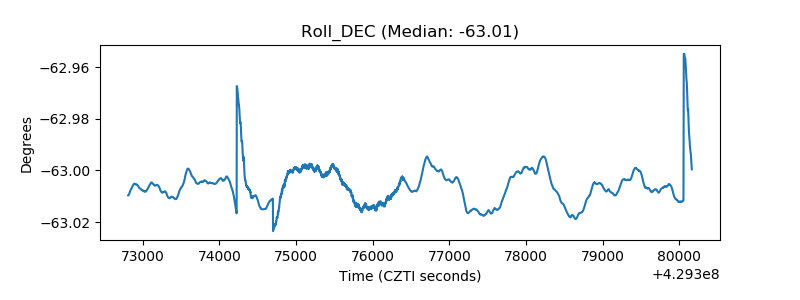 |
| _Roll_RA | 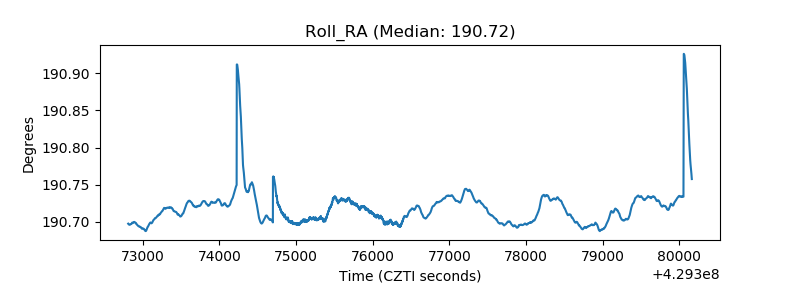 |
| Veto Counter | 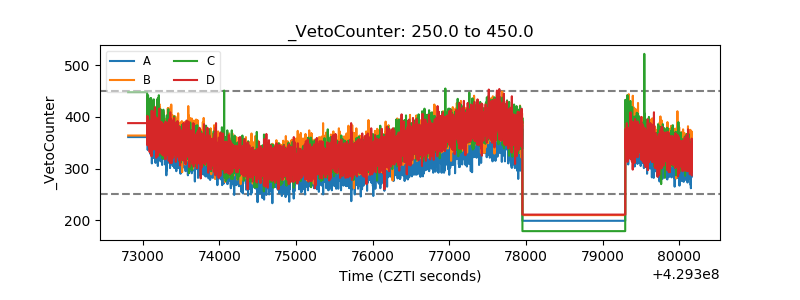 |