| Param | Original file | Final file |
|---|---|---|
| Filename | modeM0/AS1A09_002T01_9000005810_42538cztM0_level2.fits | modeM0/AS1A09_002T01_9000005810_42538cztM0_level2_quad_clean.evt |
| Size (bytes) | 348,629,760 | 97,588,800 |
| Size | 332.5 MB | 93.1 MB |
| Events in quadrant A | 3,135,458 | 655,658 |
| Events in quadrant B | 2,562,398 | 663,878 |
| Events in quadrant C | 3,052,117 | 637,048 |
| Events in quadrant D | 3,690,583 | 581,429 |
| Mode M0 | |||
|---|---|---|---|
| Quadrant | BADHDUFLAG | Total packets | Discarded packets |
| A | 0 | 12904 | 2 |
| B | 0 | 12065 | 2 |
| C | 0 | 13139 | 3 |
| D | 0 | 15198 | 2 |
| Mode M9 | |||
|---|---|---|---|
| Quadrant | BADHDUFLAG | Total packets | Discarded packets |
| A | 0 | 19 | 0 |
| B | 0 | 20 | 0 |
| C | 0 | 20 | 0 |
| D | 0 | 20 | 0 |
| Mode SS | |||
|---|---|---|---|
| Quadrant | BADHDUFLAG | Total packets | Discarded packets |
| A | 0 | 122 | 0 |
| B | 0 | 122 | 0 |
| C | 0 | 122 | 0 |
| D | 0 | 122 | 0 |
| Quadrant | Total seconds | Saturated seconds | Saturation percentage |
|---|---|---|---|
| A | 5965 | 14 | 0.234702% |
| B | 5965 | 6 | 0.100587% |
| C | 5964 | 45 | 0.754527% |
| D | 5964 | 146 | 2.448021% |
Noise dominated data is calculated using 1-second bins in cleaned event files. If a bin has >2000 counts, and if more than 50% of those come from <1% of pixels, then it is considered to be noise-dominated and hence unusable.
| Quadrant | # 1 sec bins | Bins with >0 counts | Bins with >2000 counts | High rate bins dominated by noise | Noise dominated (total time) | Noise dominated (detector-on time) | Marked lightcurve |
|---|---|---|---|---|---|---|---|
| A | 7248 | 5966 | 5 | 5 | 0.07% | 0.08% | 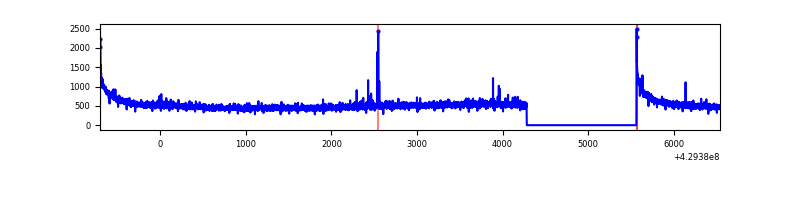 |
| B | 7247 | 5965 | 2 | 2 | 0.03% | 0.03% | 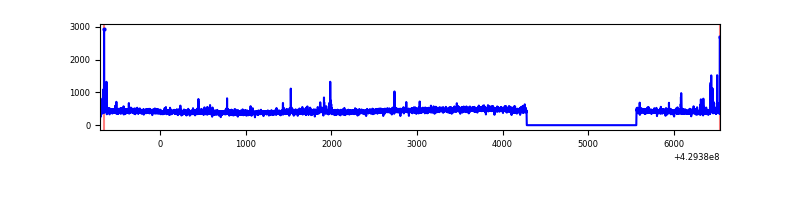 |
| C | 7247 | 5965 | 36 | 36 | 0.50% | 0.60% | 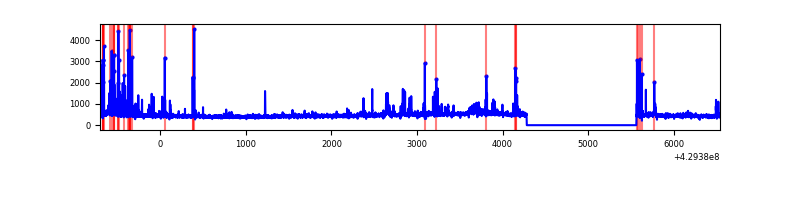 |
| D | 7247 | 5965 | 141 | 141 | 1.95% | 2.36% | 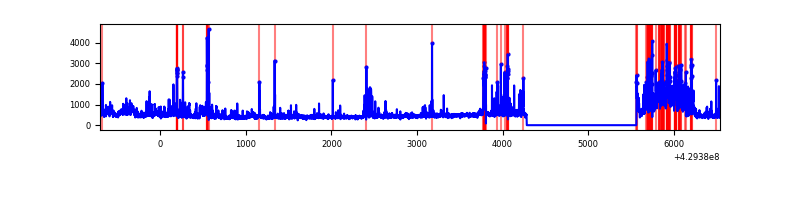 |
Top three noisy pixels from each quadrant. If the there are fewer than three noisy pixels in the level2.evt file, extra rows are filled as -1
| Pixel properties | Quadrant properties | ||||||
|---|---|---|---|---|---|---|---|
| Quadrant | DetID | PixID | Counts | Sigma | Mean | Median | Sigma |
| A | 10 | 83 | 625797 | 4696.71 | 639 | 626 | 133.1 |
| A | 2 | 79 | 16328 | 117.96 | 639 | 626 | 133.1 |
| A | 7 | 3 | 14976 | 107.81 | 639 | 626 | 133.1 |
| B | 0 | 245 | 36059 | 288.14 | 635 | 615 | 123.0 |
| B | 5 | 255 | 20605 | 162.51 | 635 | 615 | 123.0 |
| B | 12 | 111 | 15506 | 121.05 | 635 | 615 | 123.0 |
| C | 5 | 250 | 296461 | 2039.6 | 619 | 623 | 145.0 |
| C | 15 | 214 | 247220 | 1700.12 | 619 | 623 | 145.0 |
| C | 1 | 16 | 38160 | 258.79 | 619 | 623 | 145.0 |
| D | 2 | 249 | 372002 | 2453.22 | 615 | 598 | 151.4 |
| D | 1 | 52 | 300152 | 1978.63 | 615 | 598 | 151.4 |
| D | 1 | 47 | 215539 | 1419.74 | 615 | 598 | 151.4 |
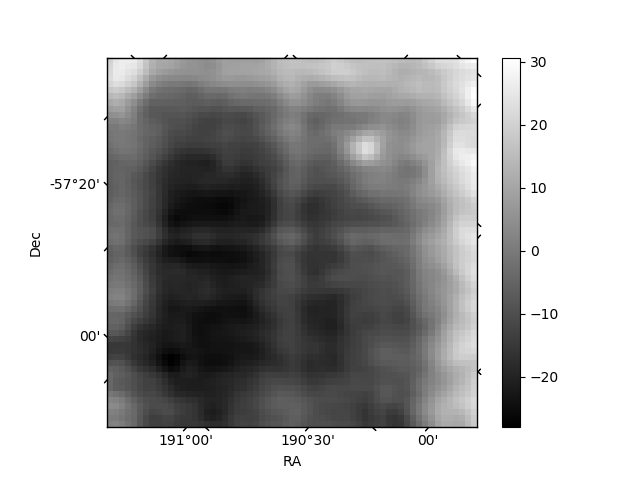
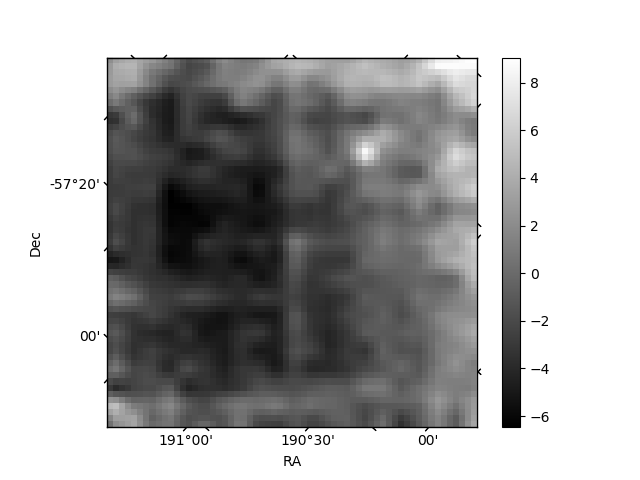
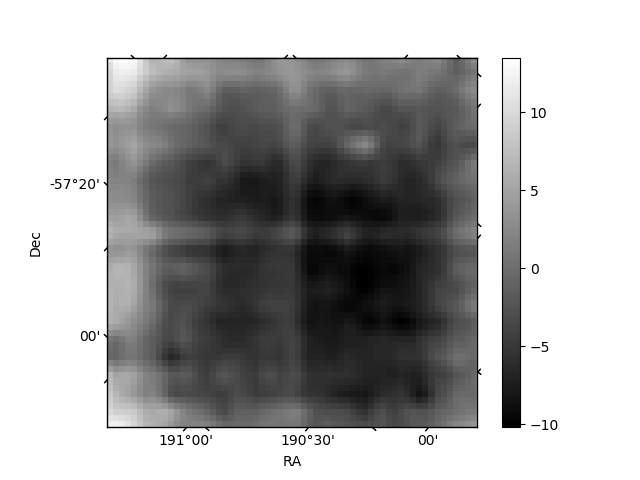
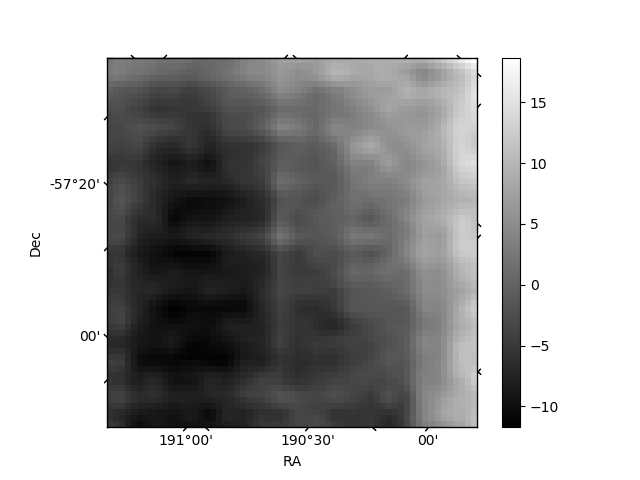
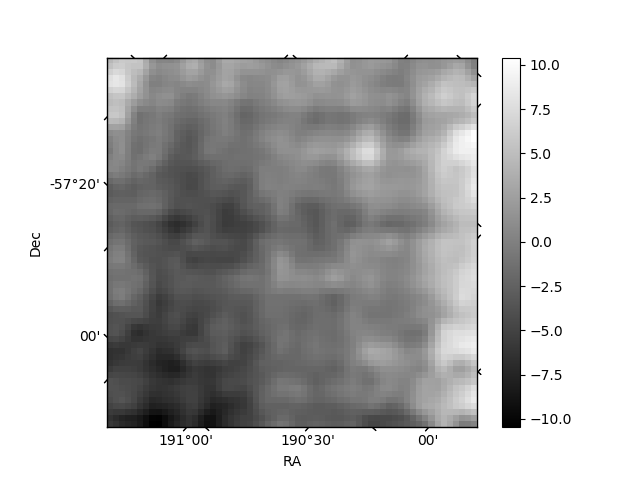
Histogram calculated using DETX and DETY for each event in the final _common_clean file
| Quadrant A | 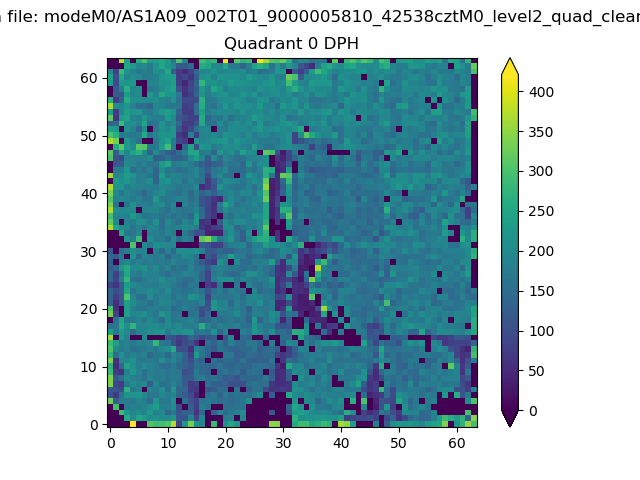 |
 |
Quadrant B |
|---|---|---|---|
| Quadrant D | 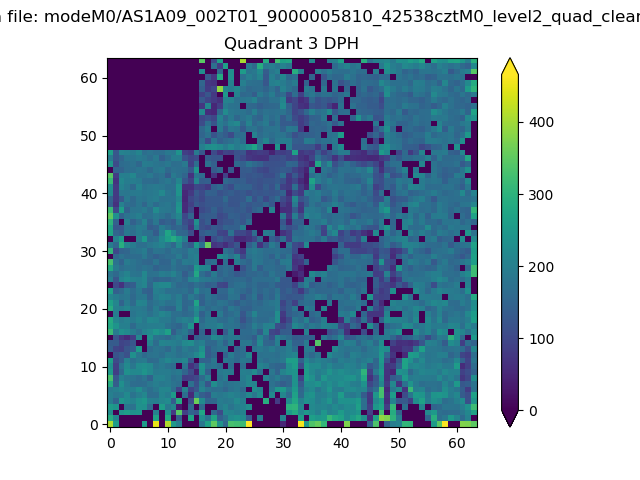 |
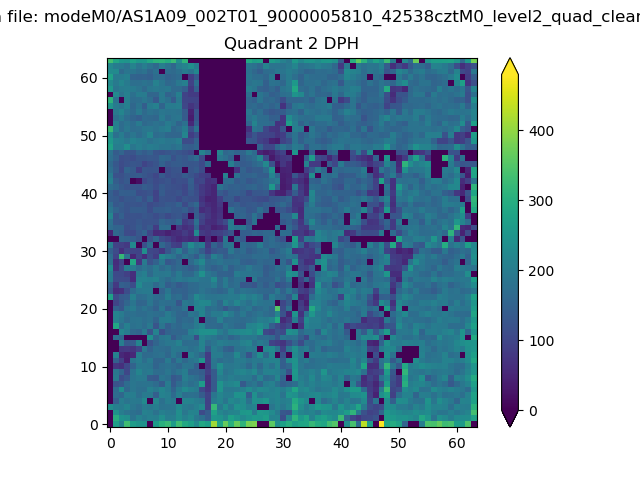 |
Quadrant C |
| Plot type | Count rate plots | Images |
|---|---|---|
| Comparison with Poisson distribution Blue bars denote a histogram of data divided into 1 sec bins. Red curve is a Poisson curve with rate = median count rate of data. |
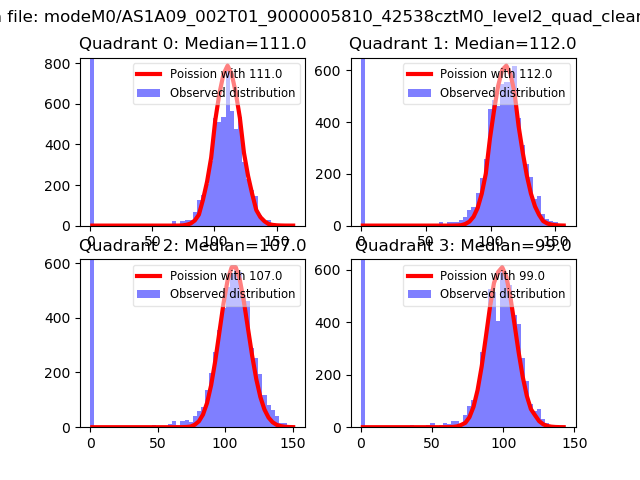 |
 |
| Quadrant-wise count rates Data is divided into 100 sec bins |
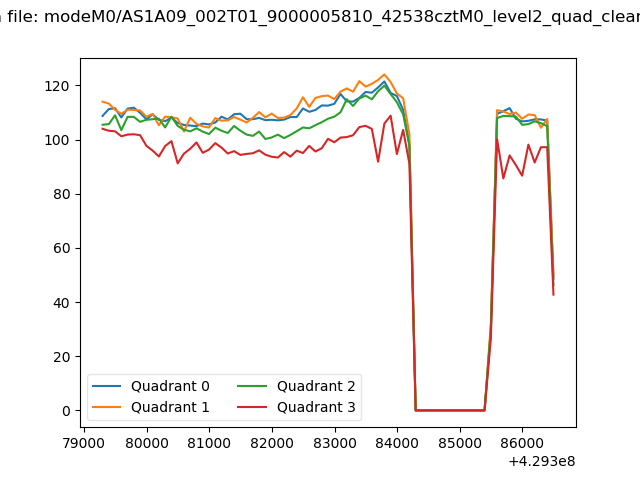 |
|
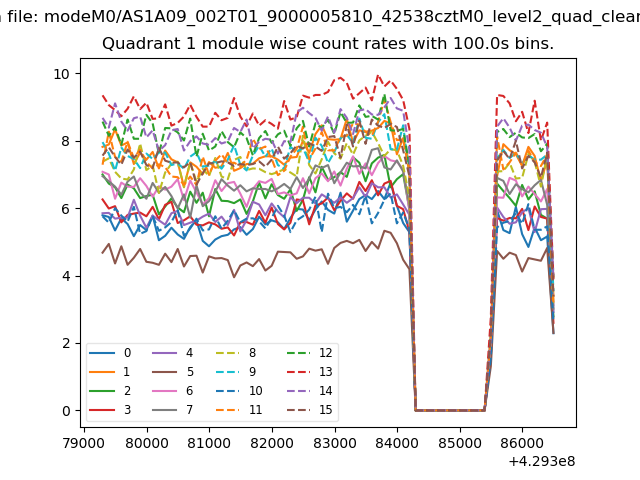
| Module-wise count rates for Quadrant A Data is divided into 100 sec bins |
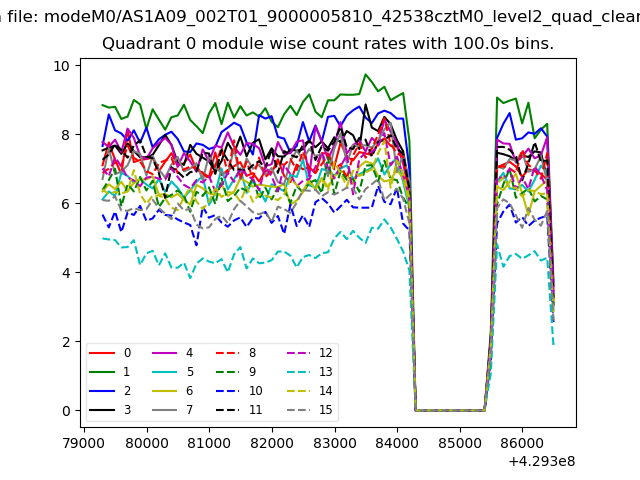 |
 |
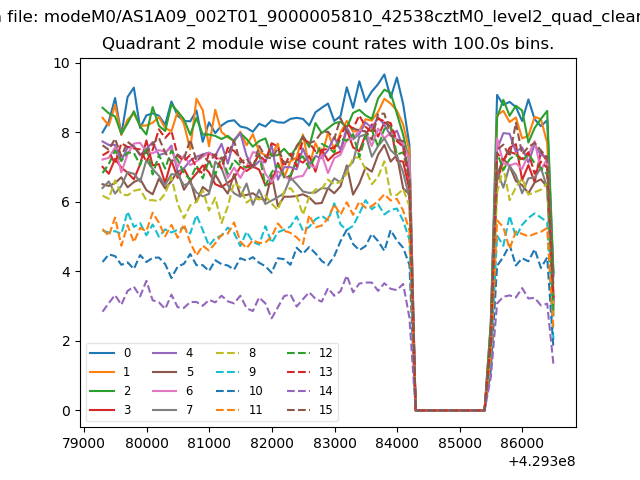
| Module-wise count rates for Quadrant B Data is divided into 100 sec bins |
 |
 |
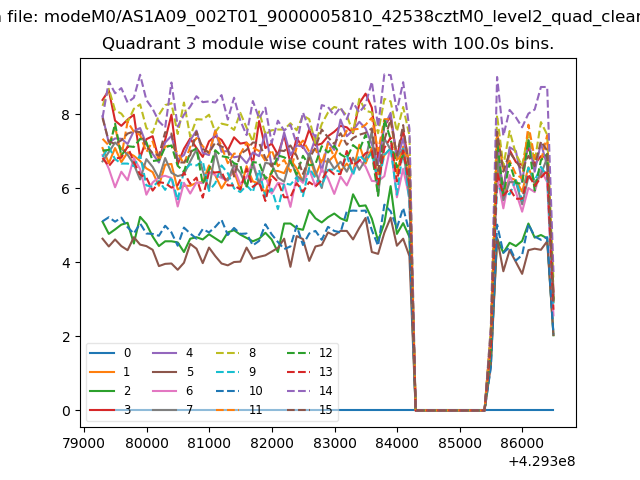
| Module-wise count rates for Quadrant C Data is divided into 100 sec bins |
 |
 |
| Module-wise count rates for Quadrant D Data is divided into 100 sec bins |
 |
 |
| Parameter | Plot |
|---|---|
| CZT HV Monitor | 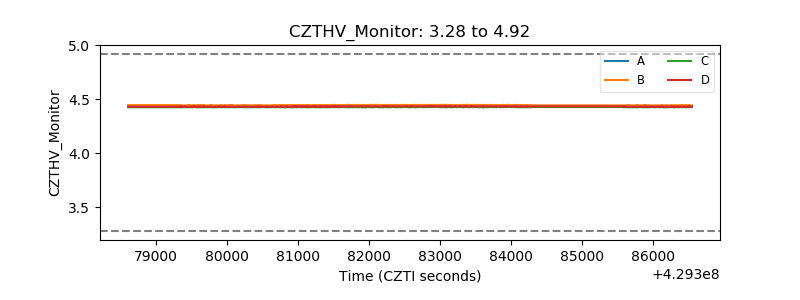 |
| D_VDD | 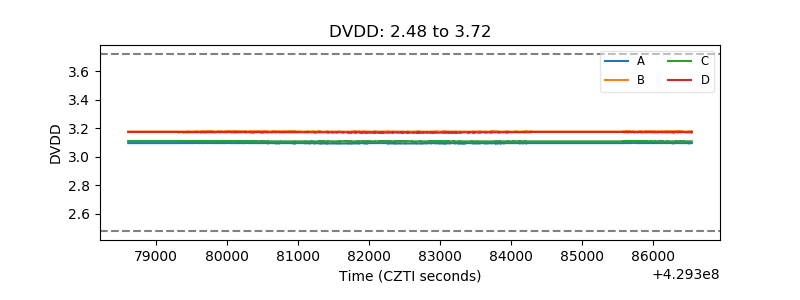 |
| Temperature 1 | 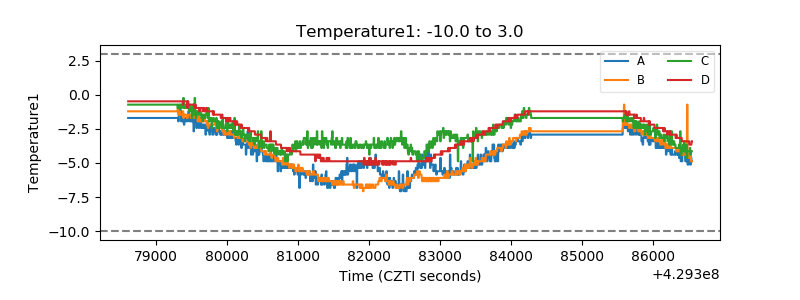 |
| Veto HV Monitor | 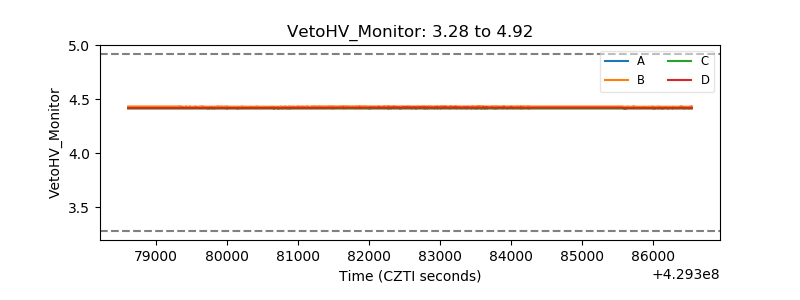 |
| Veto LLD | 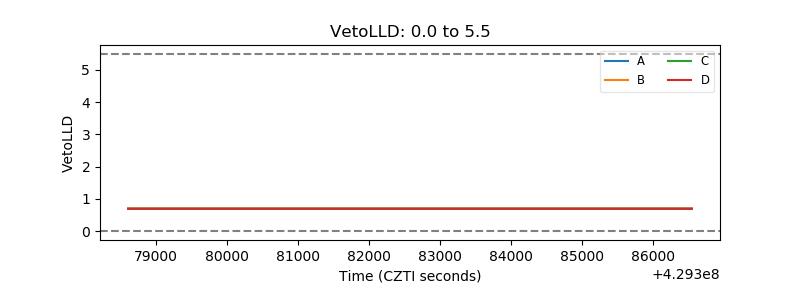 |
| Alpha Counter | 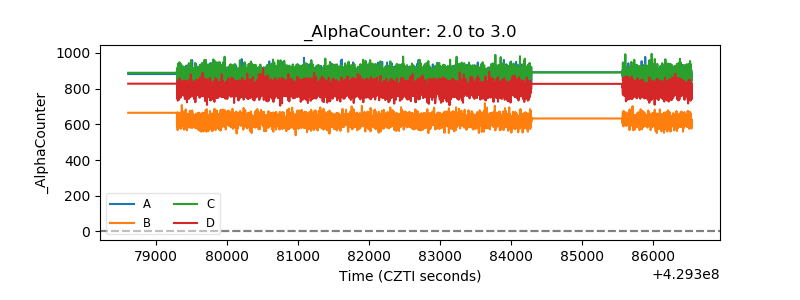 |
| _CPM_Rate | 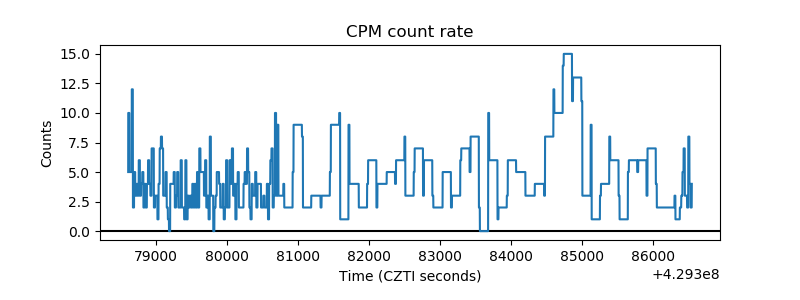 |
| CZT Counter | 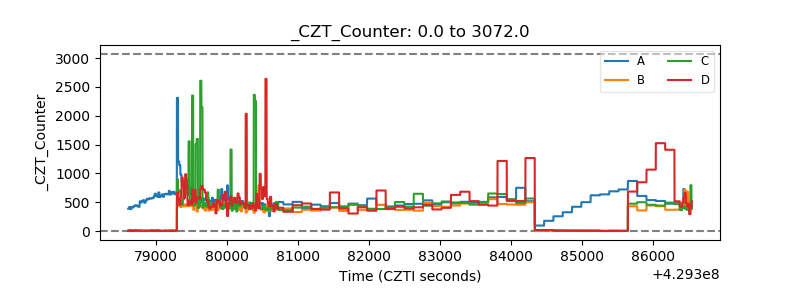 |
| +2.5 Volts monitor | 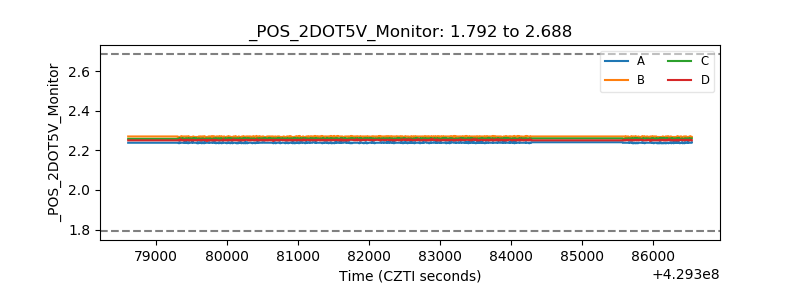 |
| +5 Volts monitor | 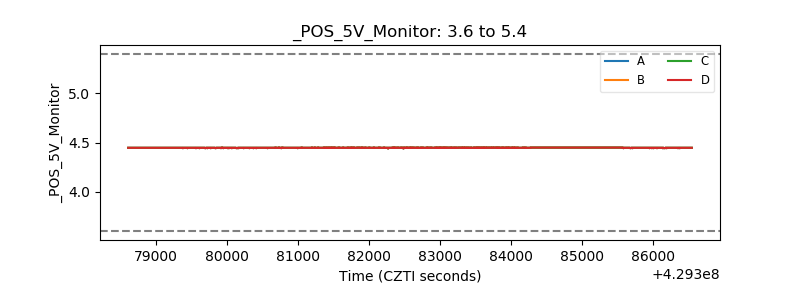 |
| _ROLL_ROT | 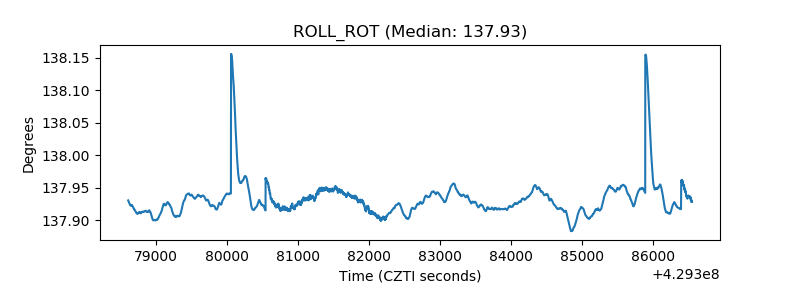 |
| _Roll_DEC | 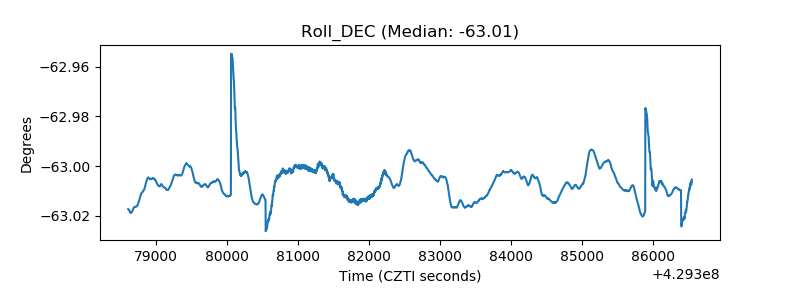 |
| _Roll_RA | 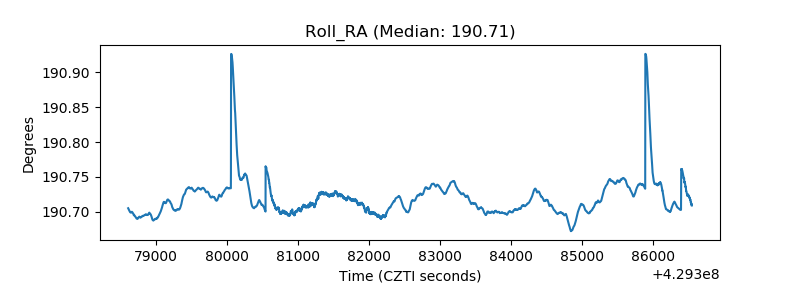 |
| Veto Counter | 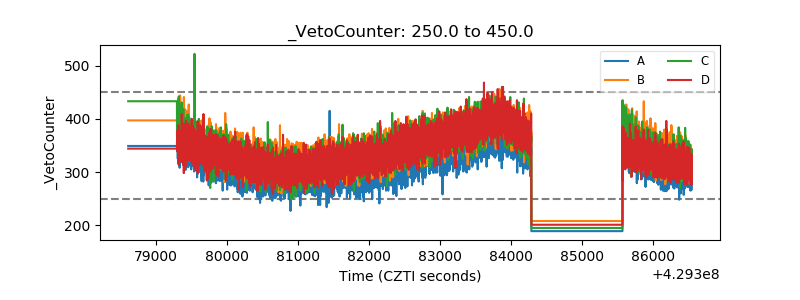 |