| Param | Original file | Final file |
|---|---|---|
| Filename | modeM0/AS1A09_002T01_9000005810_42540cztM0_level2.fits | modeM0/AS1A09_002T01_9000005810_42540cztM0_level2_quad_clean.evt |
| Size (bytes) | 573,716,160 | 155,445,120 |
| Size | 547.1 MB | 148.2 MB |
| Events in quadrant A | 4,976,633 | 1,040,401 |
| Events in quadrant B | 4,315,285 | 1,065,271 |
| Events in quadrant C | 4,473,864 | 1,019,661 |
| Events in quadrant D | 6,713,090 | 904,516 |
| Mode M0 | |||
|---|---|---|---|
| Quadrant | BADHDUFLAG | Total packets | Discarded packets |
| A | 0 | 20664 | 2 |
| B | 0 | 20021 | 2 |
| C | 0 | 19840 | 2 |
| D | 0 | 27279 | 2 |
| Mode M9 | |||
|---|---|---|---|
| Quadrant | BADHDUFLAG | Total packets | Discarded packets |
| A | 0 | 27 | 0 |
| B | 0 | 28 | 0 |
| C | 0 | 28 | 0 |
| D | 0 | 28 | 0 |
| Mode SS | |||
|---|---|---|---|
| Quadrant | BADHDUFLAG | Total packets | Discarded packets |
| A | 0 | 198 | 0 |
| B | 0 | 198 | 0 |
| C | 0 | 198 | 0 |
| D | 0 | 198 | 0 |
| Quadrant | Total seconds | Saturated seconds | Saturation percentage |
|---|---|---|---|
| A | 9765 | 19 | 0.194572% |
| B | 9765 | 34 | 0.348182% |
| C | 9765 | 18 | 0.184332% |
| D | 9765 | 503 | 5.151050% |
Noise dominated data is calculated using 1-second bins in cleaned event files. If a bin has >2000 counts, and if more than 50% of those come from <1% of pixels, then it is considered to be noise-dominated and hence unusable.
| Quadrant | # 1 sec bins | Bins with >0 counts | Bins with >2000 counts | High rate bins dominated by noise | Noise dominated (total time) | Noise dominated (detector-on time) | Marked lightcurve |
|---|---|---|---|---|---|---|---|
| A | 11107 | 9766 | 5 | 5 | 0.05% | 0.05% | 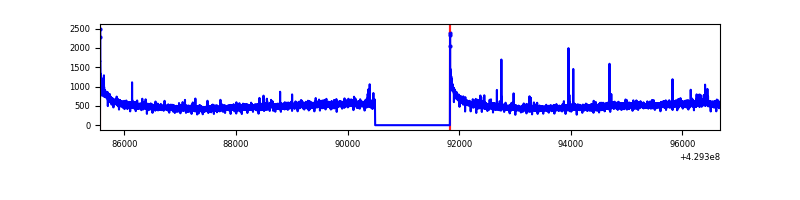 |
| B | 11107 | 9766 | 16 | 16 | 0.14% | 0.16% | 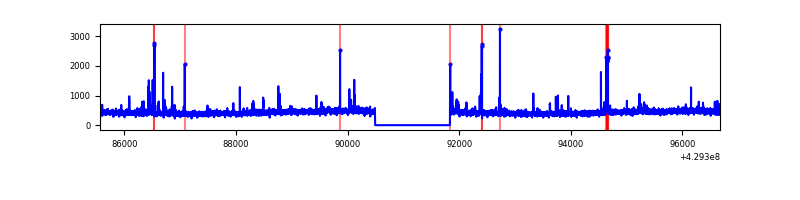 |
| C | 11107 | 9766 | 5 | 5 | 0.05% | 0.05% | 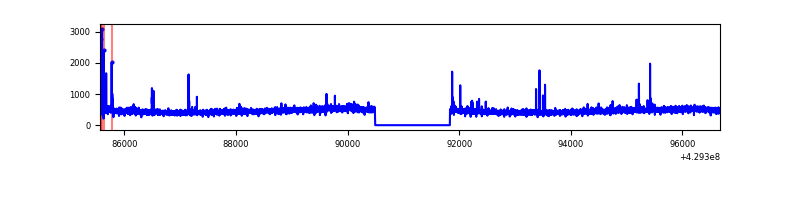 |
| D | 11107 | 9766 | 412 | 412 | 3.71% | 4.22% | 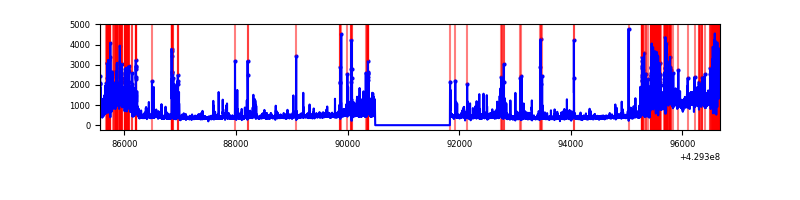 |
Top three noisy pixels from each quadrant. If the there are fewer than three noisy pixels in the level2.evt file, extra rows are filled as -1
| Pixel properties | Quadrant properties | ||||||
|---|---|---|---|---|---|---|---|
| Quadrant | DetID | PixID | Counts | Sigma | Mean | Median | Sigma |
| A | 10 | 83 | 861781 | 4012.46 | 1047 | 1026 | 214.5 |
| A | 2 | 79 | 28127 | 126.33 | 1047 | 1026 | 214.5 |
| A | 13 | 248 | 20948 | 92.87 | 1047 | 1026 | 214.5 |
| B | 0 | 245 | 113696 | 565.82 | 1039 | 1010 | 199.2 |
| B | 5 | 255 | 65247 | 322.55 | 1039 | 1010 | 199.2 |
| B | 5 | 172 | 47868 | 235.28 | 1039 | 1010 | 199.2 |
| C | 15 | 214 | 398109 | 1669.45 | 1021 | 1025 | 237.9 |
| C | 14 | 254 | 37520 | 153.43 | 1021 | 1025 | 237.9 |
| C | 5 | 250 | 32986 | 134.37 | 1021 | 1025 | 237.9 |
| D | 2 | 249 | 1385529 | 5677.97 | 998 | 969 | 243.8 |
| D | 2 | 16 | 649388 | 2659.11 | 998 | 969 | 243.8 |
| D | 1 | 47 | 266128 | 1087.4 | 998 | 969 | 243.8 |
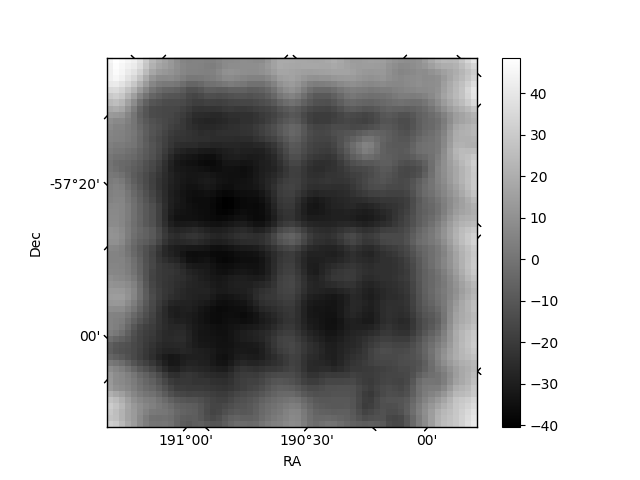
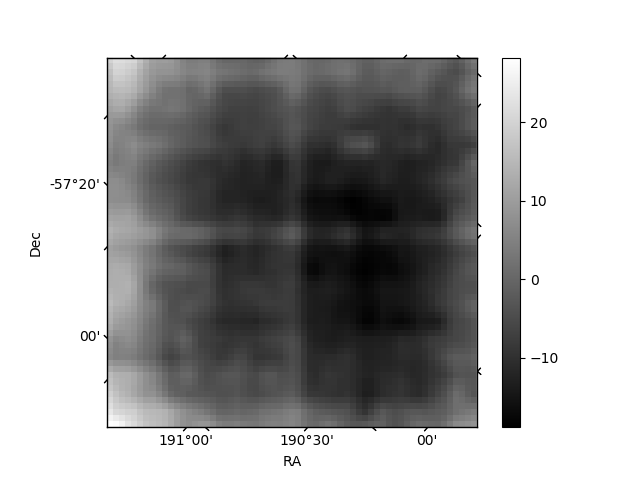
Histogram calculated using DETX and DETY for each event in the final _common_clean file
| Quadrant A | 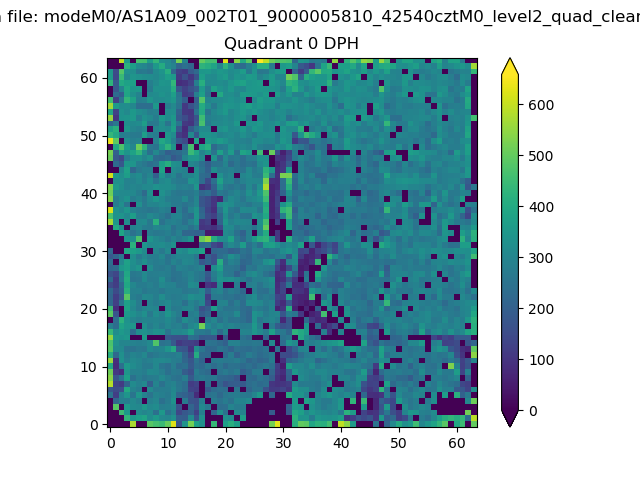 |
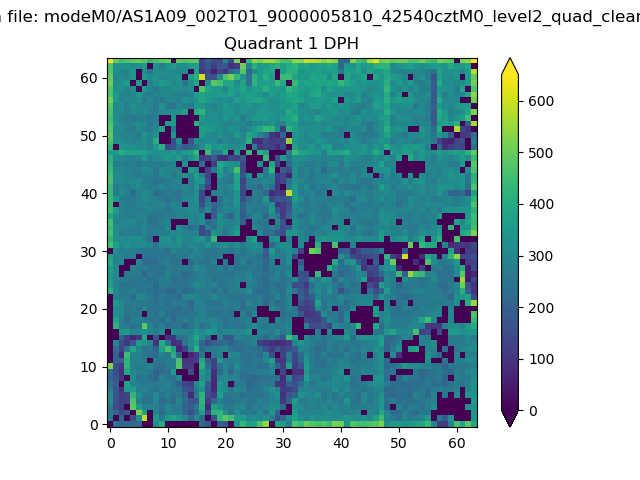 |
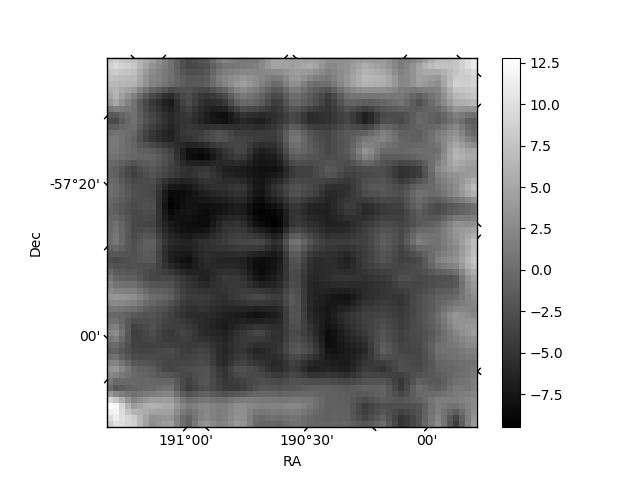
Quadrant B |
|---|---|---|---|
| Quadrant D | 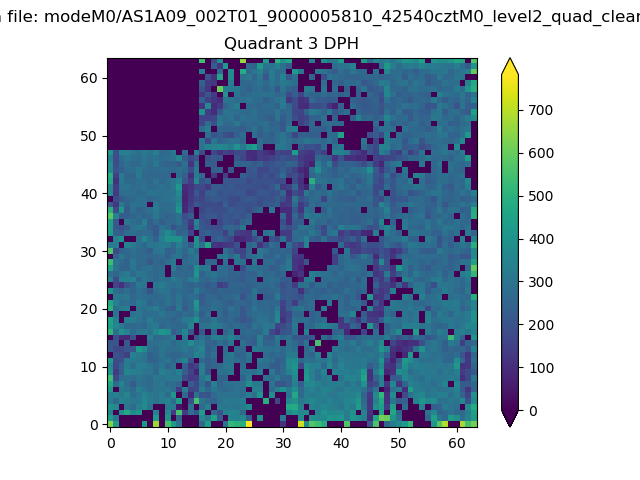 |
 |
Quadrant C |
| Plot type | Count rate plots | Images |
|---|---|---|
| Comparison with Poisson distribution Blue bars denote a histogram of data divided into 1 sec bins. Red curve is a Poisson curve with rate = median count rate of data. |
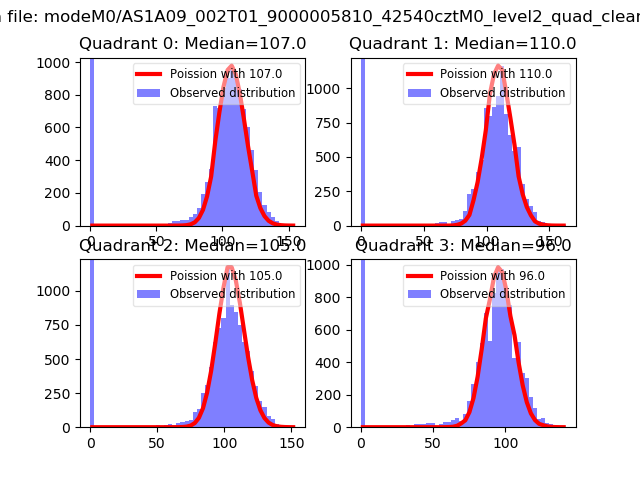 |
 |
| Quadrant-wise count rates Data is divided into 100 sec bins |
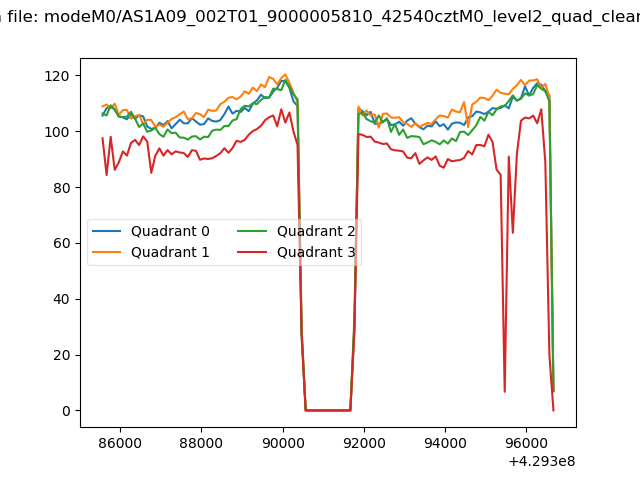 |
|
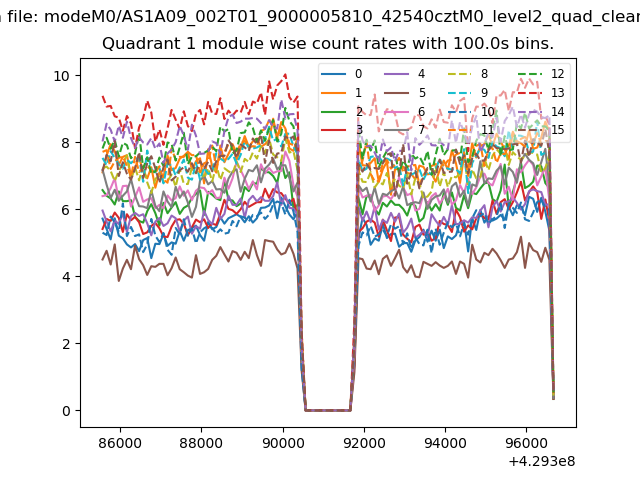
| Module-wise count rates for Quadrant A Data is divided into 100 sec bins |
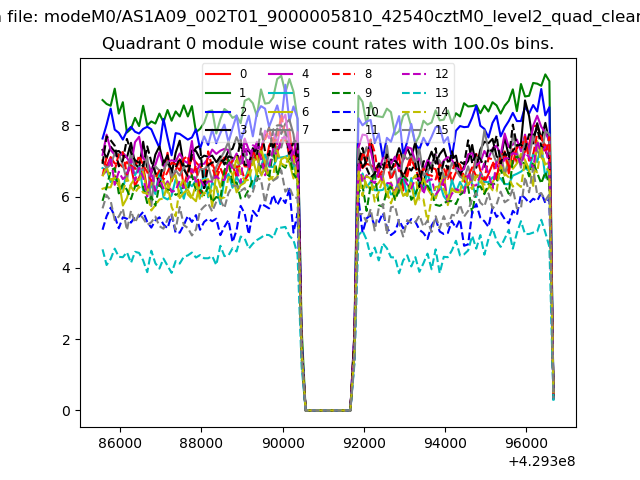 |
 |
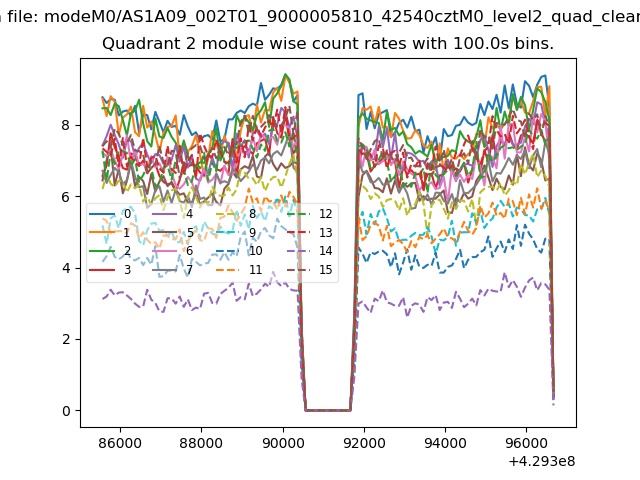
| Module-wise count rates for Quadrant B Data is divided into 100 sec bins |
 |
 |
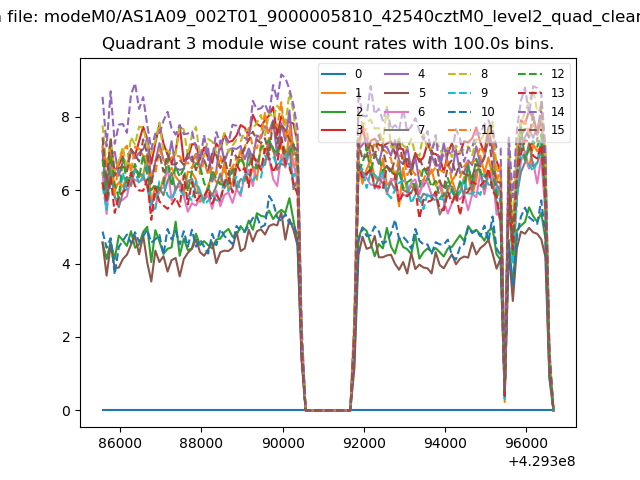
| Module-wise count rates for Quadrant C Data is divided into 100 sec bins |
 |
 |
| Module-wise count rates for Quadrant D Data is divided into 100 sec bins |
 |
 |
| Parameter | Plot |
|---|---|
| CZT HV Monitor | 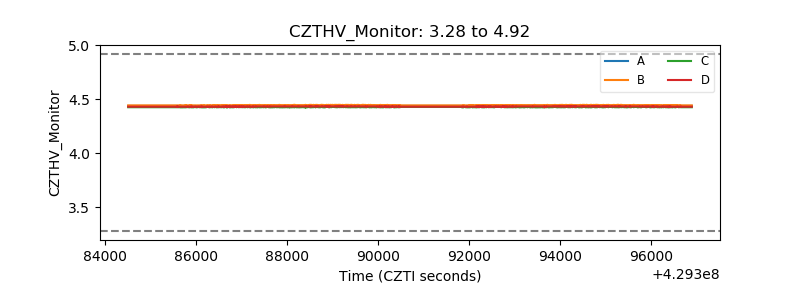 |
| D_VDD | 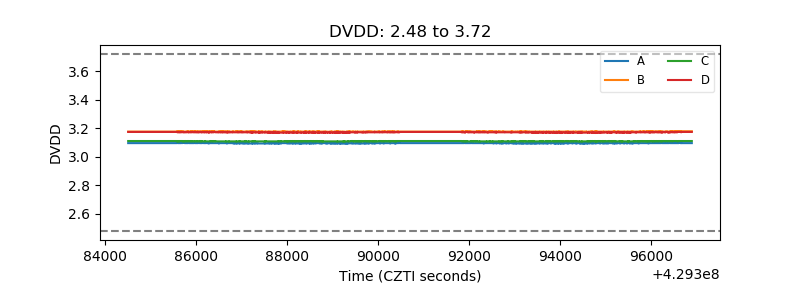 |
| Temperature 1 | 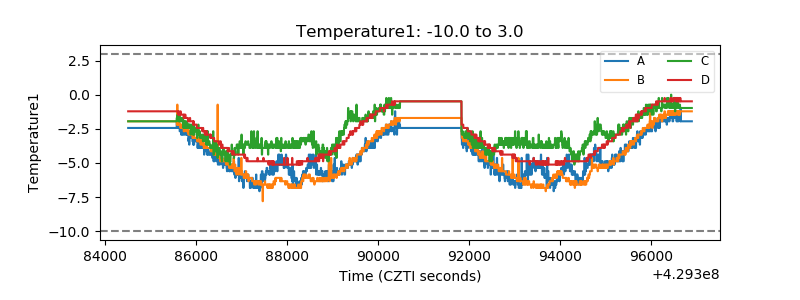 |
| Veto HV Monitor | 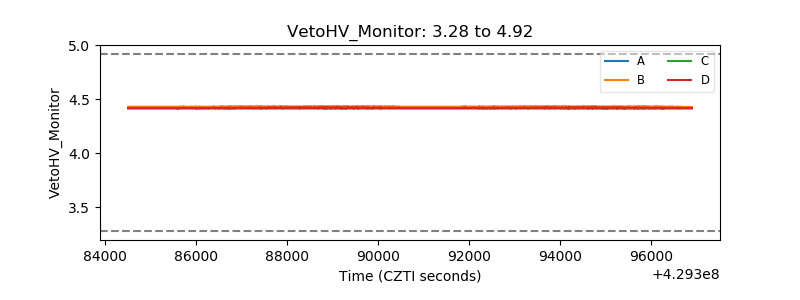 |
| Veto LLD | 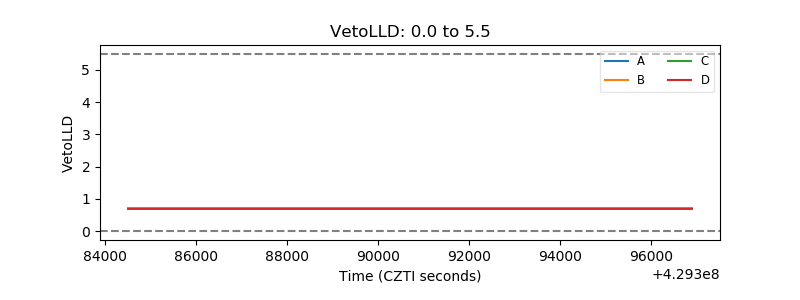 |
| Alpha Counter | 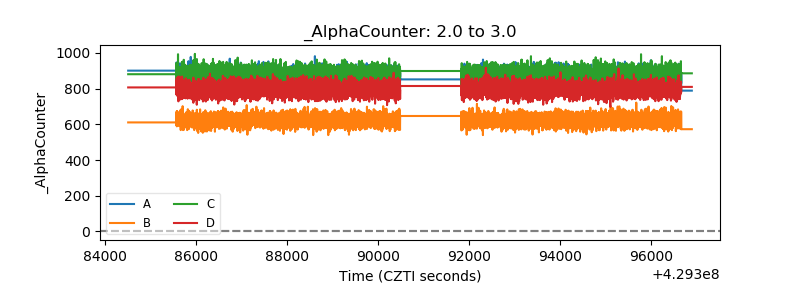 |
| _CPM_Rate | 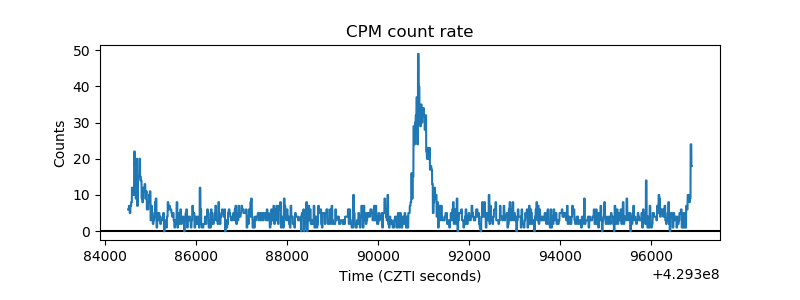 |
| CZT Counter |  |
| +2.5 Volts monitor |  |
| +5 Volts monitor |  |
| _ROLL_ROT | 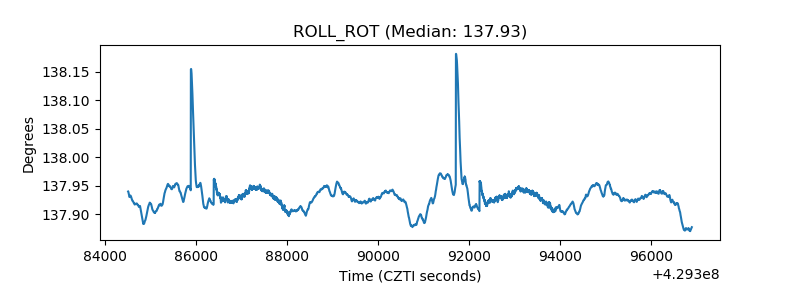 |
| _Roll_DEC | 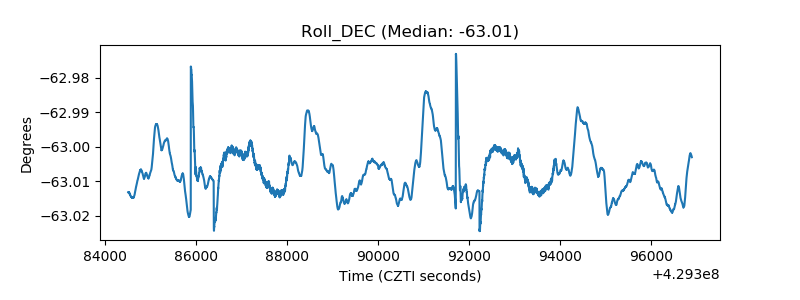 |
| _Roll_RA |  |
| Veto Counter | 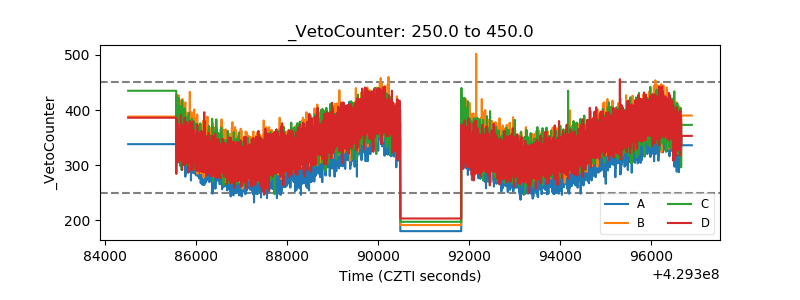 |