| Param | Original file | Final file |
|---|---|---|
| Filename | modeM0/AS1A09_002T01_9000005810_42541cztM0_level2.fits | modeM0/AS1A09_002T01_9000005810_42541cztM0_level2_quad_clean.evt |
| Size (bytes) | 338,503,680 | 93,271,680 |
| Size | 322.8 MB | 89.0 MB |
| Events in quadrant A | 3,106,900 | 629,309 |
| Events in quadrant B | 2,536,079 | 645,447 |
| Events in quadrant C | 2,772,573 | 610,605 |
| Events in quadrant D | 3,659,595 | 529,899 |
| Mode M0 | |||
|---|---|---|---|
| Quadrant | BADHDUFLAG | Total packets | Discarded packets |
| A | 0 | 12770 | 2 |
| B | 0 | 11880 | 2 |
| C | 0 | 12090 | 2 |
| D | 0 | 15388 | 2 |
| Mode M9 | |||
|---|---|---|---|
| Quadrant | BADHDUFLAG | Total packets | Discarded packets |
| A | 0 | 29 | 0 |
| B | 0 | 29 | 0 |
| C | 0 | 29 | 0 |
| D | 0 | 29 | 0 |
| Mode SS | |||
|---|---|---|---|
| Quadrant | BADHDUFLAG | Total packets | Discarded packets |
| A | 0 | 124 | 0 |
| B | 0 | 124 | 0 |
| C | 0 | 124 | 0 |
| D | 0 | 124 | 0 |
| Quadrant | Total seconds | Saturated seconds | Saturation percentage |
|---|---|---|---|
| A | 5838 | 40 | 0.685166% |
| B | 5838 | 17 | 0.291196% |
| C | 5838 | 26 | 0.445358% |
| D | 5838 | 448 | 7.673861% |
Noise dominated data is calculated using 1-second bins in cleaned event files. If a bin has >2000 counts, and if more than 50% of those come from <1% of pixels, then it is considered to be noise-dominated and hence unusable.
| Quadrant | # 1 sec bins | Bins with >0 counts | Bins with >2000 counts | High rate bins dominated by noise | Noise dominated (total time) | Noise dominated (detector-on time) | Marked lightcurve |
|---|---|---|---|---|---|---|---|
| A | 8822 | 5840 | 22 | 22 | 0.25% | 0.38% | 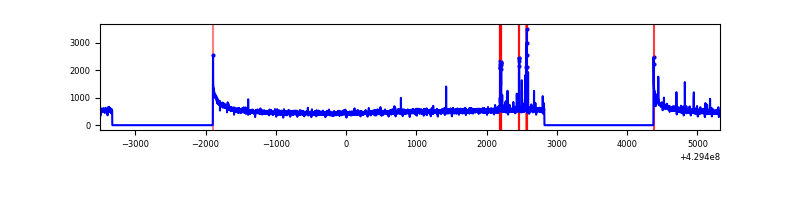 |
| B | 8822 | 5840 | 8 | 8 | 0.09% | 0.14% | 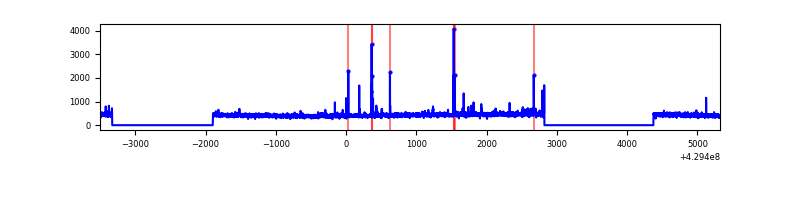 |
| C | 8822 | 5840 | 30 | 30 | 0.34% | 0.51% | 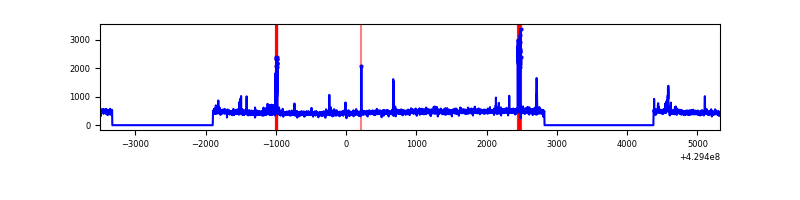 |
| D | 8822 | 5840 | 362 | 362 | 4.10% | 6.20% | 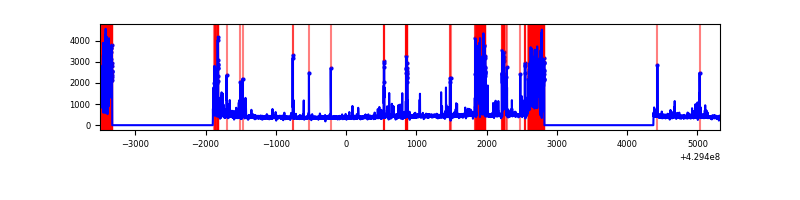 |
Top three noisy pixels from each quadrant. If the there are fewer than three noisy pixels in the level2.evt file, extra rows are filled as -1
| Pixel properties | Quadrant properties | ||||||
|---|---|---|---|---|---|---|---|
| Quadrant | DetID | PixID | Counts | Sigma | Mean | Median | Sigma |
| A | 10 | 83 | 587865 | 4603.5 | 624 | 613 | 127.6 |
| A | 2 | 79 | 89703 | 698.38 | 624 | 613 | 127.6 |
| A | 13 | 6 | 8895 | 64.92 | 624 | 613 | 127.6 |
| B | 5 | 172 | 55909 | 464.23 | 619 | 602 | 119.1 |
| B | 0 | 245 | 33697 | 277.79 | 619 | 602 | 119.1 |
| B | 12 | 111 | 14842 | 119.53 | 619 | 602 | 119.1 |
| C | 15 | 214 | 244897 | 1721.49 | 607 | 611 | 141.9 |
| C | 14 | 254 | 71141 | 497.03 | 607 | 611 | 141.9 |
| C | 9 | 54 | 68796 | 480.5 | 607 | 611 | 141.9 |
| D | 2 | 249 | 724905 | 5081.33 | 583 | 566 | 142.5 |
| D | 12 | 233 | 353903 | 2478.7 | 583 | 566 | 142.5 |
| D | 1 | 47 | 67787 | 471.56 | 583 | 566 | 142.5 |
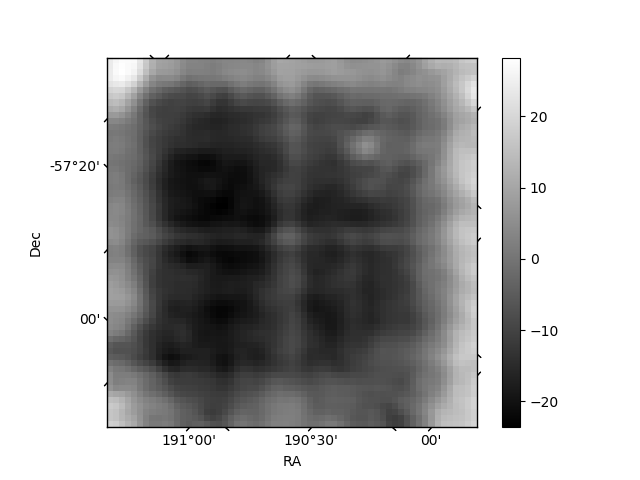
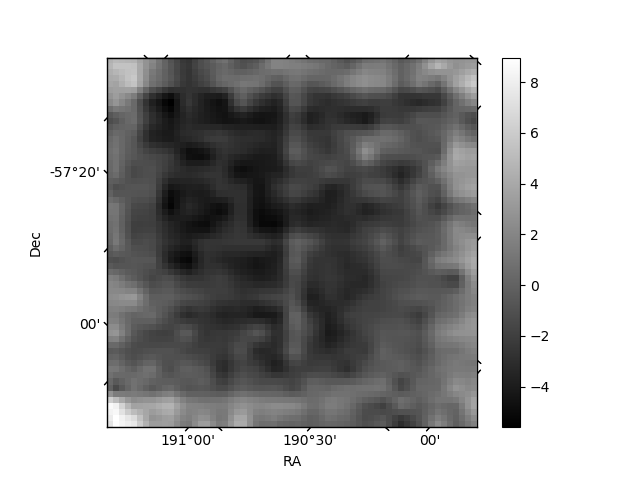
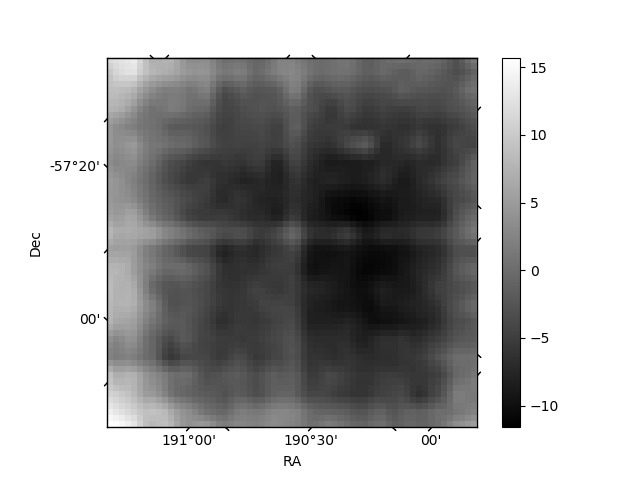
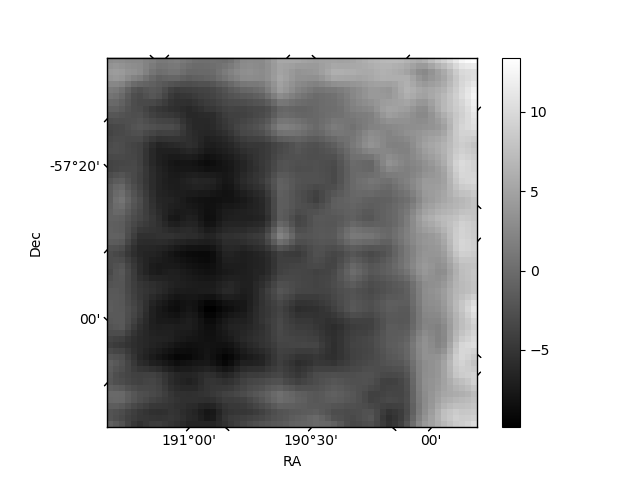
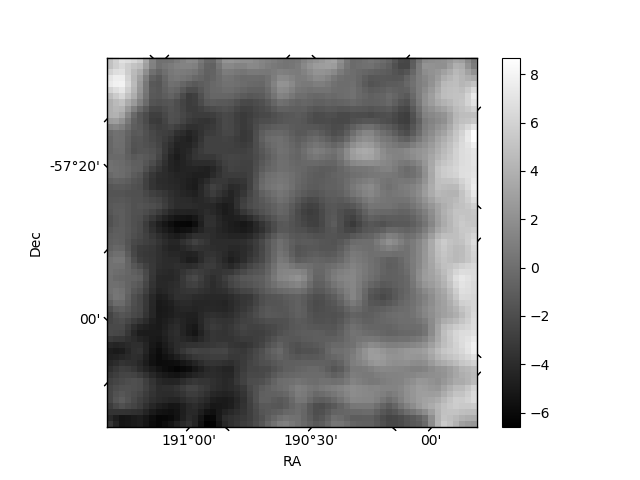
Histogram calculated using DETX and DETY for each event in the final _common_clean file
| Quadrant A | 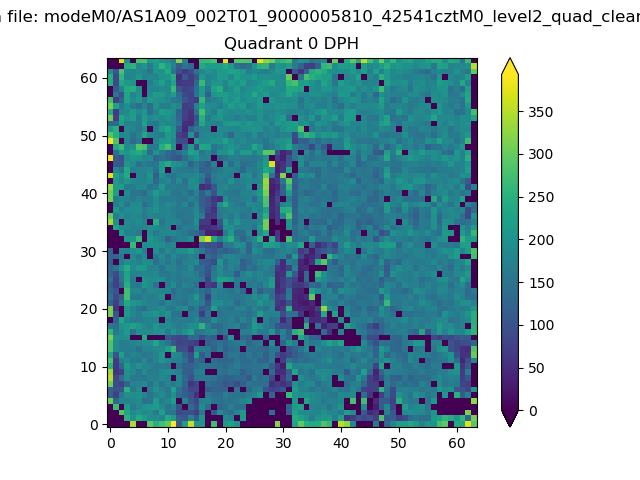 |
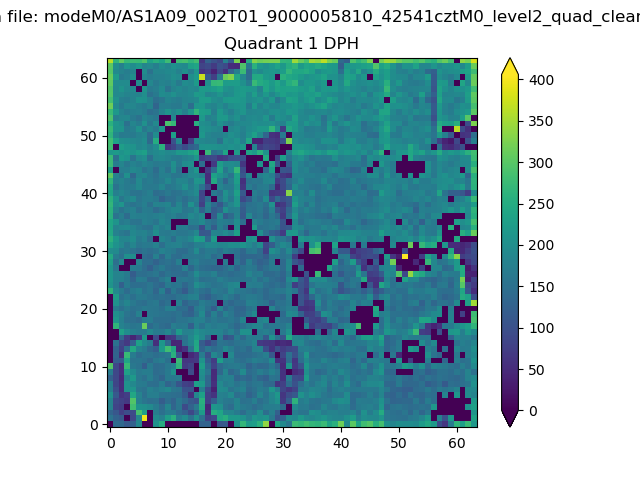 |
Quadrant B |
|---|---|---|---|
| Quadrant D | 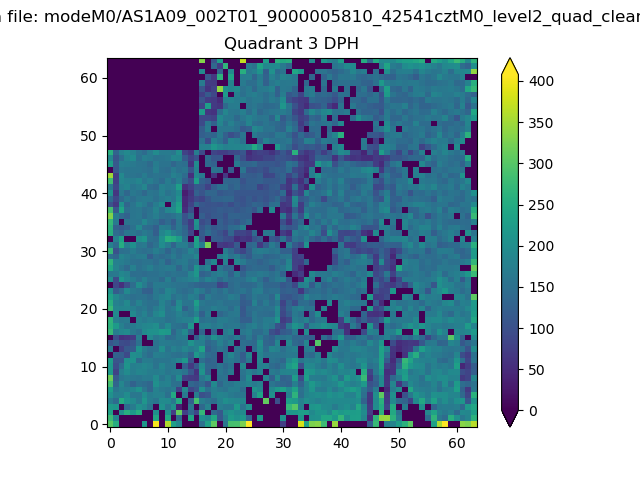 |
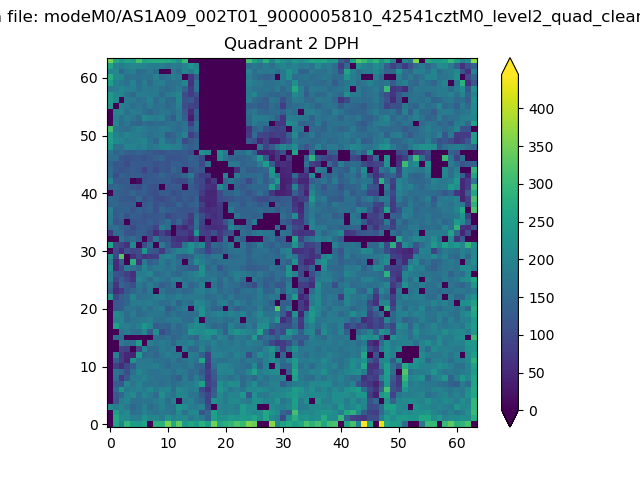 |
Quadrant C |
| Plot type | Count rate plots | Images |
|---|---|---|
| Comparison with Poisson distribution Blue bars denote a histogram of data divided into 1 sec bins. Red curve is a Poisson curve with rate = median count rate of data. |
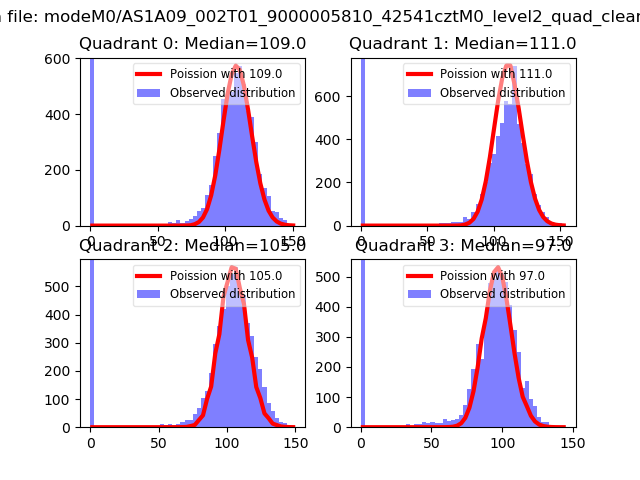 |
 |
| Quadrant-wise count rates Data is divided into 100 sec bins |
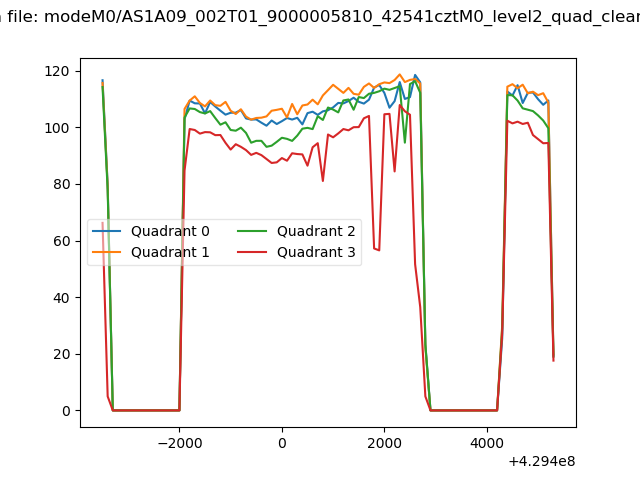 |
|
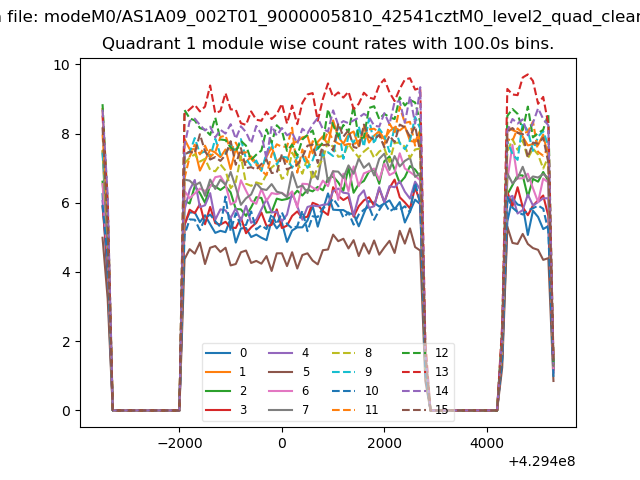
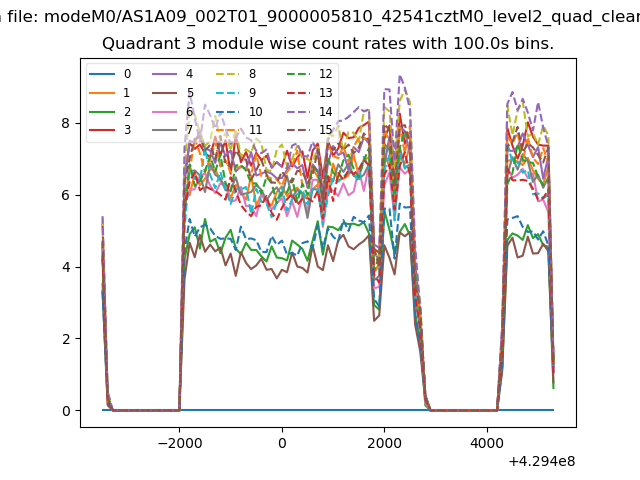
| Module-wise count rates for Quadrant A Data is divided into 100 sec bins |
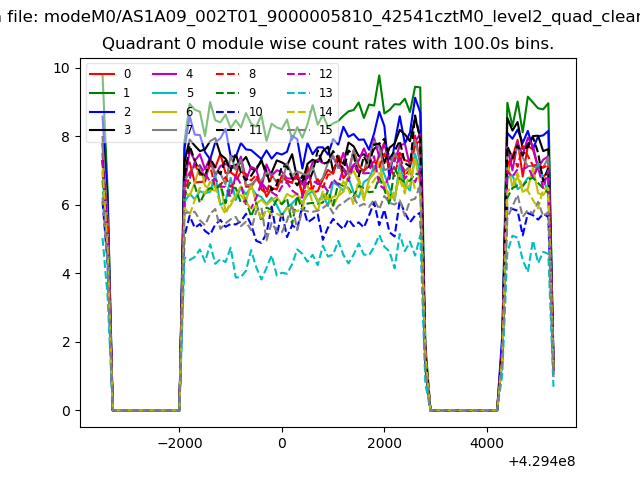 |
 |
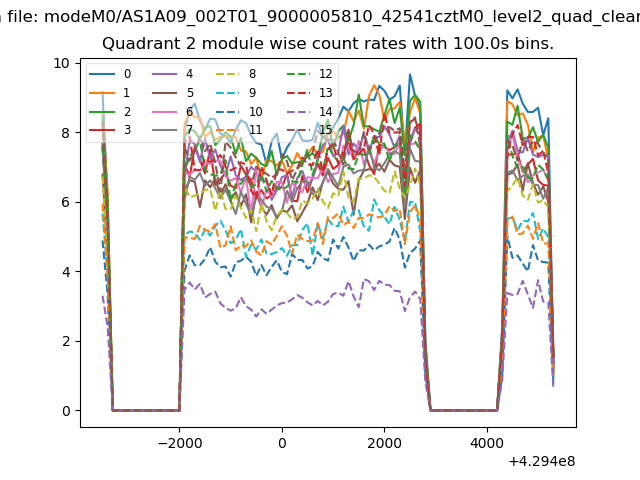
| Module-wise count rates for Quadrant B Data is divided into 100 sec bins |
 |
 |
| Module-wise count rates for Quadrant C Data is divided into 100 sec bins |
 |
 |
| Module-wise count rates for Quadrant D Data is divided into 100 sec bins |
 |
 |
| Parameter | Plot |
|---|---|
| CZT HV Monitor | 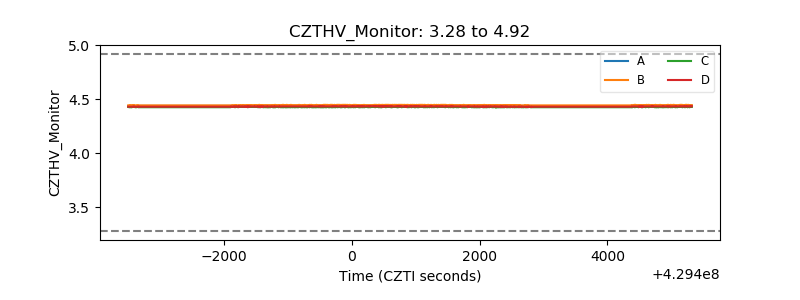 |
| D_VDD | 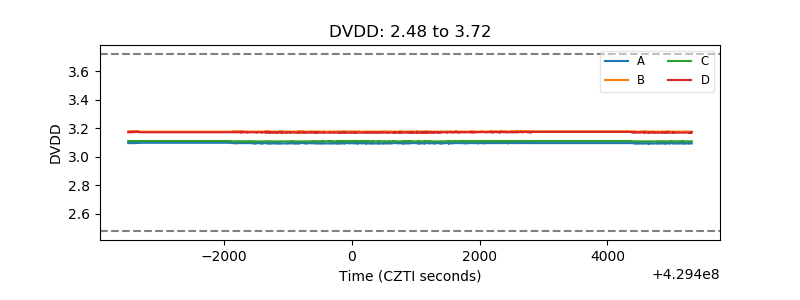 |
| Temperature 1 | 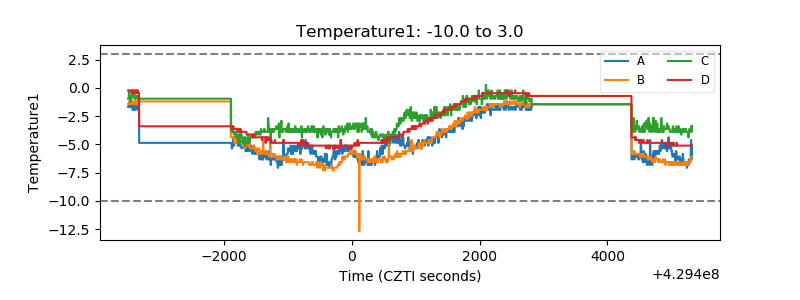 |
| Veto HV Monitor | 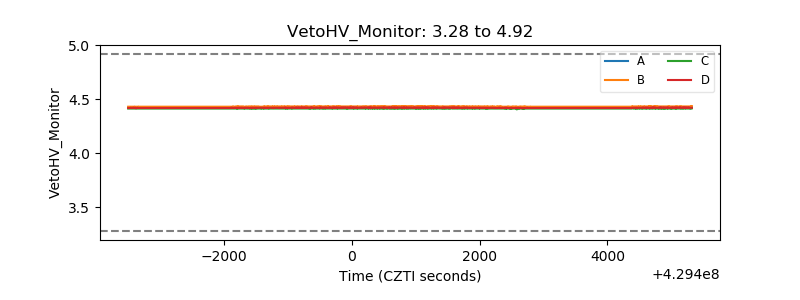 |
| Veto LLD | 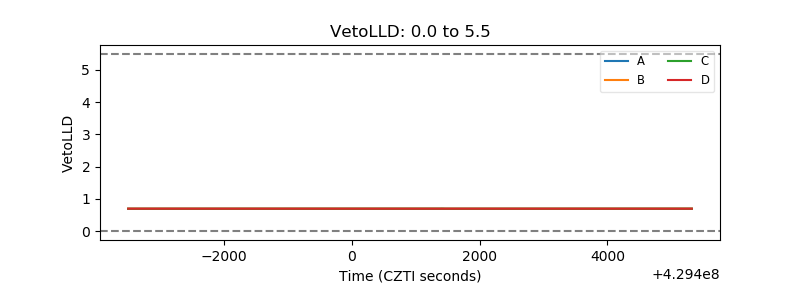 |
| Alpha Counter | 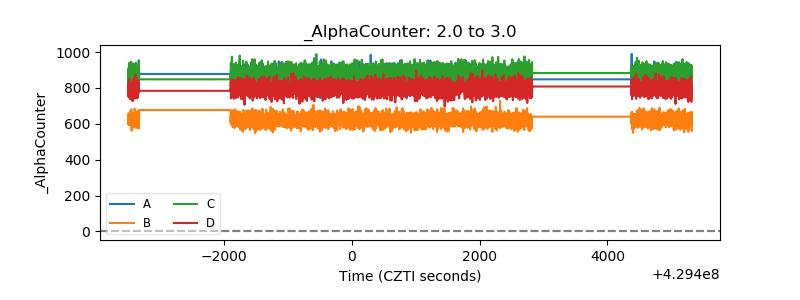 |
| _CPM_Rate | 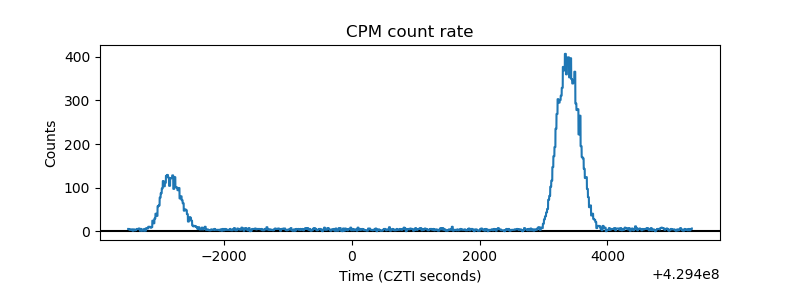 |
| CZT Counter | 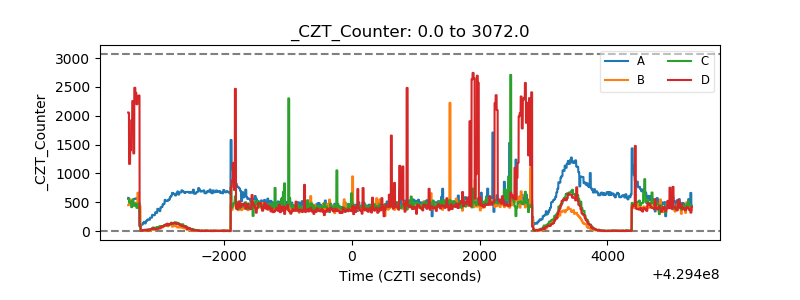 |
| +2.5 Volts monitor | 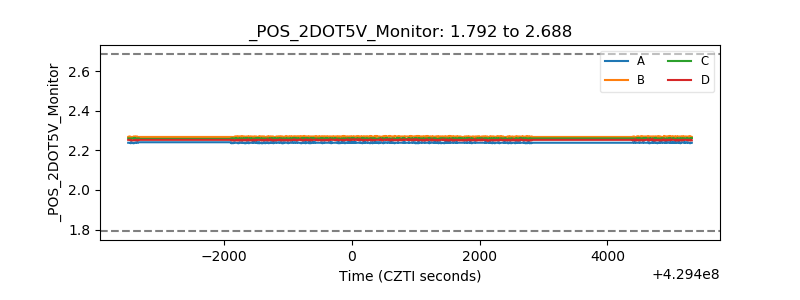 |
| +5 Volts monitor | 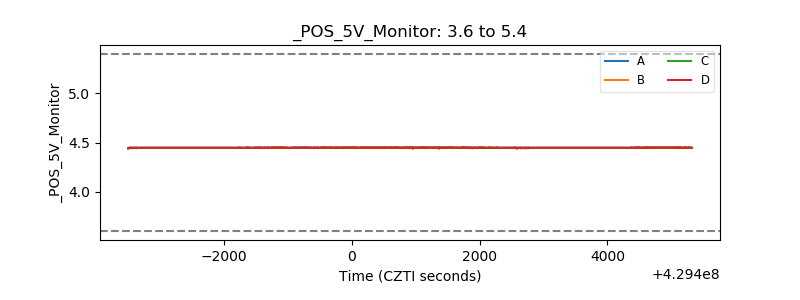 |
| _ROLL_ROT | 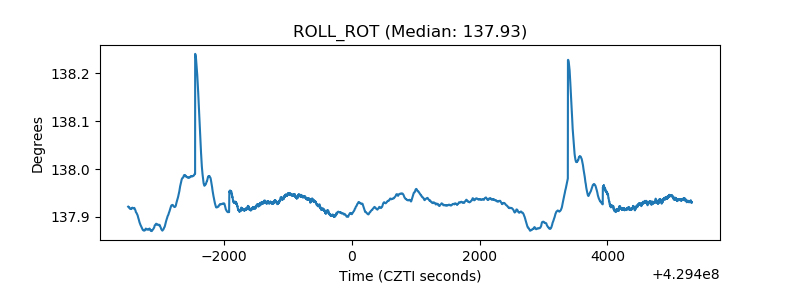 |
| _Roll_DEC | 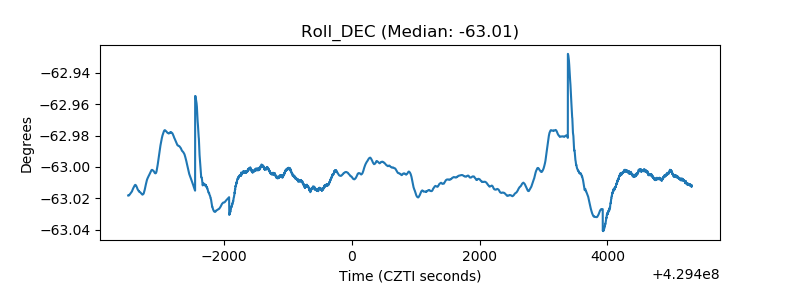 |
| _Roll_RA | 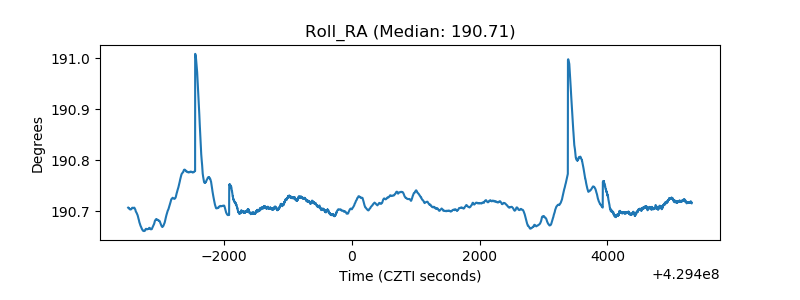 |
| Veto Counter | 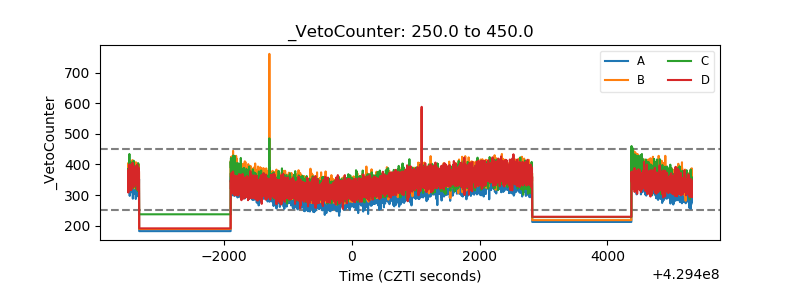 |